I. INTRODUCTION
Glass-ceramics (GCs) are polycrystalline ceramic matrices formed through the controlled nucleation and growth of crystalline phases in the precursor glass. The GC is usually made in two steps: first, the precursor glass is made by the normal melt quenching technique, then, a structural phase transition is thermally induced to transform into a composite material formed by at least one crystalline phase dispersed within the glass matrix.Reference Goncalves, Santos and Almeida1 Such matrices have been intensively studied since their discovery in the 1950s, which can be used in industry, telecommunications, or medicine. In the past two decades, GCs with large transparency have also shown potential optical applications as large telescope mirror blanks, liquid crystal displays, solar concentrator cells, and photonic devices.Reference Goncalves, Santos and Almeida1
The oxyfluoride GCs doped with rare earth (RE) ions have been investigated widely in the past decades, as they provide a desirable low phonon energy fluoride environment for active RE ions while maintaining the advantages of oxide glasses, such as high mechanical strength, chemical durability, and thermal stability.Reference Goncalves, Santos and Almeida1 In such materials, fluoride nanocrystals are embedded in oxide glass matrices homogeneously, and RE3+ ions are enriched in the precipitated fluoride nanocrystals. Due to the much smaller size of the precipitated crystals than the wavelength of visible and near infrared (NIR) light as well as the matching of the refractive index between nanocrystals and the glassy host, these transparent GCs showed high absorption in the visible-NIR regions.Reference Tick2,Reference Tick, Borrelli and Reaney3 Many investigations involving RE3+ ion-doped GCs containing PbxCd1−xF2 or β-PbF2 nanocrystals contain the well known poisonous raw materials such as lead fluoride and cadmium fluoride and therefore limited their extensive applications.Reference Wang and Ohwaki4–Reference Tikhomirov, Seddon, Ferrari, Montagna, Santos and Almeida6 The alkaline-earth fluorides are important optical raw materials with high solubility for both sensitizer and activator RE3+ ions, which have been successfully used as crystal laser hosts.Reference Wells and Reeves7 The transparent glass ceramics (TGCs) containing MF2:RE3+ (M = Ca2+ and Ba2+) nanocrystals with low phonon energy and large transfer coefficient between RE3+ ions have been of great interest owing to their possible applications in optical materials.Reference Babu, Jang, Rao, Shi, Jayasankar, Lavin and Seo8–Reference Grover, Achary, Patwe and Tyagi10
The properties of RE3+-doped TGCs are very much useful for increasing the efficiency of solar cells because of inhomogeneous broadening in absorption spectra of RE3+ ions, due to disorder of the host, which allows absorption of larger part of the solar spectrum. One of the main factors for lower efficiency of conventional amorphous silicon solar cells is the loss of solar energy in the NIR due to the band gap of 1.7 eV. The sub-band gap losses can be reduced by optical conversion of the infrared light to the shorter wave lengths in solid-state materials doped with RE3+ ions. Several upconversion studies of RE3+-doped materials, with 980 nm excitation, have been reported to be applicable to amorphous silicon solar cells.Reference Li, Zhang, Zhang, Luo, Ren, Zhao, Wang, Sun and Yan11
Among all the RE3+ ions, Er3+ ion is recognized as one of the most popular and efficient ions for obtaining upconversion emission, because it has abundant energy level structure and can be efficiently excited by 980 nm laser diode (LD). Recently, Er3+-doped and Er3+-Yb3+ co-doped TGCs containing SrF2 nanocrystals were successfully prepared and their spectroscopic properties were investigated.Reference Qiao, Fan, Wang and Wang12,Reference Qiao, Fan, Wang and Zhang13 In particular, materials doped with Er3+ ions, having optically applicable bands at around 540, 650, 980, and 1540 nm and can be extensively used in optoelectronic materials.Reference Oliveira, De Araujo, Gouveia-Neto, Sombra, Medeiros Neto and Aranha14–Reference Man, Pun and Chung16 The present work reports the detailed spectroscopic properties of 2.0 mol% Er3+-doped oxyfluoride transparent glass and GCs containing SrF2 nanocrystals.
II. EXPERIMENTAL METHODS
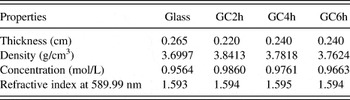
Er3+-doped oxyfluoride glass of composition (mol%) 41SiO2-10Al2O3-24 LiF-23SrF2-2.0Er2O3 was prepared by the conventional melt quenching technique at a temperature of 1450 °C for 2 h using a platinum-rhodium crucible. The precursor glasses are subjected to heat treatments at 600 °C, near the crystallization peak for 2, 4, and 6 h, which are hereafter referred to as GC2h, GC4h, and GC6h, respectively. The physical properties such as density was determined by Archimedes’s method using distilled water as an immersion liquid and refractive index was measured using an ellipsometer (Woollam - M-2000) at sodium wave length (589.99 nm) and these values are given in Table I. Differential thermal analysis (DTA) measurements were carried out on SDT Q 600, V8.3 Build 101 differential thermal analyzer (New Castle, DE). X-ray diffraction (XRD) spectra were recorded with an x-ray diffractometer (Smart lab-RIGAKU, Tokyo, Japan) using the Cu Kα radiation. Transmission electron micrographs (TEM) were recorded in a JEOL-TEM 2010 (Tokyo, Japan) with an accelerating voltage of 200 kV. Absorption spectra were recorded on a UV-visible-NIR spectrophotometer (Hitachi U-3400, Tokyo, Japan). Stokes and upconversion emission spectra were recorded with a monochromator (DK240) having PMT, exciting at 365 nm light emitting diode (LED) and at 980 nm LD, respectively. Luminescence decay curves of the 4S3/2 level of Er3+ ions were measured using a digital storage oscilloscope (Lecroy - 9310A, Chestnut Ridge, NY) pumped by the third harmonic (355 nm) of a Nd:YAG laser (Spectra Physics, SL802G, Santa Clara, CA). All measurements were carried out at room temperature.
Physical properties of Er3+-doped oxyfluoride glass and GCs (GC2h, GC4h, and GC6h).

III. RESULTS AND DISCUSSION
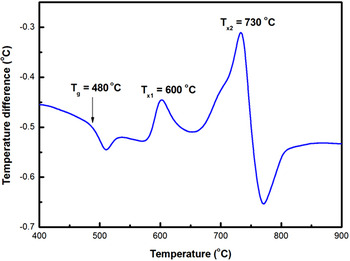
Figure 1 shows the DTA curve of the present glass where T g (480 °C), T x1 (600 °C), and T x2 (730 °C) stand for the glass transition, first and second crystallization temperatures, respectively. XRD results show that the first crystallization peak T x1 is ascribed to the precipitation of SrF2 crystals and the second crystallization peak T x2 to the bulk crystallization process of the glass matrix.
DTA curve of the as-made oxyfluoride glass.

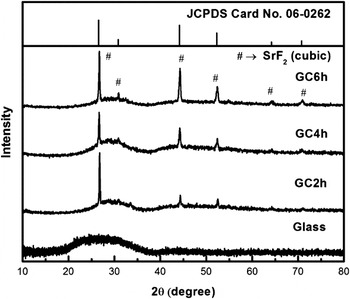
The XRD patterns of glass and GCs (GC2h, GC4h, and GC6h) are shown in Fig. 2. As expected, the XRD pattern of the glass contains two broad curves, typical of structures without long-range order. For the GCs, there are a number of narrow and relatively intense peaks that show a diffraction pattern of a crystalline phase, with more intense peaks for the GC6h sample, indicating its higher crystalline nature and/or larger size of the nanocrystals. Analysis of the peaks reveals that the sample contains a cubic SrF2 crystalline phase with JCPDS standard card No. 06-0262 and from peak widths of the XRD spectra, average size of the nanocrystals have been calculated using the Scherrer formula,
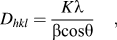 $$D_{hkl} = {{K{\rm{\lambda }}} \over {{\rm{\beta cos\theta }}}}\quad ,$$
where D hkl is the crystal size in the vertical direction of (hkl), λ is the wave length of x-rays, θ is the angle of diffraction, β is the full width at half maximum of the diffraction peak and K = 0.90.Reference Kawamoto, Kanno and Qiu17 The average sizes of nanocrystals have been determined using the above formula and are found to be 35, 39, and 40 nm for GC2h, GC4h, and GC6h samples, respectively. A similar crystal size (38 nm) of SrF2 nanocrystals was reported in the Er3+-Yb3+ co-doped GCs.Reference Qiao, Fan, Wang and Zhang13
XRD patterns of the glass and the GCs (GC2h, GC4h, and GC6h).

The TEM morphology of 2.0 mol% Er3+-doped GC6h is shown in Fig. 3. It can be seen that most of the particles are in clusters of uniform size and few particles are agglomerates with an irregular shape. The agglomerates observed may be due to alcohol used for dispersion of powders during TEM analysis. A few particles show nano-sized ellipse-like morphology, with an average particle size of 40 nm. The selected area electron diffraction (SAED) pattern shows concentric rings indicating polycrystalline nature of the GCs and is shown in the inset of Fig. 3. All diffraction rings can be identified as the cubic structure and is consistent with the XRD pattern.
TEM micrograph of 2.0 mol% Er3+-doped GC6h sample and the inset is the SAED pattern.

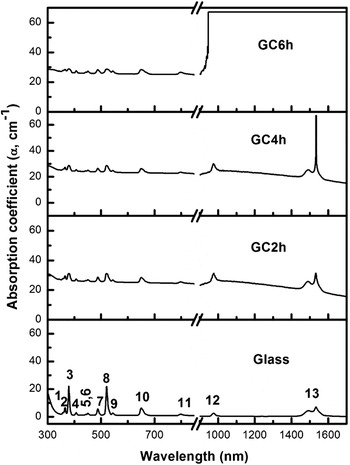
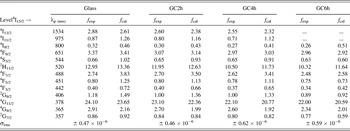
Absorption spectra of 2.0 mol% Er3+-doped oxyfluoride glass and GCs in the UV-visible-NIR range (300–1700 nm) are shown in Fig. 4. There are 13 and 11 bands in the absorption spectra of glass and GCs, respectively, which are assigned to transitions from the 4I15/2 ground state to the excited states of the Er3+ ion. From absorption spectra it can be found that TGCs containing SrF2 nanocrystals can be obtained by appropriate thermal treatment of the precursor glass around the first crystallization temperature. By increasing the time of thermal treatment, however, the GCs gradually lost their transparency. In the present GCs, GC2h and GC4h are fully transparent but GC6h is slightly turbid. The decrease in transparency might be due to light scattering of larger nanocrystals. According to Rayleigh-Gans model,Reference Kerker18 TGCs can be obtained if the radii of nanocrystals are less than 15 nm and the refractive index difference between the glass and nanocrystalline phase is less than 0.1. In the present GCs, the size of SrF2 nanocrystals increases gradually with increase in time of thermal treatment resulting in a gradual decrease in transparency. The absorption band positions (λp), experimental (f exp) and calculated (f cal) oscillator strengths (10−6 cm−1) of 2.0 mol% Er3+-doped glass and GCs have been determined using the relationships described elsewhereReference Renuka Devi and Jayasankar19 and are presented in Table II. Reasonably small root mean square (σrms) deviations (×10−6 cm−1) of ±0.47, ±0.46, ±0.62, and ±0.47 are found for glass, GC2h, GC4h, and GC6h, respectively, indicating the good fit between the experimental and calculated oscillator strengths.
Absorption spectra of the Er3+ ions in the glass and GCs (GC2h, GC4h, and GC6h). The absorption bands were assigned to the transitions from ground state to the excited states (1) 2G7/2, (2) 4G9/2, (3) 4G11/2, (4) 2G9/2, (5) 4F3/2, (6) 4F5/2, (7) 4F7/2, (8) 2H11/2, (9) 4S3/2, (10) 4F9/2, (11) 4I9/2, (12) 4I11/2, and (13) 4I13/2.

The absorption band positions (λp), experimental (f exp) and calculated (f cal) oscillator strengths (10−6) of 2.0 mol% Er3+-doped glass and GCs (GC2h, GC4h, and GC6h). Absorption transitions are from the ground state, 4I15/2, to the excited states.

The absorption bands, 4I15/2 → 4G11/2 and 4I15/2 → 2H11/2 located at 378 and 520 nm, respectively, are most intense and are called hypersensitive transitions (HSTs).Reference Babu, Seo, Kesavulu, Jang and Jayasankar20,Reference Gorller-Walrand, Binnemans, Gschneidner and Eyring21 The HSTs are sensitive to small changes of the environment around RE ionsReference Gorller-Walrand, Binnemans, Gschneidner and Eyring21,Reference Pisarski22 and follow the selection rules, |ΔS| = 0, |ΔL| ≤ 2, and |ΔJ| ≤ 2.Reference Gorller-Walrand, Binnemans, Gschneidner and Eyring21 From Table II, it is interesting to note that oscillator strengths of these HSTs are smaller in glass ceramics than in glass. This is an indication for the lower site symmetryReference Gorller-Walrand, Binnemans, Gschneidner and Eyring21 (higher asymmetry) of Er3+ ions in the glass. In general, Ω2 is sensitive to the asymmetry in the vicinity of the RE ions (short-range effects)Reference Tanabe, Ohyagi, Soga and Hanada23 and the changes in Ω6 are correlated with long-range effects of glass host.Reference Tanabe, Hayash, Hanada and Onodera24 For many instances, Ω2 is also found to be affected by the covalence between the RE ions and the ligand anions.Reference Heidepriem, Ehrt, Bettinelli and Speghini25 In traditional glasses, the Ω2 values decrease with the change of host from oxide to fluorides.Reference Zou and Izumitani26
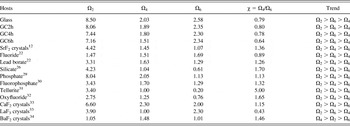
Using the experimental oscillator strengths of various absorption bands and refractive index, the Judd-Ofelt (JO) intensity parameters (Ωλ, λ = 2, 4, and 6) have been derivedReference Judd27,Reference Ofelt28 and are presented in Table III. For the calculation of JO parameters, the matrix elements, ||Uλ||2, have been taken from (Ref. Reference Renuka Devi and Jayasankar19). As can be seen from Table III, with increase in the time of thermal treatment, Ω2 gradually decreases indicating that the ligand field of Er3+ ion is more ionic in the GCs. This is due to progressive incorporation of Er3+ ions into SrF2 nanocrystals. During the nucleation and formation of SrF2 nanocrystals, Er3+ ions act as crystal nucleus. Thus the Er3+ ions might enter into the SrF2 nanocrystalline phase and the Sr2+ ions are partially substituted by Er3+ ions. The Er3+ ions in the SrF2 nanocrystal are coordinated by F− ions and more ionic environment of the Er3+ ions in the GCs can be expected in comparison with the glass, which leads to the decrease of Ω2 parameter.
The JO parameters (Ωλ, × 10−20 cm2) of Er3+ ions in the glass, GCs (GC2h, GC4h, and GC6h) and other hosts.

The JO parameters (×10−20 cm2) of glass are Ω2 = 8.50, Ω4 = 2.03, and Ω6 = 2.58. These values are compared with Er3+: glass systems in Table III that include silicate,Reference Zou and Izumitani26 phosphate,Reference Yu, Song, Wang, Luo, Han, Cheng, Sun, Tian and Pun29 fluorophosphate,Reference Zemon, Lambert, Andew, Miniscalco, Hall, Wei and Folweiler30 lead borate,Reference Pisarski22 tellurite,Reference Nandi, Jose, Jayakrishnan, Debbarma, Chalapathi, Alti, Dharmadhikari, Dharmadhikari and Mathur31 fluoride,Reference Pisarski22 oxyfluoride,Reference Qiao, Fan, Wang and Zhang32 SrF2,Reference Qiao, Fan, Wang and Wang12 CaF2,Reference Kumar, Riman, Chae, Jang, Bae and Moon33 LaF2,Reference Kumar, Riman, Chae, Jang, Bae and Moon33 and BaF2,Reference Patel, Reddy and Nash-Stevenson34 crystals. The trend of JO parameters (Ω2 > Ω6 > Ω4) is similar for glass and GCs, fluorideReference Pisarski22 and LaF2Reference Sardar, Russell and Yow35 systems whereas for other glass systems (Er3+: silicate,Reference Zou and Izumitani26 fluorophosphate,Reference Zemon, Lambert, Andew, Miniscalco, Hall, Wei and Folweiler30 lead borate,Reference Pisarski22 tellurite,Reference Nandi, Jose, Jayakrishnan, Debbarma, Chalapathi, Alti, Dharmadhikari, Dharmadhikari and Mathur31 oxyfluoride,Reference Qiao, Fan, Wang and Zhang32 SrF2,Reference Qiao, Fan, Wang and Wang12 and CaF2,Reference Kumar, Riman, Chae, Jang, Bae and Moon33) the parameters follow the general trend as Ω2 > Ω4 > Ω6. The trend of JO parameters for Er3+:BaF2 crystalsReference Patel, Reddy and Nash-Stevenson34 (Ω4 > Ω2 > Ω6) differs from the other two hosts (Er3+: LaF2 and Er3+: CaF2). This variation in trends of JO parameters can be attributed to the large and more sensitive values of oscillator strengths of the two HSTs. In the present glass, the value of Ω2 is larger than the other two parameters. This tendency is also seen in other oxide glasses shown in Table III. The larger value of Ω2 in the present glass suggests a larger degree of covalency of the Er–O bond and/or asymmetry of the Er3+ sites than other Er3+: glass systems that are compared in Table III.
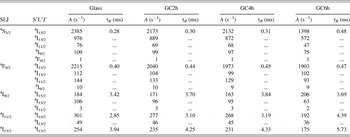
The Ω4 parameter is affected by the factor causing changes in both Ω2 and Ω6 and is not usually studied for local structure investigations.Reference Heidepriem, Ehrt, Bettinelli and Speghini25 However, the spectroscopic quality factor χ (=Ω4/Ω6), which was initially established only to quantify the IR emission of Nd3+ ions,Reference Qiao, Fan, Wang and Zhang32 is an important predictor for stimulated emission in a laser active medium.Reference Sardar, Russell and Yow35 The values of χ have been calculated for the present glass and GCs and are compared to those of reported Er3+: glass systems in Table III. The χ values of glass and GCs are within the range of 0.22–1.5, found for Nd3+ ions in different hosts.Reference Kaminiskii36 The smaller value of χ is associated with more intense emission of the 4S3/2 → 4I15/2 transition. From Table III, it can be found that the value of χ decreases with increasing time of thermal treatment indicating the higher intensity green emission of GCs compared to glass. The JO parameters have been used to predict radiative propertiesReference Babu, Seo, Jang, Balakrishnaiah, Jayasankar and Joshi37 of the important luminescence levels of Er3+ in glass and GCs such as transition probabilities (A) and lifetimes (τR) and are presented in Table IV. The radiative lifetimes of Er3+ emission transitions are dominated by Ω4 and Ω6 since the square of the matrix elements ||U(2)|| of these transitions are zero or much smaller than ||U(4)|| and ||U(6)|| except for the HSTs, 2H11/2 → 4I15/2 and 2G11/2 → 4I15/2. For these transitions, Ω2 plays an important role. The τR values of the luminescent levels of present systems are compared to those of reported Er3+: glass systems in Table V. As can be seen, the τR values for the present glass follow the trend as 4I13/2 > 4I9/2 > 4I11/2 > 4F9/2 > 4S3/2. A similar trend was also found for Er3+: lead phosphate,Reference Santos, Guedes, Loong, Boatner, Moura, de Araujo, Jacinto and Vermelho38 and tellurite,Reference Lin, Liu, Pun, Ma, Peng, An, Yu and Jiang39 glass systems whereas for Er3+: oxyfluoride,Reference Qiao, Fan, Wang and Wang12 fluoride,Reference Pisarski22 and lead borate,Reference Pisarski22 glass systems, the τR values decrease continuously with increase in energy of the excited states. Further, the τR values in the present glass are less than those of Er3+: oxyfluoride,Reference Qiao, Fan, Wang and Wang12 fluoride,Reference Pisarski22 and lead borate,Reference Pisarski22 glass systems but are slightly more than Er3+: lead phosphate,Reference Santos, Guedes, Loong, Boatner, Moura, de Araujo, Jacinto and Vermelho38 and much more than tellurite,Reference Lin, Liu, Pun, Ma, Peng, An, Yu and Jiang39 glass systems.
Emission transitions (SLJ → S′L′J′), predicted radiative transition probabilities (A) and lifetimes (τR) of some important emission levels of 2.0 mol% Er3+-doped glass and GCs (GC2h, GC4h, and GC6h).

Comparison of predicted radiative lifetimes (ms) of some important luminescence levels of Er3+-doped glass and GCs (GC2h, GC4h, and GC6h) with some reported Er3+: Glasses.

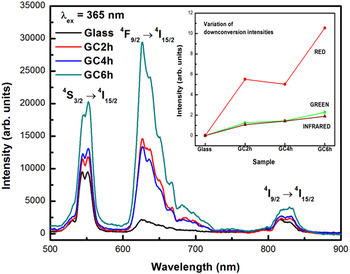
Stokes emission spectra of the glass and GCs, measured by exciting at 365 nm, are shown in Fig. 5. The luminescence bands of the Er3+ ions can be assigned to 2H11/2 → 4I15/2 (530 nm), 4S3/2 → 4I15/2 (552 nm), 4F9/2 → 4I15/2 (627 nm), and 4I9/2 → 4I15/2 (824 nm) transitions. As can be seen, red emission bands (4F9/2 → 4I15/2) of the GCs are split into several sharp peaks. It is well known that Stark splitting is caused by the crystal field. Splitting of emission bands shows that Er3+ ions have been incorporated into the SrF2 nanocrystals. The overall increase in Stokes emission in GCs is due to lowering of phonon energy of the host, which reduces multiphonon relaxation between the energy levels due to progressive incorporation of Er3+ ions into SrF2 nanocrystals. Stronger red emission compared to green is attributed to efficiency of cross-relaxation channel, 4F7/2, 4I11/2 →4F9/2, 4F9/2 due to matching of energy levels. The inset of Fig. 5 shows the variation of downconversion intensities versus glass and GC samples. However, all the GC samples show not only the enhanced green emission from the 4S3/2 level but also more than ten times stronger red emission from the 4F9/2 level and stronger near-infrared emission from the 4I9/2 level because of reduced multiphonon relaxation. It implies that Er3+ ions are incorporated into SrF2 nanocrystals with lower phonon energy environment during crystallization.
Stokes emission spectra (λex = 365 nm) of the Er3+ ions in the glass and GCs (GC2h, GC4h, and GC6h) and the inset shows the variation of downconversion intensities for glass and GC samples.

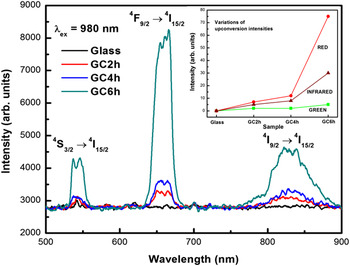
Upconversion luminescence spectra of glass and GCs, measured with 980 nm excitation, are shown in Fig. 6. The emission bands can be assigned to 4S3/2 → 4I15/2 (545 nm), 4F9/2 → 4I15/2 (664 nm) and 4I9/2 → 4I15/2 (828 nm) transitions, respectively. In the glass, upconversion luminescence is very weak and can hardly be seen. However, in GCs, upconversion luminescence increases with increase in time of thermal treatment. Furthermore, with the increase in time of thermal treatment, Stark splitting of the 659 nm upconversion emission band increases gradually, which further indicates that there is progressive incorporation of Er3+ ions into SrF2 nanocrystals. The inset of Fig. 6 shows the variation of upconversion intensities in glass and GC samples. There is a small increase in green and near-infrared emission intensities in GC samples compared to glass. In contrast, compared with the Stokes emission in Fig. 5, the relative intensity of red to green or NIR emission is several times enhanced in upconversion emission. It implies that the cross-relaxation of 4S3/2 → 4F9/2 and 4I9/2 → 4F9/2 feeds the 4F9/2 state, which dramatically enhances the red emission intensity.
Upconversion emission spectra (λex = 980 nm) of the Er3+ ions in the glass and GCs (GC2h, GC4h, and GC6h) and the inset shows the variation of upconversion intensities for glass and GC samples.

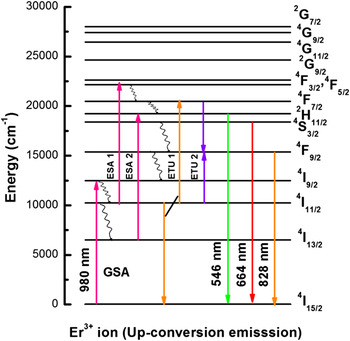
Partial energy level diagram of Er3+ ions in glass and GCs illustrating the mechanisms of upconversion emissions is shown in Fig. 7. When glass and GCs are excited with 980 nm wave length radiation, the Er3+ ions in the ground state absorb the pump photons and are excited to the 4I9/2 level. This process is known as GSA. Then Er3+ ions relax nonradiatively to the 4I11/2 and 4I13/2 levels, in which part of the excitation energy in the 4I11/2 level further relaxes radiatively and nonradiatively to the 4I13/2 level. From the 4I11/2 and 4I13/2 levels, the Er3+ ions are further excited to the 4F3/2 and 2H11/2 levels by the pump photons through the process known as excited state absorption (ESA) due to good energy matching. In Fig. 7, ESAs of 4I11/2 → 4F3/2 and 4I13/2 → 2H11/2 are denoted as ESA1 and ESA2, respectively. Out of these two, ESA2 is more probable due to the longer lifetime of the 4I13/2 level. The Er3+ ions pumped to the 4F3/2 level relax nonradiatively and populate the 2H11/2 level, which is also directly populated by the ESA2 process. Another possibility of excitation is by energy transfer from the 4I11/2 level [shown as energy transfer upconversion (ETU1) in Fig. 7] in which two Er3+ ions in the 4I11/2 level interact, and one ion gains energy and reaches the 4F7/2 level whereas the other loses energy and goes to the ground state. Most of the electrons in the 4F7/2 level then relax nonradiatively to the 2H11/2 level. Another process that depopulates the 4F7/2 level involves the interaction of two Er3+ ions, one of them in the 4I11/2 level and the other in the 4F7/2 level, both populating the 4F9/2 level (shown as ETU2 in Fig. 7). Out of the two ETU processes, ETU2 is responsible mainly for the enhanced red emission. All the above processes have been illustrated in Fig. 7. Because there are other metastable energy levels between the 4S3/2, 4F9/2 and 4I9/2 states and the ground state, the upconversion luminescence of Er3+ ions is usually baffled by the multiphonon relaxation. The multiphonon relaxation probability depends primarily upon the energy gap between two successive levels and phonon energy of the host.Reference Tanabe, Tamai, Hirao and Soga40 The lower the phonon energy of the host is, the smaller the multiphonon relaxation probability, and the longer the lifetime of the excited state. Owing to the smaller phonon energy of SrF2 nanocrystals (300 cm−1 for Sr–F),Reference Reisfeld and Jorgensen41 than that of silicate based glass matrix (1100 cm−1 for Si–O), the upconversion luminescence of Er3+ in the SrF2 nanocrystals is more intense than in glass. Thus the upconversion luminescence intensity of the GCs increases significantly with increase in time of thermal treatment due to increase in SrF2 nanocrystalline phase around the Er3+ ions.
Partial energy level diagram of the Er3+ ions and possible upconversion luminescence mechanisms under 980 nm excitation.

In the upconversion process, the relationship between the emission intensity I em and the IR excitation intensity I ex is
 $$I_{{\rm{em}}} \propto (I_{{\rm{ex}}} )^n \quad ,$$
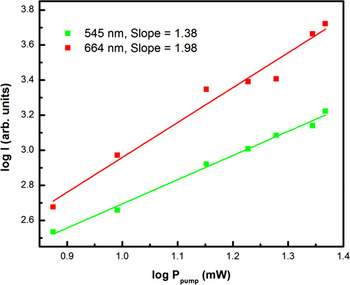
where n is the number of IR photons absorbed per visible photon emitted. Therefore, a plot of log (I em) versus log (I ex) should yield a straight line with a slope of n. Figure. 8 shows the pump power dependence of the up-conversion integral luminescence intensity corresponding to the 4F9/2 → 4I15/2 transition of the Er3+ ions in the GC6h sample. The slopes of the green and red emissions are 1.38 and 1.98, respectively. These results indicate that green (4S3/2 → 4I15/2) and red (4F9/2 → 4I15/2) luminescence mechanisms are related to the two-photon process. The possible up-conversion mechanisms can be described by ESA and/or ETU.Reference Fan, Wang, Qiao, Wang, Adam and Zhang42
Log-log plot of the pump power dependence of upconversion emission intensity of the Er3+ ions in the GC6h sample.

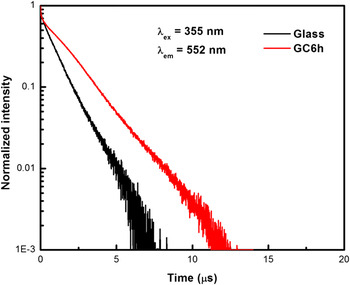
The luminescence decay curves of the 4S3/2 level in glass and GC6h have been measured by exciting with 355 nm from Nd-YAG laser and monitoring the emission at 552 nm and are shown in Fig. 9. The decay curves are found to be nonexponential for the glass and GC6h. The average lifetimes (τexp)Reference Lahoz, Martin, Mendez-Ramos and Nunez43 are estimated to be 1.1 and 11.6 μs for glass and GC6h, respectively. These results clearly indicate the incorporation of Er3+ ions into SrF2 nanocrystals in the GC6h sample resulting in the longer lifetime of the 4S3/2 level.Reference Fan, Wang, Qiao, Wang, Adam and Zhang42
Fluorescence decay curves of the 4S3/2 level of the Er3+ ions in the glass and GC6h sample.

IV. CONCLUSIONS
Er3+-doped transparent oxyfluoride GCs containing SrF2 nanocrystals have been prepared and their optical and upconversion properties were characterized. The Ω2 JO parameter gradually decreases from glass to GCs indicating the gradual change of the environment around the Er3+ ions from oxide to fluoride. The intensities of both the Stokes and upconversion emissions increase significantly with increase in time of thermal treatment of the glass. The mechanism of upconversion emission is found to be a two-photon process. Lifetime of the 4S3/2 level of the Er3+ ions in the GCs is found to be ten times higher than that of glass due to the lower phonon energy of SrF2 nanocrystals surrounding the Er3+ ions in the GCs. The above results clearly indicate that the Er3+ ions are progressively incorporated into SrF2 nanocrystals with increase in time of thermal treatment at the first crystallization temperature of the glass.
ACKNOWLEDGMENTS
This work was supported by the Basic Science Research Program through the National Research Foundation of Korea funded by the Ministry of Education, Science and Technology (Grant No. 2010–0013646). One of the authors (CKJ) is also grateful to UGC, New Delhi, India for the sanction of Major Research Project (F. No. 40 - 435/2011 (SR), dated 04-07–2011).