1. Introduction
A large body of literature has shown that colonial shocks, from the slave trade and forced labor, to indirect rule and education policies, shaped development in the long-run [Lange (Reference Lange2004), Nunn (Reference Nunn2008), Dell (Reference Dell2010), and Wantchekon et al. (Reference Wantchekon, Klašnja and Novta2015) among others].Footnote 1 Less-well understood is how these shocks have determined outcomes today. Most cases studied entailed institutional, cultural, and structural transformations, which all together induced persistent economic change. An important question is then to determine the ways in which these elements relate to different dimensions of development. In this paper, we focus on a specific case where we can separate a technological and a cultural mechanism: the effect of Christian missions on HIV in Africa. On the one hand, missionaries pioneered the advancement of western medicine in the early 20th century. On the other hand, conversion to Christianity produced beliefs and behaviors that affect the risk of contagion. Comparing missions that invested in health facilities with those that did not, and the Christian population with the rest, we can separately address cultural from infrastructural effects.
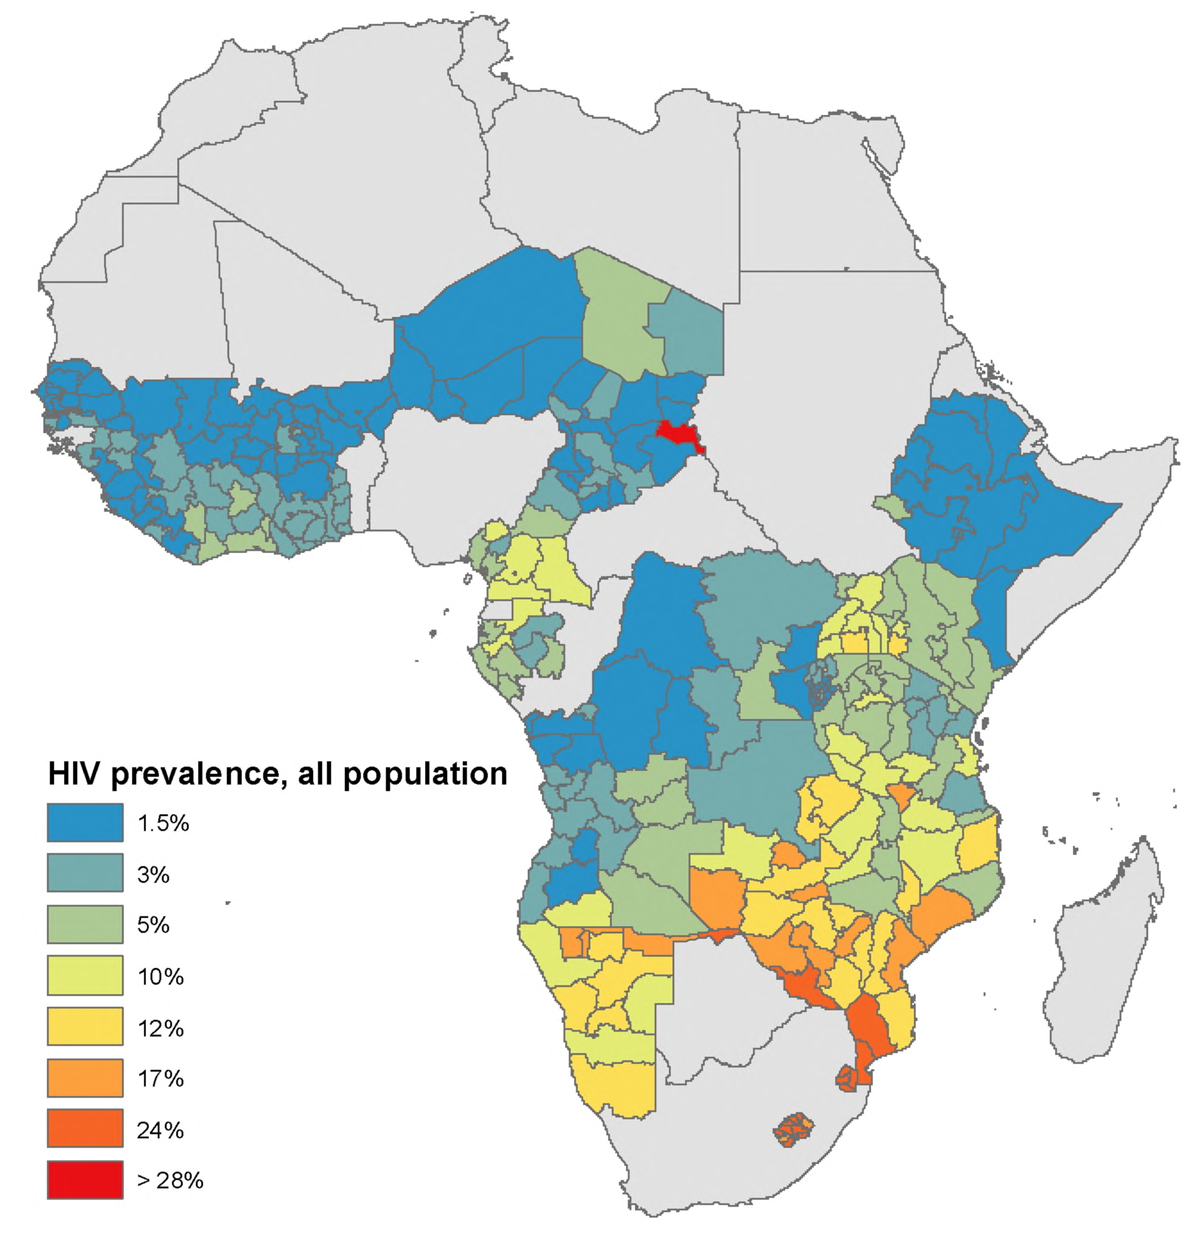
UNAIDS estimates that around 36.9 million people were living with HIV as of 2017, and more than two-thirds of them live in Africa.Footnote 2 As such, it is one of the deadliest pandemics in modern history, and an important obstacle to development in many countries. This paper delves into the question of the historical determinants of this disease in Africa, by focusing on the long-term consequences of early Christian missionaries on HIV. We hypothesize that two distinct forces can have influenced the disease: provision of health care and conversion to Christianity (Figure 1).
HIV prevalence estimates at the subnational level. Note: The figure shows the average HIV prevalence rates at the subnational level computed by the DHS geographic data repository.

On the one hand, missionaries were almost the only ones providing Western medical services to the African population, from their early expansion in middle of the 19th century throughout the colonial period. Both Protestant and Catholic missionaries, many of whom were doctors and nurses, indeed pioneered the development of Western healthcare facilities for the Indigenous population [Vaughan (Reference Vaughan1991, Ch. 3)].Footnote 3 Historical health provision matters for two main reasons. First, the literature in African medical history and public health has shown the persistence of missionary health care [Ranger (Reference Ranger1981), Good (Reference Good1991)], a fact that this paper also corroborates. Health centers today can affect HIV prevalence because they distribute anti-retrovirals and are the epicenters of awareness and testing campaigns.Footnote 4 Second, even without infrastructure persistence, a healthier population in the past can have slowed the spread of HIV because other sexually transmitted diseases (STDs), such as syphilis, greatly increase the likelihood of contagion.Footnote 5 These diseases were already known, public health campaigns were designed to prevent them, and treatments against the disease or their symptoms started improving from the early 20th century [de Sousa et al. (Reference de Sousa, Müller, Lemey and Vandamme2010), Doyle et al. (Reference Doyle, zu Selhausen and Weisdorf2018)].
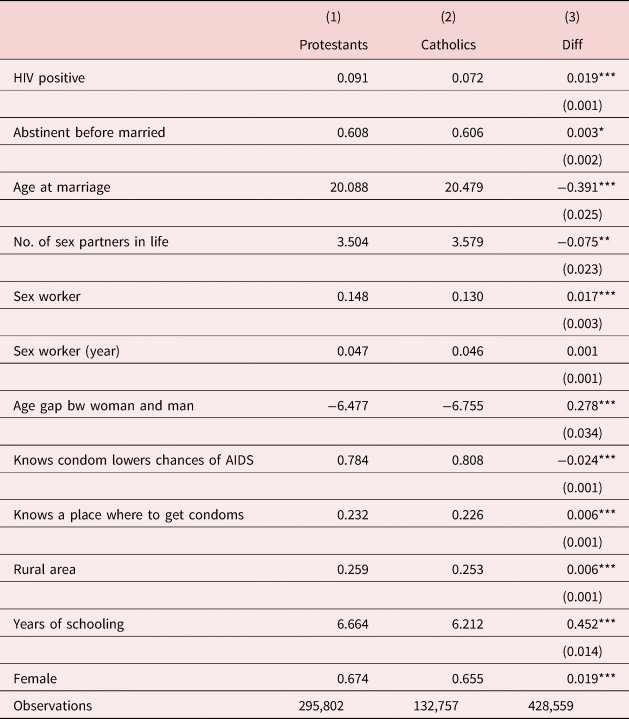
On the other hand, missions, and particularly Protestant missions, left a profound cultural imprint. Their ultimate objective, after all, was to convert the local population to Christianity, an enterprise in which they succeeded in the long run [Hastings (Reference Hastings1996), Nunn (Reference Nunn2010)]. Christianity is today the most common religion in Africa, and it is a religion that imposes a great number of explicit and implicit constraints on sexual behaviors (monogamy, abstinence outside and before marriage, or taboos over contraception for certain denominations, etc.).Footnote 6 The transformations of family structures and sexual behaviors brought about by Christianity can have ambiguous effects on HIV. Strict monogamy can protect against HIV as it reduces the risk of contagion [Bertocchi and Dimico (Reference Bertocchi and Dimico2015)]; however, sequential or unfaithful monogamy strongly correlates with larger HIV prevalence in Africa, because it leads to a more connected sexual network than polygyny [Reniers and Watkins (Reference Reniers and Watkins2010)]. Beyond the constraints imposed on practicants' sexual behaviors, Christianity may have had a broader sphere of influence on HIV. Local churches are involved in the design and implementation of many campaigns and sex-education curricula [Dupas (Reference Dupas2011), Mash and Mash (Reference Mash and Mash2013), Duflo et al. (Reference Duflo, Dupas and Kremer2015), Dupas et al. (Reference Dupas, Huillery and Seban2018)]. This paper thus proposes to address separately two forces, healthcare provision and conversion, through which early Christian missionaries may have influenced HIV in the long run.
To do so, we have completed a novel dataset of early Protestant and Catholic mission settlements in sub-Saharan Africa, that also accounts for their health facilities. For Protestant missions, we rely on an original dataset released with a previous paper [Cagé and Rueda (Reference Cagé and Rueda2016)]. The Protestant data were compiled using the 1903 Geography and Atlas of Christian Missions [Beach (Reference Beach1903)]. We complement these data with an entirely new dataset on Catholic missions and their health facilities. This dataset was compiled from the 1929 Atlas Hierarchicus [Streit (Reference Streit1929)], a publication from the Vatican's Congregation for the Propagation of Faith (Sacra Congregatio de Propaganda Fide). For each settlement, we documented its coordinates, the geographic and historical characteristics, as well as whether there was an investment in health facilities. Because there is a 20-year gap between the two sources, we complement the data on health facilities for former British colonies by geocoding all the health facilities reported in the British Blue Books up to 1920. We merge these data with contemporary individual-level geocoded data from the Demographic and Health Survey (DHS) compiled by USAID. The DHS are standardized nationally representative surveys in developing countries that collect biomarker data on HIV.
Our econometric analysis deals with two forms of selection. First, historical and geographical characteristics might have determined mission station location, preventing the comparison between regions close and far from these settlements. Early European missionaries, either Protestant or Catholic, did choose to locate in geographically favored areas that ultimately urbanized [Johnson (Reference Johnson1967), Nunn (Reference Nunn2010), Akyeampong et al. (Reference Akyeampong, Bates, Nunn and Robinson2014), Cagé and Rueda (Reference Cagé and Rueda2016), Jedwab et al. (Reference Jedwab, zu Selhausen and Moradi2018)], and we know that HIV is a disease of urban areas that are well connected into the transport network [Fox (Reference Fox2010), Pépin (Reference Pépin2011), Oster (Reference Oster2012)]. Second, different missionary stations invested in different activities such as health or education. There may be endogenous selection of missions into these activities.
To address selection in missionary locations, we follow Cagé and Rueda (Reference Cagé and Rueda2016) and restrict our sample to regions near historical mission settlements. Because regions near missions shared similar geographic, institutional, and cultural environments, this restriction isolates the specific effect of the investments from other possible long-term determinants of development that might be correlated with missionary location. We find that historical missionary presence is associated with higher probability of being tested positive for HIV. Ceteris paribus, a location 10 km away from a mission has a $11\%$ higher average HIV probability than one 20 km away. Importantly, our results are robust for focusing on the most urbanized areas. Regarding the mechanisms at play, we show that this effect is driven by the Christian population in our sample, and that this population exhibits riskier sexual behaviors. Furthermore, we investigate the long-term impact of proximity to a mission on non-STDs. We show that, unlike for HIV, proximity to missions is not associated with higher prevalence of anemia, the other biomarker reported in our data. Our findings thus suggest that conversion to Christianity is a possible mechanism to understand the worsening of HIV in regions exposed to historical missions. This result is consistent with the biomedical and historical literature on HIV in Africa.
To address selection of missions into health investments, we first note that differences between missions with and without health facilities suggest that health facilities were located in areas with larger population densities and closer to pre-colonial population settlements. If geographically confounding factors were driving our results, we would expect these locations to have larger, and not smaller HIV risk, because population density is one of the strongest determinants of HIV. However, there might still be other confounders affecting, within missions, both selection into health and HIV risk. Therefore, we control for observable geographic and historical covariates (among which ruggedness, suitability to Tse-Tse fly [Alsan (Reference Alsan2015)], and distance to other missionary facilities).Footnote 7 We show that, within regions close to missions, proximity to a historical missionary health facility decreases the likelihood of HIV. Ceteris paribus, a location 10 km away from a historical health facility has a $7\%$ lower average HIV probability than one 20 km away. We then develop a matching strategy that aims at isolating the effect of proximity to a mission with a health facility from the effect of proximity to a mission with similar characteristics, but that did not provide health services. The results are robust to this approach and of similar order of magnitude. Furthermore, we assess the bias due to unobservables using the sensitivity of the treatment to added controls [Oster (Reference Oster2016)].
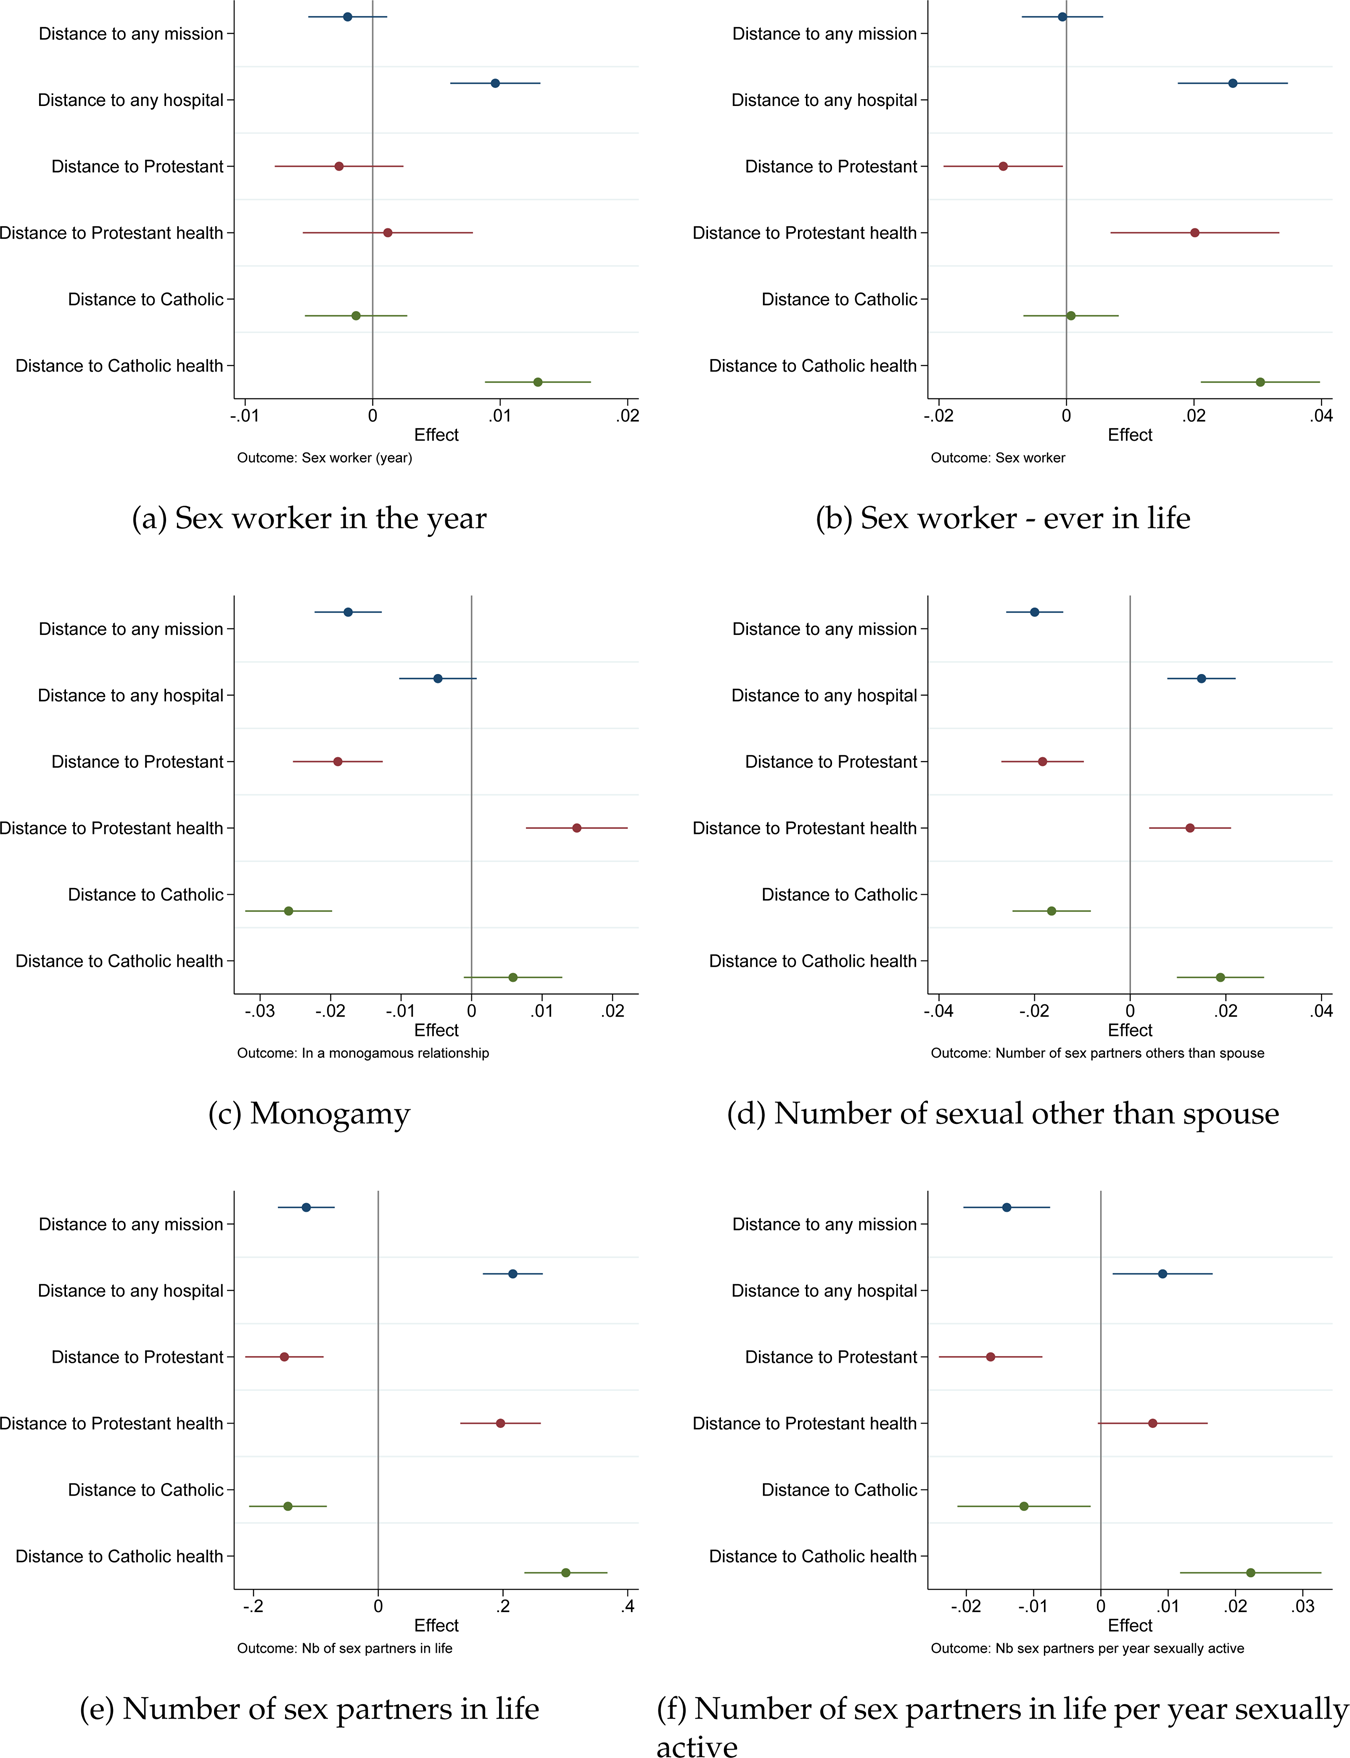
Finally, we provide evidence that the persistence of health infrastructure, and safer sexual norms, rather than the practice of safer sex, can explain the effect.Footnote 8 In particular, we show that living in regions close to health investments also relates to better access to health care today, and decreases the likelihood of using of sex workers' services, the number of sexual partners other than spouse and the number of sexual partners over the lifetime.
Although we cannot ultimately separate the effect of health investments from other mission characteristics, all of our results taken together point in the direction that historical health investments played a role in determining HIV today. We are also aware of the difficulty in separating the effect of missionary presence from potential confounders, in particular urbanization. However, the robustness of our results to different strategies, the fact that they hold even when concentrating on very well-connected locations, and that they seem driven by the Christian population, all suggest that missionary presence and conversion are also relevant historical determinants of HIV.
1.1 Related literature
This paper contributes to the growing literature in economics on the historical and social determinants of health outcomes, in particular STDs. A number of papers have aimed at understanding differences in prevalence. Oster (Reference Oster2005) shows theoretically that differences between African countries can be attributed to differences in sexual behavior (e.g., the number of sexual partners), male circumcision, and the timing of the epidemic. Oster (Reference Oster2012) provides empirical evidence for a positive relationship between exports and new HIV infections. Bertocchi and Dimico (Reference Bertocchi and Dimico2015) study the long-term effects of family structure and sexual behavior (in particular polygyny) on HIV prevalence in sub-Saharan Africa, and Alsan and Cutler (Reference Alsan and Cutler2010, Reference Alsan and Cutler2013) investigate the mechanisms behind HIV decline in Uganda. Anderson (Reference Anderson2018) shows that the legal origins of the formerly colonized sub-Saharan African countries determine current day female HIV rates. We contribute to this literature by investigating the role played by historical determinants. To the extent of our knowledge, Mantovanelli (Reference Mantovanelli2016) is the only other paper considering the impact of missionary activities on HIV. He compares the effect of Protestant and Catholic missions on contemporary levels of HIV, and finds that Catholic missions are associated with lower levels of HIV infection and explores the role of sexual behaviors to explain this pattern. We complement his work using more information at the mission level. Since our data identifies missions that provided health services, we can estimate the effect of health infrastructure. Moreover, we also devote attention to the role of conversion to Christianity, a cultural mechanism not considered in his work.
The early work of Protestant missionaries has been largely associated with improving development in the long term, through an increase in social capital [Woodberry (Reference Woodberry2012), Cagé and Rueda (Reference Cagé and Rueda2016)], human capital [Gallego and Woodberry (Reference Gallego and Woodberry2010), Acemoglu et al. (Reference Acemoglu, Gallego and Robinson2014), McCleary (Reference McCleary2015), Waldinger (Reference Waldinger2017), Valencia-Caicedo (Reference Valencia-Caicedo2018)], or gender equality [Akyeampong et al. (Reference Akyeampong, Bates, Nunn and Robinson2014, Ch. 16)]. Calvi and Mantovanelli (Reference Calvi and Mantovanelli2018) study the positive long-term consequences of Protestant missions in India on health outcomes (individuals' body mass index). In this paper, we tell a more nuanced story as we establish that Christian missions had conflicting effects on HIV.Footnote 9
Our paper is more broadly related to the literature on the persistent effect of historical events on economic development. As noticed by Feyrer and Sacerdote (Reference Feyrer and Sacerdote2009) and Huillery (Reference Huillery2009, Reference Huillery2011), historical events can explain heterogeneous development dynamics. Micro-oriented studies isolate specific channels through which a development dynamic can be durably established [Nunn (Reference Nunn2008), Huillery (Reference Huillery2009), Alesina et al. (Reference Alesina, Easterly and Matuszeski2011), Voigtländer and Voth (Reference Voigtländer and Voth2012), Jha (Reference Jha2013), Michalopoulos and Papaioannou (Reference Michalopoulos and Papaioannou2013, Reference Michalopoulos and Papaioannou2016), Grosfeld and Zhuravskaya (Reference Grosfeld and Zhuravskaya2015), Dell et al. (Reference Dell, Lane and Querubin2017)]. Early investments are of particular importance in the case of sub-Saharan Africa [see e.g., Wantchekon et al. (Reference Wantchekon, Klašnja and Novta2015)].Footnote 10 Lowes and Montero (Reference Lowes and Montero2017b) document the extent to which exposure to colonial medical campaigns affect trust in modern medicine today, and in particular consent to take a blood test for HIV. They also consider health outcomes and provide evidence that the colonial medicine campaigns are associated with higher levels of HIV in Cameroon.
Finally, our paper complements the growing literature in economics on HIV prevention [Dupas (Reference Dupas2011), Mash and Mash (Reference Mash and Mash2013), Duflo et al. (Reference Duflo, Dupas and Kremer2015), Dupas et al. (Reference Dupas, Huillery and Seban2018)].Footnote 11 In accordance with this literature, we show that the Christian influence can be associated with an increased HIV prevalence. Moreover, we document the role played by sexual behaviors [see e.g., DellaVigna and La Ferrara (Reference DellaVigna and La Ferrara2015)].Footnote 12
The rest of the paper is organized as follows. Section 2 presents a brief historical background on missionary activity in sub-Saharan Africa, the early investments in modern medicine, and the focus of a number of religious groups on abstinence until marriage. Section 3 describes the new dataset we build for this paper and presents summary statistics. In section 4, we provide empirical evidence on the long-term impact of missionary activity on the likelihood of HIV, and disentangle the positive effect of health investments and the negative effect of the focus on abstinence. Section 5 presents a number of robustness checks. The endogenous selection of missions into health investments is extensively discussed. Section 6 investigates the channels that could explain the persistent effect of missionary presence, in particular missionary health investments, conversion, and the role played by family values, sexual behaviors and beliefs. Section 7 concludes.
2. Historical background
This section draws on the historical and medical literature on missions and on the origins of HIV to show that missionaries may have influenced HIV prevalence in the long run. Two links emerge. First, missions are tightly linked to the development of modern medicine in sub-Saharan Africa, which may have helped contain the epidemic through: (i) the investments themselves, as medical centers persisted [Doyle et al. (Reference Doyle, zu Selhausen and Weisdorf2018)] and medical campaigns aimed at diffusing information, family planning, screening, and distributing anti-retroviral may have helped contain the disease and (ii) the early treatment against other STDs that increase the risk of HIV contagion may have similarly done so. Second, missions, as they changed religious and cultural practices, may have affected HIV. Conversion to Christianity indeed disrupted family structures, in particular polygyny that is associated with lower HIV prevalence. Moreover, Christian institutions today, which are partly a missionary legacy, have faced difficulties campaigning to contain the disease in an effective way.
2.1 The missionary roots of modern medical provision in sub-Saharan Africa
The history of modern medicine in sub-Saharan Africa is closely linked to the development of missionary activity. Missionaries were among the first to provide modern health care until the middle of the 20th century [Vaughan (Reference Vaughan1991, Ch. 3)]. Missionary work was often conducted by doctors or nurses. David Livingstone—probably the best-known figure in the history of African missionaries—was a doctor himself. Although Livingstone's project was the promotion of trade with local populations as means to improve development and end the slave trade, he emphasized the crucial role of health and education because “neither civilization nor Christianity can be promoted alone. In fact, they are inseparable.” “Civilization,” roughly understood as the advancement of economic prosperity and Western values of which Western medicine was an essential part, was thus considered a central element of the evangelical mission from an early period.
From the end of the 19th century to the early 20th century, there was a rapid increase in medical work among missionaries. The Edinburgh Medical Missionary Association was founded in 1841. In 1891, the Church Mission Society established a new “Medical Committee” that was specifically in charge of managing the medical work of the society. Medical missionaries had a central role in the provision of health care through the construction of hospitals, dispensaries, the provision of midwifery services, the treatment of leprosy, vaccination campaigns, and the training of lay health workers. Although the colonial methods employed, such as the segregation of lepers in asylums, are now questioned, the case remains that an important part of the provision of health care was initiated by missionaries. Moreover, secular investments in health partly relied on the Christian missionary networks. For a more detailed history, refer to Vaughan (Reference Vaughan1991, Ch. 5).
The early Christian provision of health care thus persisted after colonization and has been particularly influential in the design of contemporary health care in low-income countries [Idler (Reference Idler2014)]. In 1968, for instance, the World Council of Churches established the Christian Medical Commission (CMC), institutionalizing the long-lasting tradition of Christian medical and healing work around the world.Footnote 13 In 2001, the World Christian Encyclopedia inventoried 37 different Christian societies working on the provision of health care in sub-Saharan Africa (unfortunately, more detailed statistics are not reported). The Christian Medical Fellowship (CMF), a modern medical Christian society, also illustrates the extent of the Christian influence in contemporary medical provision. It inventories on its website 64 Christian partner hospitals,Footnote 14 many of them with satellite institutions and mobile clinics. In countries such as Malawi or Rwanda, the CMF's partner institutions alone account for up to 9% of the country's total hospital beds.
2.2 The Christian roots of modern health provision
Missionaries' central objective was to convert the local population to the Christian faith, and to some extent, missionary medicine was considered by some as instrumental toward this goal. The notion of healing the body and soul is indeed deeply rooted in the Christian dogma. For instance, the Gospel of Matthew 10:1 reads: “Jesus called his twelve disciples to him and gave them authority to drive out impure spirits and to heal every disease and sickness.” Medical work—a form of “healing authority”—was “part of a programme of social and moral engineering through which Africa would be saved” [Hardiman (Reference Hardiman2006)]. The following excerpt from Vaughan (Reference Vaughan1991, p. 72), narrating an encounter between a missionary doctor and a traditional healer, is also illustrative of how medical missionary work was sometimes conceived as embedded in the evangelization work, rather than as an independent scientific activity.
“I asked him [the traditional healer] if he had any medicine that would make a man live forever. He fumbled in his basket, (…) he showed me some earth, scraped from the surface of a cliff on a river bank, and told me that it should be mixed with castor oil and used for anointing the body, so that the body may prosper. ‘But even so’, he added pathetically, ‘we still die’. I told him that WE HAVE the Medicine for immortality (…) and it was to be had in Church.”
Therefore, when studying the legacy of missionary activity on health outcomes, we need to bear in mind that missionary medicine was a part of a larger conversion enterprise. The history of the early colonial and missionary campaigns targeting STDs illustrates the tension between the Christian and the scientific response to these diseases. In Uganda, there was a large increase in the prevalence of syphilis from the mid-19th century, which led to the first public health campaigns launched in sub-Saharan Africa by the colonial powers [Setel (Reference Setel1999, p. 99)].Footnote 15 The priority of the campaigns was not the treatment of patients or the diffusion of scientifically accurate information, but the fight against what colonial authorities considered to be the innate sinfulness of the African society [Vaughan (Reference Vaughan1991)]. This moral combat was in turn supposed to eradicate the “disease of immorality,” the term used by missionary doctor Albert Cook to refer to syphilis in Uganda [Vaughan (Reference Vaughan1991, p. 138)]. The interventions by colonial powers, missionaries, and local authorities to fight the crisis took different forms, but they always implied the necessity to change sexual behaviors by incentivizing monogamous marriages at a younger age. Missionaries campaigned for the recognition of customary law marriages in 1918, capping the levels of required bride wealth, banning divorce for reasons other than adultery, and imposing restriction on women's mobility [Doyle (Reference Doyle2013)].
However, the prioritizing of morality over medical responses cannot be generalized to all missionaries. A revealing example can be found in the archives of the Society for the Propagation of the Gospel (SPG).Footnote 16 Around 1907, as a response to the SPG's inquiry on the needs of their missionaries in the field, Reverend Lattimer Fuller, a missionary doctor in South Africa, replied with a letter that reads rather like a public health report than a moralizing pamphlet. Without references to a moralizing enterprise, he simply emphasizes the need for dispensaries (“cottage hospitals”) and funds to train personnel, to contain a growing epidemic of syphilisFootnote 17:
“The usual medical estimate of the health of the million Natives in this diocese is that seventy five percent of them suffer more or less from syphilis, and not less than twenty five percent from incipient or advanced phthisis. (…) At this stage [the phthisis] can be easily and successfully treated, only there is no one to treat it. (…) Nothing would be really of much use in such densely populated a district [Johannesburg] except something in the way of a cottage hospital where two or three native girls would be trained to look after the sick.”
The role of medical missions in the development of Western medicine in sub-Saharan Africa, beyond its instrumental value for conversion, is also emphasized in the historical work on Protestant and Catholic medical missions. For instance, Good (Reference Good1991) writes: “The idea that medical care for Africans should be subordinate to the goal of spiritual salvation—especially strong among Protestant missions—gradually tempered to accommodate the practical view that the treatment of disease, relief of suffering, and training of Africans as medical auxiliaries constituted worthy ideals of Christian service in their own right.”
Medical missionaries, in fact, were extremely active in the diagnosis and treatment of many conditions, in particular STDs. Exploring the specific case of the Uganda mission-hospital, Doyle et al. (Reference Doyle, zu Selhausen and Weisdorf2018) present the continuous efforts to diagnose and treat syphilis and other related STDs both for Christians and non-Christians, throughout the colonial period and after independence, when the missionary hospital was nationalized. The missionary doctors' efforts in the containment of STDs are likely to have mattered, as STD-related genital ulcers have been shown to be catalyzers of the early spread of the HIV epidemic [de Sousa et al. (Reference de Sousa, Müller, Lemey and Vandamme2010)].
Today, medical missionaries continue to have an active role in the HIV-prevention campaigns, even when the messages diffused conflict with Christian dogmas. For instance, in 2009, the United Church of Christ HIV Ministry Network released a statement recommending that houses of worship and faith-based education institutions distribute condoms and provide comprehensive sexual education. Other HIV-relief programs also run by faith-based organizations are less clear on the importance of distributing condoms.Footnote 18 In this paper, we capture this heterogeneity by comparing the effect of missions that specialized in health provision to those that did not. We show indeed those only regions around missions that invested in health exhibit lower HIV prevalence today.
2.3 Missions, Christianity, and HIV
The history of African Christianity, and the way it shaped the HIV epidemic from its very roots, goes beyond the historical and persistent provision of public health. In this section, we show that there is both historical and contemporary evidence suggesting that early exposure to Christianity could have affected HIV prevalence. This evidence provides grounds for our investigation into the long-term consequences of missionary presence on HIV.
Recent research at the intersection between history and biology has shown that the origins of HIV in Africa can be traced back to the first half of the 20th century. The evolution of HIV from a successful cross-species contagion of SIV (Simian Immunodeficiency Virus, the “version” of HIV that contaminates monkeys) into a large-scale human epidemic is tightly linked to colonial history, and the way it brought up a large-scale rapid cultural and urban transformation. The 1920s are the estimated timing of the group-0 cross-species transmission between apes and humans [Hemelaar (Reference Hemelaar2012)]. The disease likely diffused after one or several incidents of cross-species contamination, around the Congo-river basin in the 1930s and 1940s. A single diffusion cause is impossible to identify, but it is believed that the contagion was made possible as a result of colonial transformations, which changed local demographic structures, consolidated a commercial sex work industry, and facilitated the spread of diseases through poorly organized health campaigns that heavily relied on injectable medicines [Pépin (Reference Pépin2011), Lowes and Montero (Reference Lowes and Montero2017b)].
Large scale public infrastructure projects, such as the Congo-Océan railway project (1921–1932), and rapid urbanization, consolidated population centers with skewed sex ratios. In these population centers, the commercial sex work sector grew rapidly. Sex workers were highly prone to STDs leading to genital ulcers, which in turn highly increase the contagion risk of HIV [de Sousa et al. (Reference de Sousa, Müller, Lemey and Vandamme2010)]. These centers were also frequently exposed to public health campaigns where frequent use of unsterilized needles facilitated iatrogenic diffusion.
By diffusing a religion that promoted changes in sexual behaviors and family structures, missionaries may have affected HIV since its very origins. Pépin (Reference Pépin2011, p. 98), for instance, gives a glimpse on how missionaries, who actively discouraged polygamy and tried promoting monogamous marriages, may have contributed to the spread of the disease:
“By a strange paradox, the work of (…) missionaries led to unexpected outcomes. (…) missionaries pushed hard for the emancipation of women and the abolition of polygamy, directly and through the colonial authorities, while nuns developed activities aimed at improving the status of women. (…) No longer forced to have sexual relations with a man selected by their kin, some women opted for something that was easier to attain than the proposed idealistic monogamous union based on love and the Ten Commandments: the trade of sexual services.”
It is not necessary to go as far as spanning a causality chain from Christianity to the sex industry to understand that conversion to Christianity may have affected HIV prevalence. For instance, missionaries devoted substantial efforts into diminishing polygyny, a marriage structure that today is associated with lower HIV prevalence, because it creates “small isolates of concurrent partnerships in which the virus is trapped” [Reniers and Watkins (Reference Reniers and Watkins2010)]. This network is less likely to spread HIV than one where both men and women have multiple and changing partners.Footnote 19
Today, the focus of campaigns against HIV is often on teaching the ABC approach: “Abstain, Be Faithful, Condomize.” But while religious groups have been open to teaching this message, there is qualitative evidence that the “Condomize” section is often ignored. Many churches—in particular Pentecostal churches—indeed consider the use of condoms to be a sin [Mash and Mash (Reference Mash and Mash2013)]. Religious groups are also heavily involved in the design of sex-education curricula delivered in many public schools. According to Duflo et al. (Reference Duflo, Dupas and Kremer2015), in Kenya as well as in many other sub-Saharan African countries, the resulting curriculum teaches the biology of AIDS and HIV transmission, how to care for people living with AIDS, and prevention. The prevention component stresses abstinence before marriage, followed by marital faithfulness as the most effective ways to prevent STDs. The official textbook does not mention condoms or contraception.Footnote 20
Yet, it has been shown in the literature that HIV curricula stressing abstinence before marriage do not reduce risky sexual behaviors, whereas those that do explain the use of condoms are effective in the reduction of STDs [Dupas (Reference Dupas2011), Duflo et al. (Reference Duflo, Dupas and Kremer2015), Dupas et al. (Reference Dupas, Huillery and Seban2018)].
3. Data and missionary locations
3.1 Historical data
Different sources were used to construct the dataset of missions and historical controls. We describe them in turns in this section.
3.1.1 Protestant missionary investments
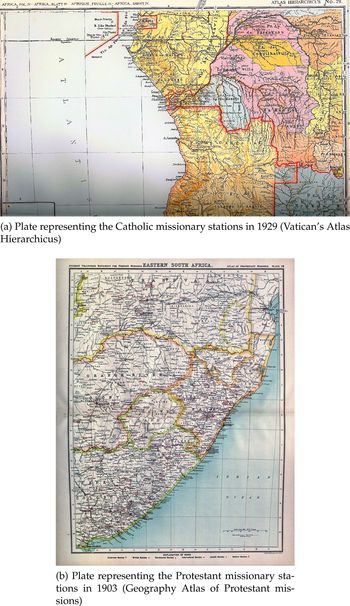
Regarding Protestant missions, we originally compiled the data of missionary investments and their locations in a previous paper [Cagé and Rueda (Reference Cagé and Rueda2016)]. We constructed the mission-level data and geocoded the maps of sub-Saharan African regions from the Geography and Atlas of Christian Missions [Beach (Reference Beach1903)]. The maps locate all the Protestant mission stations in 1903 (an example of these maps is provided in Figure 2b).
Plates representing all (Catholic and Protestant) missionary stations. Note: The figure reproduces a plate locating Catholic missionary stations (top) and a plate locating Protestant missionary stations (bottom).

As opposed to other available geographic datasets of Protestant missions [Akyeampong et al. (Reference Akyeampong, Bates, Nunn and Robinson2014, Ch. 16)], the one generated for this paper contains detailed information for each mission settlement. In the Geography and Atlas of Christian Missions, each mission station is uniquely identified in a statistical appendix, which provides information on the mission's size (number of students, of missionaries, etc.) and a detailed record of its activities and investments. For example, we know whether each mission had a printing press, a school, or a health facility. The exhaustive list of variables and a reproduction of one page of the statistical index are provided in the online Appendix to Cagé and Rueda (Reference Cagé and Rueda2016). Our sample of sub-Saharan African missions includes a total of 723 Protestant missions out of which 99 had a dispensary, and 61 had a hospital or a declared doctor.
3.1.2 Catholic missionary investments
This paper complements the data from Cagé and Rueda (Reference Cagé and Rueda2016) with new information on Catholic missionary activity. We exploit the information from the 1929 Atlas Hierarchicus, which is the official publication of the Vatican (the Fide service) that inventories Catholic activities worldwide and locates all the Catholic missionary stations in the world on a series of maps [Streit (Reference Streit1929)].Footnote 21 An example of these maps is provided in Figure 2a. The Atlas also gives some statistical information about the investments at the mission level, although it is less detailed than the Protestants' Geography and Atlas of Christian Missions. Notwithstanding this limitation, it does report the location of missionary hospitals; which is enough for the scope of our study.
Our sample of sub-Saharan African missions includes a total of 536 Catholic missions out of which 36 had a hospital.
3.1.3 Determinants of missionary location and investments
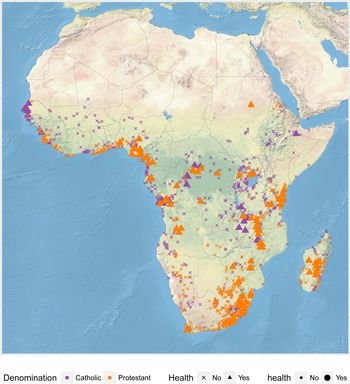
Figure 3 reports the historical location of both the Catholic and Protestant missions as well as their health investments. To the extent of our knowledge, we are the very first to produce such a dataset. Overall, we provide information for a total of 1,259 missions.
Catholic and Protestant mission stations with and without health investments. Note: This map is a digitized and geocoded version of two geography atlas. For Protestant missions, we used digitized and geocoded plates 14 to 18 of Dennis, Beach, and Fahs (1903), from Cagé and Rueda (Reference Cagé and Rueda2016). Health investments include dispensaries and hospitals. For Catholic missions, the map is a digitized and geocoded version of the 1929 Atlas Hierarchicus. The geocoding was conducted by the authors. Health investments include hospitals.

We rely on the aforementioned atlases to construct our data because they are, to the best of our knowledge, the only systematic records of missions and their investments for the entire continent. However, recent research focused on Ghana has shown that this sample is more likely to capture the earlier and better endowed European missions than the later missions led by Africans, which settled in less favored regions, further from the coast, and more suitable to malaria [Jedwab et al. (Reference Jedwab, zu Selhausen and Moradi2018)]. Although it is difficult to extrapolate from the unique case of Ghana, we acknowledge that our approach captures the effect of the European missionary expansion. Nonetheless, we want to highlight that our within-mission approach restricts the analysis to regions that are close to these European settlements and thus locally comparable. In light of Jedwab et al. (Reference Jedwab, zu Selhausen and Moradi2018), a question that arises is whether our effects are mostly channeled through the later expanding network of local missions. This could be the subject of further research that would suppose the collection of more extensive data, in particular with a larger geographical reach. It is, however, beyond the scope of this paper.
According to this existing literature, European missionaries were disproportionately more likely to locate in geographically favored areas [Johnson (Reference Johnson1967), Nunn (Reference Nunn2010), Akyeampong et al. (Reference Akyeampong, Bates, Nunn and Robinson2014), Cagé and Rueda (Reference Cagé and Rueda2016), Jedwab et al. (Reference Jedwab, zu Selhausen and Moradi2018)]. In the online Appendix summary statistics Table C.3, we perform a t-test on the equality of means for geographic and historical characteristics of towns located near (less than 100 km) and far (more than 100 km) from the historical mission settlements in our sample. The results confirm that missionary locations are more geographically favored regions with higher precolonial and subsequent population densities.
Due to potential selection in missionary location, our specifications always control for all the geographic and historical characteristics that may have influenced location choice, such as the malaria ecology, proximity to the coast, suitability for rainfed crops, suitability to Tse-Tse fly, and proximity to historical rail lines and explorer routes. More importantly, following Cagé and Rueda (Reference Cagé and Rueda2016) our results on the effects of health investments are carried “within missions,” that is to say that we compare within our sample, missions that invested in health with missions that did not.Footnote 22
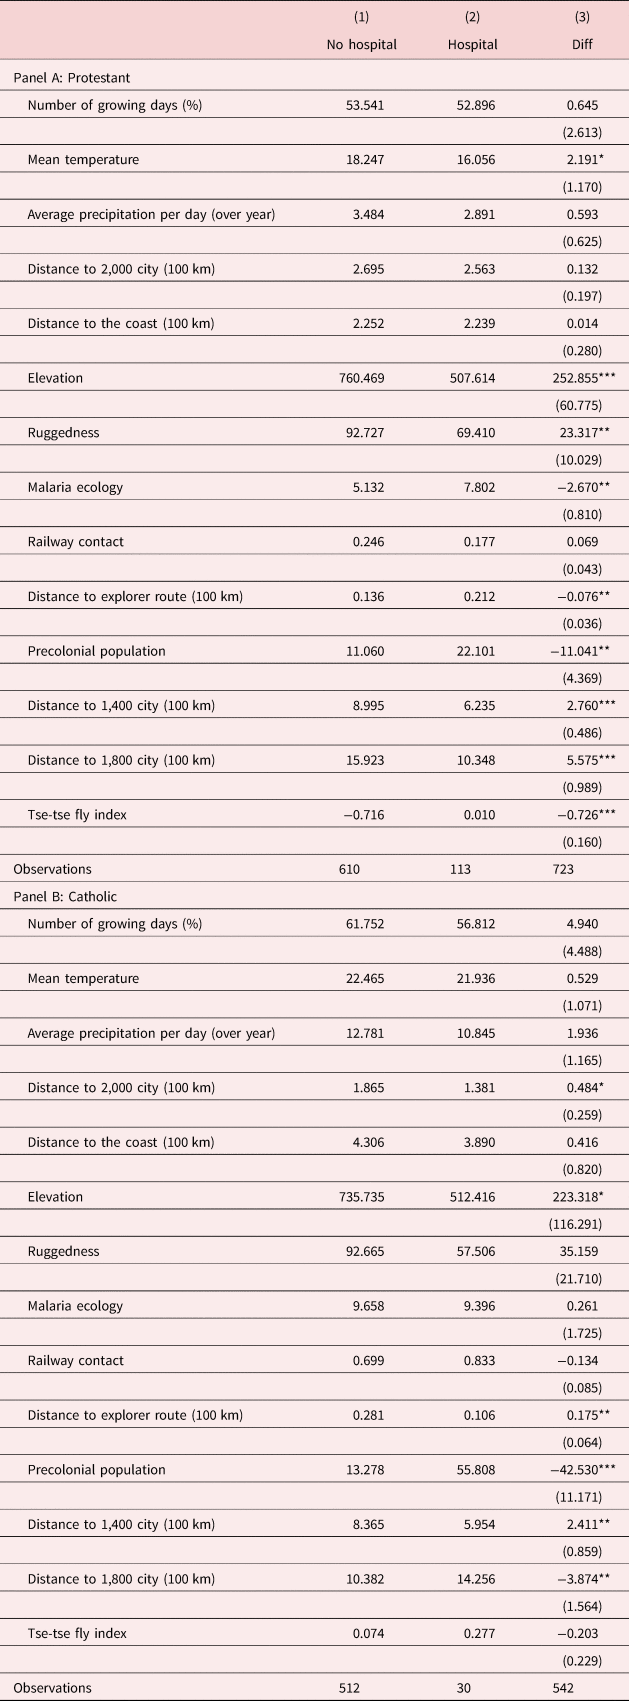
Moreover, as we compare missions depending on whether they invested in health, a second concern would be that of endogenous selection into health investments. Table 1 compares the geographic and historical characteristics of missions that did invest in health with those that did not. Protestants and Catholics are analyzed separately. Although the difference for most geographic indicators is not statistically significant, we observe that missions that invested in health facilities were, on average, located in regions that were slightly cooler, closer to the coast (not statistically significant), with lower elevation. The most important difference is pre-colonial population density, which is (at least) twice is high around missions with health facilities. The patterns observed suggest that missions with health investments were set up in more favorable areas, with larger population densities. We also know that urbanization is one of the most significant determinants of HIV prevalence [Fox (Reference Fox2010), Oster (Reference Oster2010), Pépin (Reference Pépin2011)]. In most sub-Saharan African countries, the ratio of HIV prevalence is more than twice as high in cities than in rural areas [UNAIDS (2015, Figure 5)]. In a country like Côte d'Ivoire, 23% of the national population lives in Abidjan, but the city accounts for 30% to 50% of the country's population infected with the disease [UNAIDS (2015)]. Therefore, if geographically confounding factors were driving our results, we would expect these locations to have larger, and not smaller HIV risk.
Determinants of the location of the health investments

Note: *p < 0.10, **p < 0.05, ***p < 0.01. The table compares the characteristics of the places where missions with and without a health investment did locate. Panel A presents the results for Protestant missions, and Panel B for Catholic missions. In both panels, column (1) presents the results for missions without a hospital. Column (2) presents the results for missions with a hospital. In column (3), we perform a t-test on the equality of means (robust standard errors are in parentheses). Variables are described in the online Appendix.
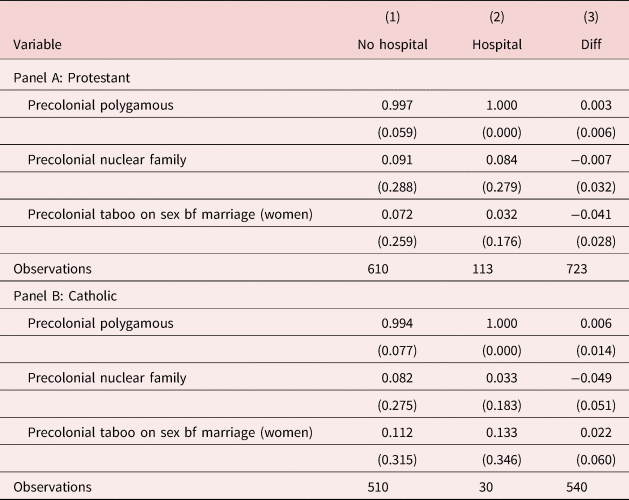
Finally, since pre-colonial characteristics also shaped colonial and post-colonial development outcomes [Michalopoulos and Papaioannou (Reference Michalopoulos and Papaioannou2013)], Table 2 compares pre-colonial marital structures of the missions with and without a health investment. The rationale for this comparison is that these structures shape sexual behaviors that can ultimately determine HIV patterns. We use data from the Ethnographic Atlas, and do not observe statistically significant differences in pre-colonial marriage patterns and sexual practices linked to the location of the health investments.
Determinants of the location of the health investments: precolonial marital structures

Note: *p < 0.10, **p < 0.05, ***p < 0.01. The table compares the characteristics of the places where missions with and without a health investment did locate. Panel A presents the results for Protestant missions, and Panel B for Catholic missions. In both panels, column (1) presents the results for missions without a hospital. Column (2) presents the results for missions with a hospital. In column (3), we perform a t-test on the equality of means (robust standard errors are in parentheses). The variables are from the Ethnographic Atlas.
3.1.4 Additional historical controls
We compute the distance to 1,400 and 1,800 cities using GIS and the information on the location of cities provided by Nunn and Wantchekon (Reference Nunn and Wantchekon2011). Information on explorer contact and railway contact is also from Nunn and Wantchekon (Reference Nunn and Wantchekon2011).
Furthermore, we control for the tsetse fly suitability index (TSI) developed by Alsan (Reference Alsan2015). The tsetse transmits a parasite harmful to humans and lethal to livestock, and has been shown to affect current economic performance [Alsan (Reference Alsan2015)]. The TSI is the standardized value of the steady-state tsetse population; a larger number indicates a climate more suitable to the fly.
Finally, we collect information on the location of the colonial hospitals. We compute this information from the British colonial statistical records. While we do not control for colonial hospitals in our preferred empirical specification, we use this information in section 6 when discussing the channels explaining persistence.
3.2 Contemporary data
Our analysis relies on the individual-level data from the DHS distributed by USAID. The DHS are standardized nationally representative surveys in developing countries. Women and men answer questions related to their anthropometrics, living conditions, health, sexual reproduction behaviors, and attitudes and beliefs regarding different health outcomes.
Since the 2000s, the DHS also collect biomarker data on STDs. Biomarkers are objective physical or biologic measures of health conditions. Using field-friendly technologies, the DHS surveyors can collect biomarker data on HIV.Footnote 23 Hence, our measure of HIV infection is based on actual HIV contamination information, not on self-reported surveys where the mean rates of HIV infection are likely to be severe underestimates.Footnote 24 The DHS data also provide information on anemia for women; just like for HIV, biomarker testing is used for anemia, making them comparable. We use anemia in section 5 to show that our result are specific to STDs (i.e., not driven by poorer health conditions in general).
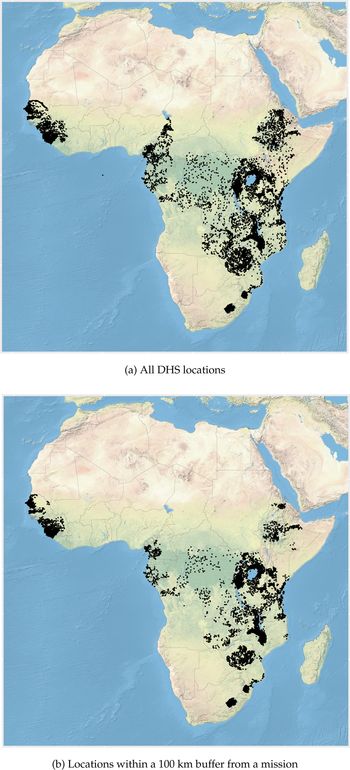
We use the DHS data for sub-Saharan African countries where we have at least one missionary hospital reported, and where both GPS information and biomarker data on HIV are provided. Figure 4a shows the locations of these clusters. There are a total of 344,212 individuals, distributed in 8,498 clusters distributed among 17 countries: Burkina Faso, Burundi, the Democratic Republic of Congo (DRC), Cameroon, Ethiopia, Gabon, Guinea, Kenya, Liberia, Lesotho, Malawi, Rwanda, Senegal, Swaziland, Uganda, Zambia, and Zimbabwe. The information is collected in several rounds, from 2003 to 2014. The surveys are not systematically carried out for all countries every year, so each country appears 1–3 times in the sample.Footnote 25
DHS locations. Note: The figure shows the location of DHS clusters in sub-Saharan Africa that report both HIV biomarker data and GPS information.

The DHS now also releases geospatial covariates for all the clusters for which it provides GPS coordinates. We rely on these data to obtain geocovariates that are standard in the literature. For each location, we observe land characteristics (drought episodes, aridity, rainfall, temperature, malaria ecology, etc.), average night-time luminosity, and proximity to water sources, among others. Importantly, this source gives information on the average travel time to a major urban center. This variable captures urbanization and also connectedness to the infrastructure network, which is of particular interest to us, as Oster (Reference Oster2010) shows that road density is an important determinant of HIV prevalence.
4. Empirical analysis
In this section, we document the relationship between missionary activity and HIV prevalence.
4.1 Specification
To examine the correlation between proximity to missions (with and without health investments) and HIV/AIDS prevalence, we estimate the following equation:

where y irct is a binary variable equal to one if the respondent i is tested positive for HIV, in the DHS cluster r, in country c, and year t, and to zero otherwise. In the remainder of the paper, the DHS clusters are referred to as “towns.” ${\bf Dis}_r$ is a vector of distances. It includes the explanatory variables of interest: the logarithm of the distance between town r and the closest historical mission settlement, and the logarithm of the distance between town r and the closest mission with a health investment (a hospital or a dispensary). Online Appendix Table C.1 presents summary statistics on these distances.
The vector ${\bf X}_{irt}$ contains individual level controls that are not “bad controls” in the sense of Angrist and Pischke (Reference Angrist and Pischke2009): sex, age, age square, and marriage status. Our results are robust for introducing a larger set of controls (accounting for education level status or wealth indicators, see section 4.2). ${\bf W}_r$
 contains geographical and historical-level controls for town r in country c. The geographical controls are distance to the capital city; distance to the coast; the average malaria ecology of the land; the slope of the terrain; the elevation; temperature per month, rainfall per month, aridity, and the length of the growing season in days (these are all from the DHS geocovariates set). We also include the Tse-Tse fly suitability index [Alsan (Reference Alsan2015)]. The historical controls are the distances to cities in 1,400 and 1,800; and distance to colonial railways and to initial explorer routes [Nunn (Reference Nunn2008)]. Because they are potential “bad controls,” our baseline specification does not include urbanization proxies, in particular, the average travel time to an urban center that captures both urbanization and connectedness into the transport infrastructure. However, our results are robust to including these controls, and also to restricting the analysis to the most connected areas (see section 5).
Finally, ζ and θ are year and country fixed effects. Unless otherwise stated, all the regressions' standard errors are clustered at the town level, and all the regressions restrict the analysis to towns that lie within a 100 km buffer from a historical missionary settlement (depending on the specification, this is any settlement, a Protestant settlement, or a Catholic settlement).
4.2 Results
4.2.1 Baseline specification
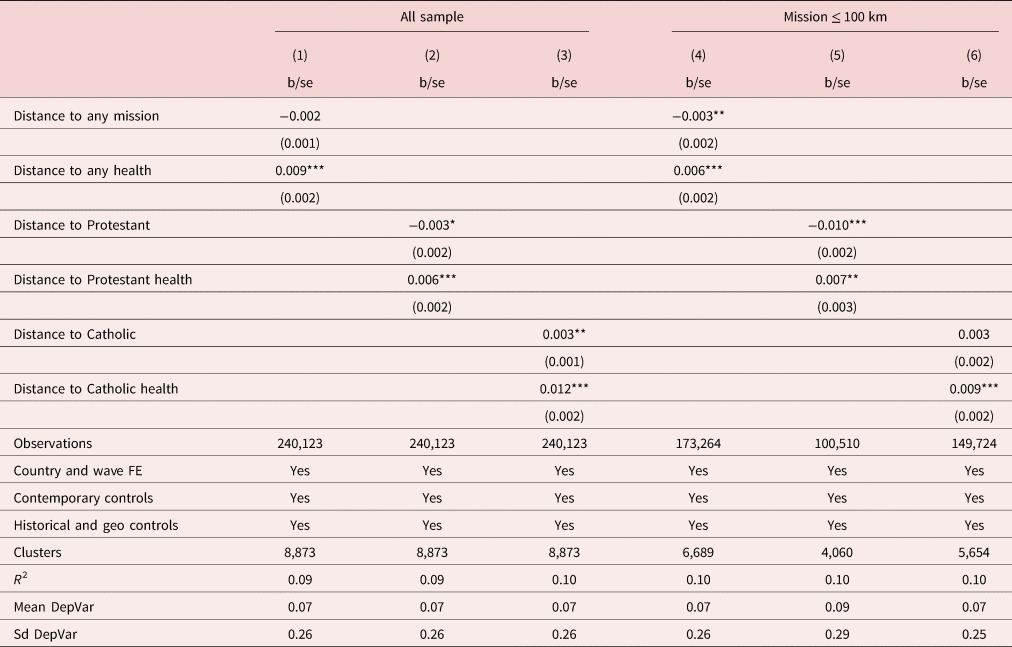
Long-term effects of mission stations. Table 3 shows that proximity to a mission station tends to increase the chances of an HIV-positive test, a result that is driven by Protestant missions. This result holds when we restrict the analysis to towns located within a 100 km buffer of any mission [column (4)], a Protestant mission [column (5)], or a Catholic mission [column (6)]. To address selection in missionary locations, these restrictions are applied to the rest of the regressions in the paper, and we refer to these locations as “towns close to missions.”
Missionary investments and HIV prevalence: baseline specification

Note: *p < 0.10, **p < 0.05, ***p < 0.01. The table reports OLS estimates. The unit of observation is the individual. The dependent variable is a binary variable equal to one if the respondent is HIV positive. Standard errors in parentheses are clustered at the town level. Controls are described in the text.
The results suggest that a 10% increase in distance to any mission is associated with a 0.003 unit lower probability of an HIV-positive result [column (4)]. Ceteris paribus, at the median distance to a mission, a 15 km increase in distance decreases the average probability of HIV positivity by approximately 5%. Online Appendix Table C.5 reports beta coefficients. It shows that a one-standard deviation increase in the logarithm of the distance to a mission decreases the probability of being tested positive for HIV by 1% to 5% of a standard deviation, and that this effect is driven by Protestant missions. Table C.6 in the online Appendix reports the results from the same regression when adding potential “bad controls” such as education level (none, primary, or high school) and binary indicators of the respondent's wealth percentile as given by the DHS. The estimates of interest remain unchanged.
Given the large body of literature on the positive legacy of missionary exposure on development [Gallego and Woodberry (Reference Gallego and Woodberry2010), Nunn (Reference Nunn2010), Woodberry (Reference Woodberry2012), Acemoglu et al. (Reference Acemoglu, Gallego and Robinson2014), Cagé and Rueda (Reference Cagé and Rueda2016), Calvi and Mantovanelli (Reference Calvi and Mantovanelli2018), Valencia-Caicedo (Reference Valencia-Caicedo2018) among others], we think that this result, highlighting potential negative correlation with development, is worth investigating. We acknowledge the potential endogeneity issues, especially urbanization. In section 6, we find that the results hold also for the most urbanized areas, and explores missions' cultural legacy—Christianity—as a channel to be considered. Furthermore, section 2 details how the historical evidence supports this hypothesis.
Long-term effects of health investments. Table 3 shows that being close to historical health investments is associated with lower HIV positivity, whether we consider all missions taken together, or Protestant and Catholic missions separately [columns (1)–(3)].
Regarding the magnitude of the effects, a 10% increase in the distance to a mission with a health investment is associated with a 0.0005-unit increase in the probability of HIV positivity [column (4)]. This positive effect holds both for Protestant [column (5), 0.0007-unit increase] and for Catholic missions [column (6), 0.0009-unit increase]. This result suggests that, ceteris paribus, at the median distance to a mission that invested in health, a 15 km increase in distance to the health investment increases the average probability of HIV by approximately $0.7\%$ to $1.2\%$
 .
From the results in Table 3, it follows that a one-standard deviation increase in the log-distance to a health investment increases the probability of being tested positive for HIV by 2% to 5% of a standard deviation. Hence the effect is not only statistically but also economically significant.
Table C.4 in the online Appendix shows that these results are robust to using logit regressions. The subsequent analysis in this section addresses endogeneity threats to the results, proposes solutions to them and discusses the likelihood that all of the results are driven by unobservables.
4.2.2 Health investments and HIV: identification threats and solutions
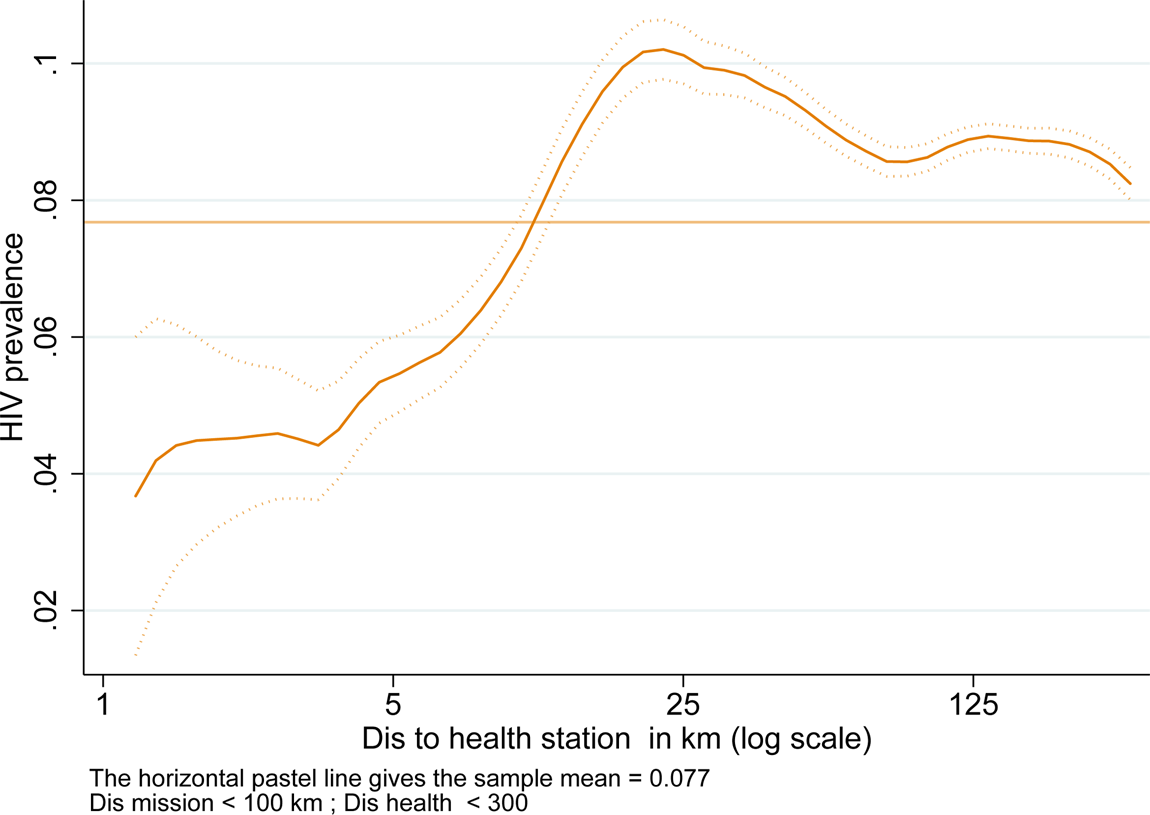
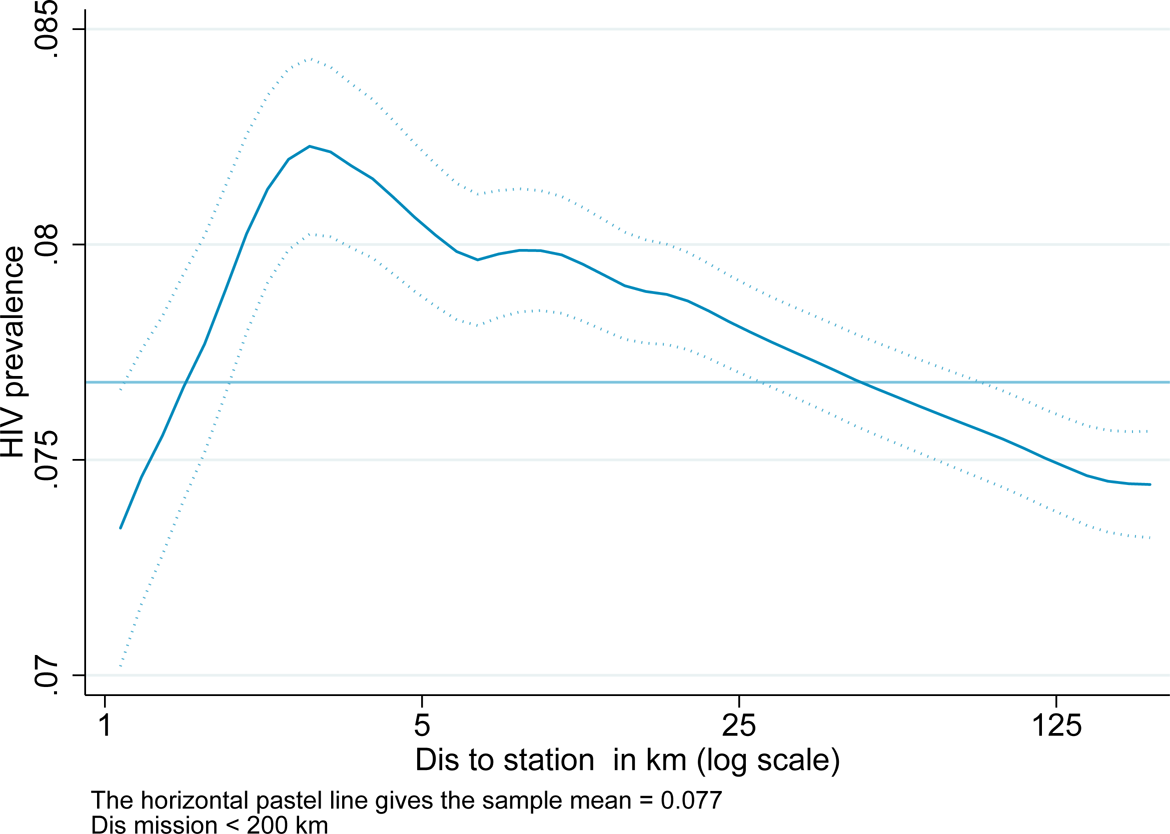
Non-parametric effect of distance. Figure 5 shows a local polynomial smoothing of individual HIV test results as a function of the log of distance to a health facility. The figure is consistent with the hypothesis of a positive linear relationship between HIV prevalence and the log-distance of the health investment. HIV tends to be smaller on average in regions close to health stations, up to approximately 10 km to 15 km, which is a walking distance to a health station.
Effect of distance to a missionary station with a health investment on HIV. Local polynomial regression.

Figure 6 shows a local polynomial smoothing of individual HIV test results as a function of the log of distance to a mission. The figure is consistent with the hypothesis of a negative relationship between HIV prevalence and the log-distance of missions, for distance ranges starting from approximately 2 km. HIV tends to be larger on average in regions close to missions, up to approximately 25 km.
Effect of distance to a missionary station on HIV. Local polynomial regression.

Endogenous location of missionary investments: matching strategy. In order to overcome the challenge of the endogenous location of missions, we use a “within-missions approach”: the sample is restricted to regions close to missions. However, it remains possible that our results might be driven by selection of missions into health investments. As Table 1 shows, there are indeed systematic differences between missions with and without health facilities. Missions with health facilities, both Protestant and Catholic, tend to be located in regions that show higher levels of historical development. In particular, these places have higher pre-colonial population density, are located closer to urban centers, and are in places with lower altitude. Notice that such differences should predict higher and not lower prevalence rates around those health investments, as HIV is mainly a disease of urban areas [Oster (Reference Oster2010), Fox (Reference Fox2010), Pépin (Reference Pépin2011)].
Following Cagé and Rueda (Reference Cagé and Rueda2016), we develop a matching strategy to tackle the possibility of an endogenous selection of missions into health investments. At the mission-level, we regress a binary variable indicating whether missions are endowed with a health investment on all the observable geographic and historical characteristics available at the mission level (these observables correspond the variables reported in Table 1). Given the nature of our sources, we have much more information for Protestant than for Catholic missions. Therefore, the matching is conducted separately for each of these samples. From this regression we compute the propensity score, which is the estimated probability of a mission station having a health investment. We then match each mission with a health investment to the mission with the closest propensity score using a one-to-one matching. The sample of missions with a health investment is called H. The sample of missions that are selected in the one-to-one matching strategy but that do not have a health investment is called $\bar{H}$ .
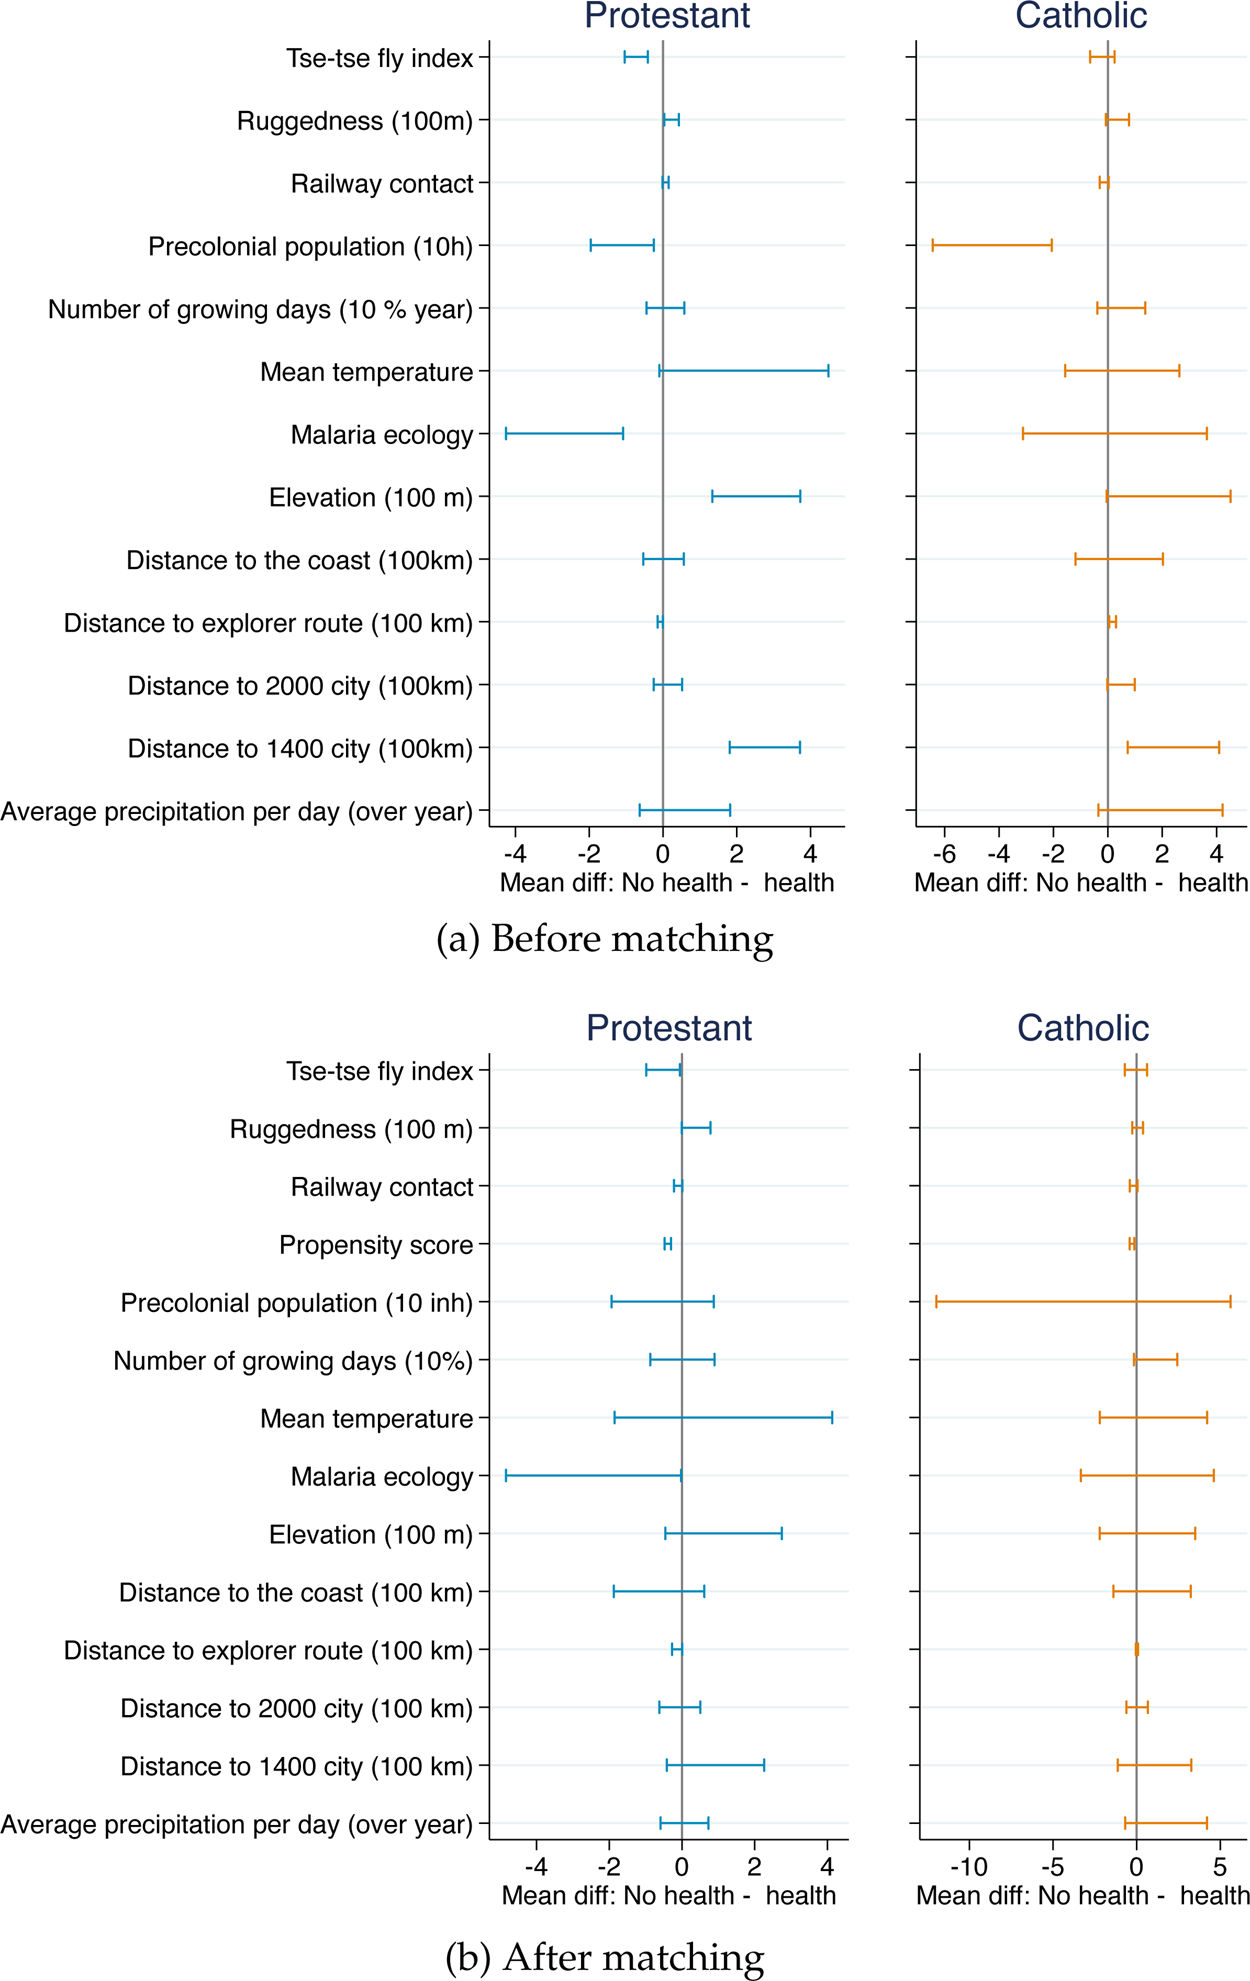
Tables C.7 and C.8 in the online Appendix report the results of the logit regression generating the sample $\{ \bar{H}\cup H{\rm \}} _r$ . The pre and post-matching statistics are graphically summarized in Figure 7, and reported in the online Appendix Tables C.9 and C.10. Reassuringly, there is no statistically significant difference in observables between the two groups. The standard errors in the post-matching statistics are larger because the number of observations drops from all the sample of missions in the pre-matching case, to those in H or $\bar{H}$
 in the post-matching case. Online Appendix Figure B.4 compares the densities of the propensity score before and after matching. After matching, the two distributions have a common support and are more comparable.
Summary statistics. Comparing missions with health facilities and those without before and after matching. Note: The figure reports the confidence intervals of the difference in means between the sample of missions without a health facility and those with one (control group − treatment group).

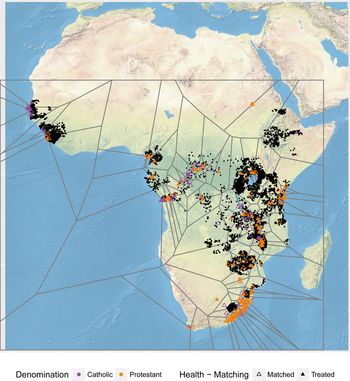
A map of all the missions in the sample $\{ \bar{H}\cup H{\rm \}}$ as well as all the DHS locations is shown in Figure 8. The polygons overlaying the map represent the Thiessen polygons generated by the points $\{ \bar{H}\cup H{\rm \}}$
 . For each element H in $\{ \bar{H}\cup H{\rm \}}$
 , the Thiessen polygon associated to H is the geometry such that for all the points in this geometry, the closest element in $\{ \bar{H}\cup H{\rm \}}$
 is H. These polygons can help us define regions that are “treated” by health facilities and those that are not, depending on whether H belongs to H or to $\bar{H}$
 .
Map of treated and matched missions.

In order to conduct our analysis with the DHS data, each DHS town is then associated to the closest mission in the sample $\{ \bar{H}\cup H{\rm \}}$ . We then construct the following variables:
• “Distance to health or similarr”: the distance from town r to the closest mission station in the sample $\{ \bar{H}\cup H{\rm \}}$
 .
• “Treat Healthr”: a binary variable equal to one if town r is treated by a health investment (i.e., the closest mission in the sample $\{ \bar{H}\cup H{\rm \}} _r$
that actually has a health facility, meaning that it belongs to H). This term captures the treatment effect of being close to a mission with a health investment, compared to the control group, which are similar missions that did not invest in health care.• “Interactionr”: is the interaction term Distance to health or similarr × Treat health


Equation (2) describes the identification:

where the vectors of controls ${\bf {X}^{\prime}}_{irt}^{}$ and ${\bf W}_r$
 are the same as before, and y irt is a binary variable equal to one if the respondent is HIV positive, and to zero otherwise. This specification aims to disentangle the effect of proximity to a health investment from the effect of proximity to any mission with characteristics similar to those that provided health services.
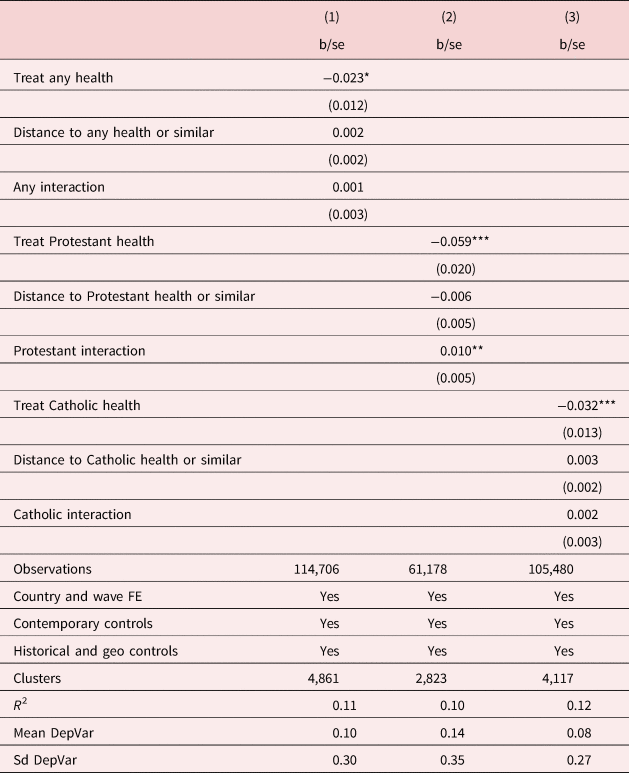
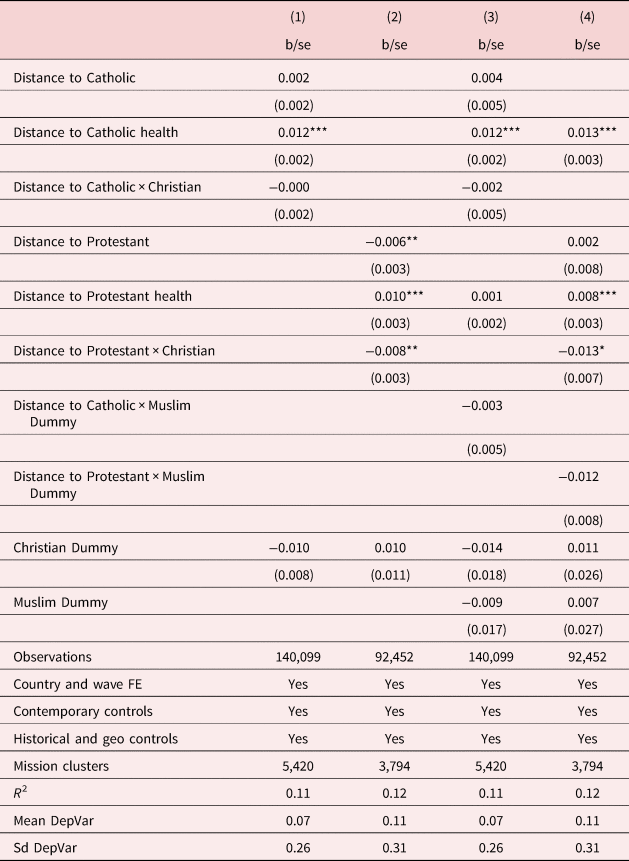
Table 4 presents the results. First, the estimate $\hat{\lambda} _1$ is never statistically significant across the three specifications. This finding reinforces the interpretation of our results in 3 as driven by health investments rather than other historical, geographical, or mission-level characteristics. The treatment effect is negative and statistically significant in the three cases. This means that within regions close to missions, people living in towns close to a mission with health infrastructure, are associated with a 2.3 to 5.9 percentage points lower probability of being tested positive for HIV, compared to towns that are close to a mission with similar observable characteristics but without an investment in health. The interaction term is positive for both Catholics and Protestants, but only statistically significant and with large magnitude for Protestants.
Missionary investments and HIV prevalence: matching

Note: *p < 0.10, **p < 0.05, ***p < 0.01. The unit of observation is the individual. The dependent variable is a binary variable equal to one if the respondent is HIV positive, and zero otherwise. Standard errors in parentheses are clustered at the town level. All regressions restrict the analysis to regions at least 100 km close to missions. Controls are described in the text.
4.2.3 Selection on unobservables compared to selection on observables
Using the insights from Oster (Reference Oster2016), we check the likelihood that our results are driven by the bias due to unobservables. This method, which we implement using her Stata module psacalc, assesses how large the bias due to unobservables should be, compared to that on observables in order to explain away the results. This ratio is called δ. Using the R-max value of 0.13 (30% higher than our estimated R 2), we find that selection in unobservables would need to represent 50% to 150% of selection in observables to explain away the results. When adding country and year fixed effects as unrelated controls, the estimated δ is always larger than one. The results are reported in Appendix Table C.11.
5. Robustness checks
Our previous section shows that within regions close to missions, proximity to a mission that invested in health is associated with a decrease in the probability of being tested positive for HIV. Similarly, we find that proximity to a Protestant mission in general (without any distinction on the type of investments conducted) is associated with higher probability of being tested positive for HIV. Our interpretation of these results is that Christian missions, through their cultural and medical legacy had an influence on the epidemic nowadays. Although we acknowledge that other factors can be at play, this paper aims at showing that the cultural and medical legacy mattered for understanding the long-term correlations that we have uncovered.
This section tests the robustness of our results to alternative explanations. Section 6 will discuss the channels of persistence with more details.
5.1 Consent to test
Our estimates rely on the availability of HIV test results. One potential issue is that regions with higher mistrust in medicine will have fewer individuals consenting to HIV tests, thus lowering the HIV-positive results. Given the persistence of mistrust in medicine in regions where colonial medical campaigns were established [Lowes and Montero (Reference Lowes and Montero2017b)], lack of consent in regions close to missions could pose a potential threat to the estimation. Table C.12 in the online Appendix shows that proximity to a missionary station with a health investment is neither a strong nor a statistically significant predictor of consent to HIV testing. If anything, we observe that proximity to a hospital increases the consent to test, but this result collapses and loses statistical significance when decomposing the analysis separately for Protestant and Catholic missions.
5.2 Precolonial marriage patterns
Traditional marriage patterns matter in the understanding of the HIV epidemic. In particular, the literature has shown that polygamy is associated with a decrease in HIV prevalence, as it tends to “shrink the sex networks” compared to sequential monogamous relationships or non-faithful monogamous relationships (the last are common in our sample) [Reniers and Watkins (Reference Reniers and Watkins2010)]. It would be problematic if we found that there were different pre-colonial marriage patterns in regions close to the missions of interest. First, we can remark that most of the sample in the Ethnographic Atlas reports some form of polygamy [Murdock (Reference Murdock1967)]. Second, Table 2 shows that the Ethnographic Atlas' groups closest to each mission report no statistically significant differences in precolonial sexual and marriage patterns between missions that invested in health and those that did not.
5.3 Education
The long-lasting effects of missionaries on education have been studied thoroughly [Woodberry (Reference Woodberry2004), Acemoglu et al. (Reference Acemoglu, Gallego and Robinson2014), McCleary (Reference McCleary2015), Valencia-Caicedo (Reference Valencia-Caicedo2018)]. If individuals living in regions close to missions with health investments tend to be more educated, then our results could be driven by human capital rather than by differences in sexual behaviors. Although the existing literature has found no systematic relation between education (in general) and STDs at the micro and short-term levels [Duflo et al. (Reference Duflo, Dupas and Kremer2015)], we cannot rule out the role of education in the long run. Table C.13 in the online Appendix reports the results of estimating equation (1) when the dependent variable is the number of years of education. As expected, proximity to a mission is correlated with more education. Importantly, we find no statistically significant relationship between proximity to missions that invested in health and the number of years of schooling. It is thus unlikely that all of our effect would be driven by human capital accumulation.
5.4 Non-sexually transmitted diseases and access to health care
This section explores the possibility that our results could be unspecific to STDs, and capturing other factors that would correlate with systematically worse health around regions where missions settled, in particular Protestant ones.
The DHS do not provide test results for other STDs, but do report other health-related outcomes, mostly for women. The DHS female dataset indeed includes results for anemia tests and a few anthropometric measures. Tables C.16 and C.17 in the online Appendix report the results of estimating equation (1) when the dependent variable is a binary variable equal to one if the respondent is either anemic or has stunted growth, and to zero otherwise.
Regarding proximity to missions, the results show that, unlike for HIV, proximity to a mission does not statistically significantly correlate with these health outcomes. If anything, we observe improved outcomes (less positive results of anemia or stunted growth), but the relationship is not significant. Therefore, it is unlikely that our results capture confounders associated with worse health outcomes around missions. Also, we do not find evidence for conflicting effects between proximity to missions and other health outcomes.
Proximity to a health investment is also associated with improved outcomes in particular regarding the likelihood that maternal care is delivered by medically trained specialists (see Table C.14 in the online Appendix). These outcomes go in line with better access to health facilities, a channel that is explored in further detail in the next section. Regarding other diseases, such as anemia or anthropometric measures, the results usually do not meet statistical significance. A possibility is that we do not observe enough variance within regions close to missions on these outcomes because there are no conflicting effects of missionary influence on non-STDs. Similarly, it is possible that better access of health infrastructure alone is not sufficient to improve all health outcomes. Our results would then have to be considered in combination with the safer sexual behaviors observed around missions with health facilities (see section 6). This result would be consistent with the results of Calvi and Mantovanelli (Reference Calvi and Mantovanelli2018) in the case of India.
5.5 Central equatorial Africa and the rest
The recent biological history of HIV has emphasized the likely role of health institutions in the early spread of the epidemic in the equatorial central African region, especially around the Congo river. The widespread use of non-sterilized needles in mass health campaigns to treat sleeping sickness, leprosy, and other diseases during colonial times is likely to have been a key vector of transmission for the disease in its early phase. This transmission is what catalyzed the formation of a large-scale epidemic [Pépin (Reference Pépin2011), Lachenal (Reference Lachenal2014), Lowes and Montero (Reference Lowes and Montero2017a)]. For this reason, proximity to a health mission, where many of these campaigns were also organized, might not have had a positive effect in Central African countries. We examine whether this is the case by considering separately the DRC and Gabon, the only countries in our sample where this early history of the epidemic might apply, and the rest of the sample.
Table C.18 in the online Appendix presents the results. Columns (1) to (3) exclude the DRC and Gabon and columns (4) to (6) restrict the analysis to the DRC and Gabon. The previously described results does not hold for Central Africa, with no statistically significant effects. Columns (4) to (6) show the same analysis, but for non-Central African countries. First, the results for the sample excluding the DRC and Gabon are similar—both in terms of statistical significance and of magnitude—to the ones presented in Table 3. Second, there is no statistically significant effect of proximity to a health station for DHS locations in the DRC and Gabon. Our results are thus consistent with the biomedical and economic history literature that emphasize the ambiguous effect of colonial medical campaigns on health and trust and medicine around the Congo river.
5.6 Controls
We show that our results do not depend on the set of controls included. Online Appendix Table C.21 shows that our results are robust to a specification that only includes year and country fixed effects. In this specification, the effect of distance to a health investment remains positive, statistically significant, and of the same order of magnitude as in our baseline set of results. There is a change in the effect of distance to missions, that become larger in absolute terms, negative and statistically significant for all missions, as opposed to just for Protestant.
5.7 Urbanization
In sub-Saharan Africa, HIV is a disease that is mostly present in urban and well-connected areas where large numbers of people transit [Pépin (Reference Pépin2011), Oster (Reference Oster2012)]. Given the large evidence of the long-term legacy of missions on long-term development, there is a possibility that our effects, in particular the long-term worsening of HIV around Protestant missions, are entirely driven by modernization.
First, we address this issue regarding missions that invested in health. The new geocovariates in the DHS (available since 2017) report the traveling connecting time to an urban area for all the geocoded DHS clusters. This variable captures both urbanization and connectedness into the transport infrastructure network, which are the key drivers of the relationship between HIV and modernization. Table C.19 in the online Appendix shows that distance to a health investment is associated with an increase in travel time.Footnote 26 Therefore, if modernization was the unique channel at play, we would expect proximity to a health investment to be associated with larger, and not lower HIV prevalence.
Table C.20 in the online Appendix reports the result of estimating our baseline equation, but in a sample restricted to the 10% most urbanized and connected clusters in the DHS. It shows that our results hold when applying this restriction. In this sample, proximity to a mission, both Catholic and Protestant, is associated with increased chances of HIV; whereas proximity to a health investment is associated with lower chances. Therefore, it seems plausible to think that urbanization and modernization are not completely driving the result.
Modernization is a channel that we acknowledge in the interpretation of our results, in particular the long-term worsening risk of HIV close to Protestant missions. The relationship between HIV and modernization has been highlighted in the literature [Fox (Reference Fox2010), Pépin (Reference Pépin2011), among others]. Our results can then be seen as further quantitative evidence for this colonial origin of the disease, thus adding nuance to the view that the missionary legacy was solely positive for development. However, within urbanized areas, we still observe are long-term effects of missionary presence (see table C.20 in the appendix). The goal of section 6 is to explore further channels of persistence, in particular relating to conversion to Christianity, sexual behaviors, and the persistence of health infrastructure.
6. Channels
Taken together, the results of this paper show that historical missionary activity has heterogeneous effects on HIV today. In this section, we discuss the channels that could explain the relationship between missionary presence, missionary health investments, and HIV prevalence.
First, we aim at getting a clearer understanding of the persistent effect of missionary health investments on HIV prevalence. To do so, we explore the possibility of persistence in infrastructure in the medium term by using the location of the colonial hospitals (we collect this information until 1926 from the British colonial statistical records—the so-called Blue Books) and the available geocoded infrastructure data from the DHS. Furthermore, we follow Calvi and Mantovanelli (Reference Calvi and Mantovanelli2018) and analyze whether there is persistence in health habits, and in particular sexual behaviors.
Second, we wish to investigate the negative relationship between missionary presence and HIV, in particular for Protestant missions. We hypothesize that conversion is a possible explanatory channel. Christianity outlasted missions, and the historical literature emphasizes that Protestant missions, the ones that actually robustly correlate with increased HIV likelihood, were much more successful than Catholics in their initial conversion enterprise [Foster (Reference Foster2013)].
The establishment of a Christian community could have had an impact on HIV prevalence for three main reasons. First, conversion disrupted existing family structures. Polygamy was the dominant (above 90%) family structure before colonization [Murdock (Reference Murdock1967)], which has been shown to be associated with lower prevalence of HIV because it creates smaller units of frequent sexual interaction compared to serial monogamy or non-faithful monogamy [Reniers and Watkins (Reference Reniers and Watkins2010)]. Second, early conversion in large numbers gave growing importance to Christian institutions; today, contemporary Christian leaders, by opposing or avoiding the discussion about safer sex practices might have impeded a reduction in the spread of the disease. Mash and Mash (Reference Mash and Mash2013) show that local churches have an active role in the contemporary design of HIV-prevention campaigns, that affect Christians and non-Christians, and that they encounter difficulties when addressing the topics about safer sex. Third, even if individual behaviors exhibit minor differences, initial differences in prevalence between groups can exacerbate over time when groups constitute relatively separate “sex markets” [Trinitapoli and Weinreb (Reference Trinitapoli and Weinreb2012, Ch. 2)].
While we do not think that conversion is the only explanatory channel, this section aims at showing that it is nonetheless one to be considered.
6.1 The persistent effect of missionary health care
In section 4.2, we have showed that within regions close to missions, proximity to a mission that invested in health care is associated with lower HIV prevalence, and it is unlikely that this relationship is fully driven by unobservables. In this section, we wish to understand the channels through which such correlation can operate.
6.1.1 Infrastructure in the medium term
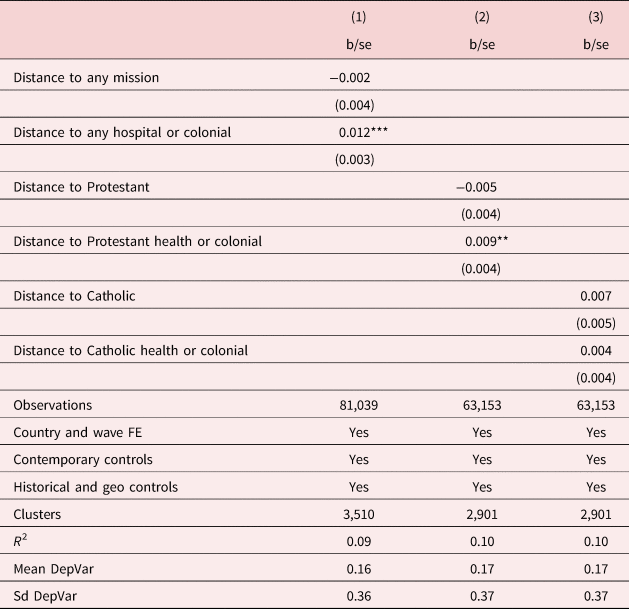
To understand whether the positive relationship between distance to missionary health stations and HIV prevalence can be driven by persistence in health infrastructure, we collect information on the location of British colonial hospitals up to the mid-1920s from the British African Blue Books. This information is particularly helpful to understand whether our results for the proximity with missionary health stations are driven by persistence in health infrastructure, such as missionary hospitals. The focus here is on Protestant health stations given that the information we have on hospitals in the 1920s is restricted to former British colonies.
The persistence of healthcare infrastructures may be an important explanatory channel given that HIV prevention policies are implemented in these infrastructures. Moreover, other health policies that can decrease the HIV risk, e.g., the provision of treatment for other, treatable, STDs, in particular STDs generating genital ulcers, take place in these hospitals. Protestant and colonial health centers devoted substantial resources for the treatment and the prevention of syphilis [de Sousa et al. (Reference de Sousa, Müller, Lemey and Vandamme2010), Doyle et al. (Reference Doyle, zu Selhausen and Weisdorf2018)].Footnote 27
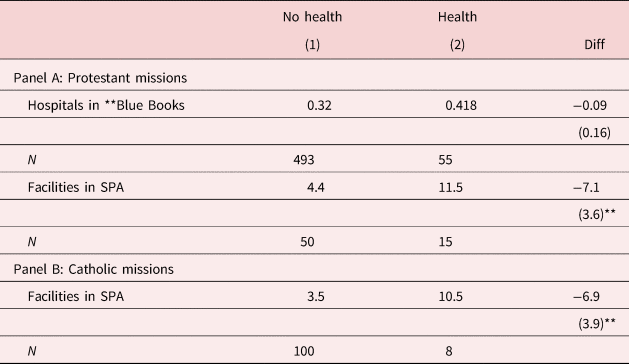
First, to capture the persistence of missionary health stations in the medium term, we want to gage whether the health facilities reported are also entered as health facilities in the colonial statistics. This could arrive for the larger hospitals, if they started receiving colonial funds or even became colonial public services [Good (Reference Good1991), Doyle et al. (Reference Doyle, zu Selhausen and Weisdorf2018)]. The first row in Table 5 gives the average number of colonial health facilities reported in the Blue Books inside a 10 km buffer of mission stations. The numbers are larger, albeit no statistically significantly so, around missions with health facilities.
Presence of health services around missions with and without health facilities

Note: This table presents the average number of colonial hospitals (“Hospitals in the Blue Books”) and health services today (“Facilities in SPA”) inside a 10 km buffer of missions with no health facilities [Column (1)] and missions with health facilities [Column (2)]. Samples differ. Only countries in the British Empire are considered for the analysis with the Blue Books. Data availability constraint the analysis for the SPA to Kenya, Malawi, Rwanda, and Sénégal.
Second, Table 6 records the results from the same analysis ran in Table 3, but replacing the distance to missionary health stations with the distance to any health center (missionary or colonial). Because the data on the location of colonial hospitals comes from the British Blue Books, the sample is restricted to former British colonies. Columns (1) and (2) show that the results are similar to those in our baseline regression. The results for Catholic health stations are not significant, which can be due to the sample restriction.
Persistence in health care: effect of missions and colonial health investments

Note: *p < 0.10, **p < 0.05, ***p < 0.01. The table reports OLS estimates. The unit of observation is the individual. The dependent variable is a binary variable equal to one if the respondent is HIV positive, and zero otherwise. Standard errors in parentheses are clustered at the closest mission level. All regressions restrict the analysis to regions at least 100 km close to missions. Controls are described in the text. The regressions are restricted to former British colonies.
6.1.2 Infrastructure in the long run
The DHS conducts a survey called “Service Provision Assessment” (SPA) that provides an overview of countries' health service delivery, such as the range of services (child health, family planning, etc.) offered per health facility or per region. This survey is geocoded in four of our sample's countries: Kenya, Malawi, Tanzania, and Sénégal. The patterns observed in this limited sample are in line with the hypothesis of persistence in infrastructure. Table 5 gives the average number of health facilities reported in the SPA inside a 10 km buffer of mission stations. The numbers are statistically significantly much larger (more than double) in buffers around missions that invested in health facilities.
6.1.3 Sexual behaviors
To capture the extent of risky sexual behaviors and general knowledge about prevention, we present results on six different outcomes that capture two important dimensions of HIV transmission: (i) paying for sex from sex workers (for men) and (ii) monogamy and number of sexual patterns. Figure 9 reports the results in graphical form to facilitate comparisons between outcomes.Footnote 28 Proximity to a mission with a health station is correlated with a number of safer sexual behaviors. Individuals living in regions close to health investments declare lower use of sex workers' services, over a lifetime or in the year of the questionnaire. Sex workers have been shown to be a crucial vector of transmission of HIV [Pépin (Reference Pépin2011)].Footnote 29 Similarly, we show that proximity to a mission decreases the likelihood of being in a monogamous relationship, but also decreases the number of sexual partners other than spouse or the number of sexual partners over the lifetime. This is consistent with a pattern of more isolated sexual networks in polygamous structures that are associated with lower HIV prevalence (as explained in section 2). We find no evidence suggesting that individuals around historical health facilities exhibit more usage or knowledge about condoms (see online Appendix Figure B.5). Therefore, it seems that proximity to historical health facilities is associated with safer sexual norms that lead to less HIV, rather than with the practice of safer sex.
Missionary investments and sexual behaviors. Note: The figures report OLS estimates. The point represents the estimated effect and the lines represent the 90% confidence interval. The unit of observation is an individual. The dependent variables vary for each graph and are reported in the legend. Standard errors are clustered at the town level. Controls are described in the text. All regressions restrict the analysis to regions at least 100 km close to missions.

These results can stem from the fact that sex prevention campaigns are run from the health facilities that have persisted (as shown in the previous section), for instance campaigns informing individuals about the risk of contracting STDs from sex workers. It could also stem from the fact that missions that specialized in health were less active in conversion and disrupted less traditional marriage patterns, in particular polygamy [Good (Reference Good1991)]. We do indeed observe that within regions close to missions, individuals are less likely to be Christian around missions that invested in health (see online Appendix Table C.28).
6.2 The persistent effect of missionary presence
The results presented in Table 3 suggest that missionary presence is consistently associated with higher HIV prevalence. This effect is mostly relevant for Protestant missionary presence. Overall, the formation of urban centers around missions and the higher prevalence of HIV in these urban centers is one channel explaining these results. The higher HIV prevalence is, in this sense, a side effect of the “modernization” that occurred in locations where missionaries settled, in particular Protestant missions.
In this section, we argue that conversion may be another important channel. In analyzing the effects of missionary proximity per se, we move away from the strict within-mission analysis that has characterized our previous research [Cagé and Rueda (Reference Cagé and Rueda2016)] and this paper's findings regarding health stations. Although the results should thus be interpreted with caution, we consider important to document conversion—a cultural channel—as an additional factor explaining the persistent effect of missionary presence on HIV.
Missions had a long-run cultural imprint. They indeed started a large-scale conversion process, and Africa exhibits today among the largest growth in Christian population. Table C.28 in the online Appendix corroborates the results by Nunn (Reference Nunn2010), who shows that Christian conversion persisted around missions.
To begin with, we compare the sexual behaviors of the Christian (Catholic and Protestant) and of the non-Christian citizens surveyed in the DHS. Table 7 presents the results. We observe that despite being more educated on average than non-Christians, Christians have riskier sexual behaviors. They have more sexual partners over their lifetime and are more likely to use the services of sex workers. Furthermore, they are also less likely to be abstinent before marriage. Despite being more likely to know that condoms lower the chances of transmitting HIV, they are less likely to know where to find them. These results also hold when restricting our sample of analysis to individuals living in urban areas (online Appendix Table C.29).
Descriptive statistics: HIV prevalence and sexual behaviors, Christians vs. non-Christians (t-test)

Note: The table reports descriptive statistics. The unit of observation is an individual. Column (1) reports the means for non-Christians. Column (2) reports the means for Christians. Column (3) performs a t-test on the equality of means.
Focusing on conversion also helps understanding why the worsening of HIV around missions is mostly driven by Protestant missions. According to the historical literature, Catholic missionaries were less successful in their conversion enterprise. The introductions of the 1913 and the 1929 Atlas Hierarchicus state the Vatican's worries about lagging behind Protestant missions in the Empire [Streit (Reference Streit1913, Reference Streit1929)]. Catholic missions were far less successful in consolidating a local clergy, the very effective conversion army of Protestants. This endeavor was indeed particularly challenging given Catholicism's exigency of priest celibacy, and its reliance on Latin for clerical education liturgy before Vatican II in 1959 [Hastings (Reference Hastings1996), Frankema (Reference Frankema2012), Jedwab et al. (Reference Jedwab, zu Selhausen and Moradi2018)]. Moreover, Catholic missions concentrated in former French and Belgium colonies. Their religious activities were viewed with more hostility by colonial administrators in the French anticlerical political environment before World War One [Woodberry (Reference Woodberry2004), Foster (Reference Foster2013)].Footnote 30
Moreover, a comparison within Christians, between Catholics and Protestants, shows that Catholics have safer sexual behaviors. These results are to be interpreted with caution as religious affiliation is not reported in a standardized way across surveys, and categories separating Catholics and Protestants are not always mutually exclusive. Table 8 presents the results. As before, Protestants are significantly more educated and there is virtually no difference regarding urban residence. Catholics exhibit certain riskier behaviors, like a larger age gap inside the household, or a larger number of sex partners. Protestants are nonetheless more likely to use the services of sex workers over their lifetime, which is a very strong determinant of HIV transmission, and less likely to know that condoms lower the chances of HIV contamination. Although it is statistically significant, the difference is quantitatively very small.
Descriptive statistics: HIV prevalence and sexual behaviors, Catholics vs. Protestants

Note: The table reports descriptive statistics. The unit of observation is the individual. Column (1) reports the statistics for Protestants. Column (2) reports similar statistics for Catholics. Column (3) performs a t-test on the equality of means.
The statistics in Table 8 can strike as a surprise; after all, the most well-known opposition to anti-HIV policies favoring access to condoms was the Vatican's official publication “Family Values versus Safe Sex,” of which the first chapter is entitled “The Catholic Church's Criticism of the Condom in AIDS-Prevention Programmes” [López-Trujillo (Reference López-Trujillo2003)]. However, the Vatican's positions do not necessarily reflect the diversity of practices in the field. Furthermore, our data do not allow us to control for the intensity of religiosity, nor to decompose accurately the effects between different denominations of Protestants that can substantially differ in prevalence and sexual behaviors [Trinitapoli and Weinreb (Reference Trinitapoli and Weinreb2012)]. Further research could aim at understanding this particular point.
To test the plausibility of conversion as one explanatory channel, we run the same regressions as those in Table 3, and add an interaction term between distance to the mission and religion, as well as a religion binary variable. We pool all Christian denominations together into one single binary variable because, as explained before, the DHS religious categories are not standardized across waves. The religious variable allows, however, to distinguish precisely between Muslims, Christians, and Traditional religions. The results are reported in Table 9.
Individual level OLS: distance to mission, religion interactions, and HIV status

Note: *p < 0.10, **p < 0.05, ***p < 0.01. The table reports OLS estimates. The unit of observation is an individual. The dependent variable is a binary variable equal to one if the respondent is HIV positive, and zero otherwise. Standard errors in parentheses are clustered at the town level. Controls are described in the text. All regressions restrict the analysis to regions at least 100 km close to Catholic missions [columns (1) and (3)] or Protestant missions [columns (2) and (4)].
Columns (1) and (3) show that distance to a Catholic mission does not seem to affect the probability of being tested positive for HIV for either Christians or Muslims. Similarly, the negative effect of distance to a Protestant mission is stronger for Protestants [columns (2) and (4)], and not statistically significant for Muslims.
Taken together, these results combined with the historical evidence suggest that conversion is a channel of transmission that contributes to explaining the long-lasting effects missions on HIV prevalence. Given data limitations and potential confounders the magnitudes of these findings have to be interpreted with caution. Despite these caveats, the possible negative effect of missionary activity on development through cultural transformations in the colonial context is a relevant finding in the growing economic literature on the, mostly positive, persistent effects of missionary activity.
7. Conclusion
Sub-Saharan Africa accounts for more than two-thirds of the world's HIV infections. In this paper, we provided new empirical evidence on the long-term effects of missionary activities in sub-Saharan Africa. We highlight two possible countervailing effects of missions on HIV prevalence. On the one hand, their early investments in health facilities have a positive long-term impact on HIV prevalence, through the persistence of infrastructure and safer sexual behaviors. On the other hand, missionaries left a profound cultural imprint: conversion to Christianity increased the risk of contagion by changing family structures and increased exposure to religious institutions that have struggled to effectively address the epidemic.
While the existing literature has mostly focused on missionary presence per se, and on showing their positive consequences for development, we highlight the complexity of their long-term effects. The devil is in the details, and depending on how much missionaries were inclined toward the provision of health services, or how fervent they were, the effect of missionary activity on HIV can vary.
Finally, we think that our results may help us reflect on contemporary HIV prevention policies. In the United States, religious conservatives strongly support abstinence-until-marriage (AUM) as the central element of HIV prevention efforts, and this policy periodically receives a large share of the Federal funding. In fiscal years 2006 to 2008, one-third of the President's Emergency Plan for AIDS Relief's budget was to be spent on abstinence-only campaigns.Footnote 31 The conservative focus of HIV prevention is not declining, with American and local religious conservatism converging in the shaping of HIV prevention programs [see e.g., Jappah (Reference Jappah2013)]. Our long-term perspective suggests that a focus only on “Christianizing” marriage patterns and sexual behaviors is unlikely to be successful.
Supplementary material
The supplementary material for this article can be found at https://doi.org/10.1017/dem.2019.16.
Acknowledgement
We gratefully acknowledge many helpful comments and suggestions from Brian A'Hearn, Bob Allen, Yann Algan, Steve Broadberry, Sascha Becker, Yannick Dupraz, Rui Esteves, James Fenske, Elise Huillery, Jane Humphries, Jean-Louis Keene, Michael Koelle, Sara Lowes, Nathan Nunn, Kevin O'Rourke, Jared Rubin, Avne Offer, Pauline Rossi, and Paul Seabright. We are also grateful to participants at the ASREC, LAGV, the Warwick-Political Economy of Development, and the World Economic History conferences; as well as to seminar participants in the universities of Los Andes, Bonn, Exeter, Glasgow, Harvard, Monash, Nottingham, Oxford (ESH and CSAE), the Paris School of Economics, Queen Mary, el Rosario, Sciences Po, and Warwick. We thank Marcella Alsan for sharing her tsetse fly suitability index data with us. Sidhart Bhushan provided outstanding research assistance. This research was generously supported by Oxford University's John Fell Fund. All errors are our own.