Implications
Supplementation of a methionine (Met)-deficient diet with either calcium salt of methionine hydroxy analog (MHA-Ca, 84%) or dl-methionine (dl-Met, 99%) significantly improved N retention and performance of pigs indicating that Met supplementation is essential when swine diets, especially those fed to young pigs, are formulated with ingredients that are low in Met. The current data showed that the bioefficacy of MHA-Ca utilization as a Met precursor in a Met-deficient diet to support N retention is 71% relative to dl-Met (product-to-product basis), which should be considered when pig diets are supplemented with Met sources.
Introduction
Methionine (Met) is an indispensable amino acid (AA) that must be supplied in adequate amounts in pig diets to optimize performance (Shoveller et al., Reference Shoveller, Moehn, Rademacher, Htoo and Ball2010). Recently, the calcium salt of hydroxy analog of dl-methionine (MHA-Ca, 84%) was re-introduced to the market as an alternative Met source for poultry and swine in addition to dl-methionine (dl-Met, 99%) and liquid MHA-free acid (MHA-FA, 88%) that have been utilized as Met sources during the past two decades (Elwert et al., Reference Elwert, Fernandes and Lemme2008). Like MHA-FA, the re-introduction of MHA-Ca has generated questions about its relative bioavailability (RBV) compared with dl-Met as a Met source (Elwert et al., Reference Elwert, Fernandes and Lemme2008). In animal nutrition, the term ‘bioavailability’ refers to the degree to which an ingested nutrient in a particular source is absorbed in a form that is utilized for metabolic purposes by the animal (Littell et al., Reference Littell, Henry, Lewis and Ammerman1997). It is important to determine the RBV of these Met sources to facilitate efficient diet formulation and animal production, and to minimize nutrient excretion.
In a recent study, Elwert et al. (Reference Elwert, Fernandes and Lemme2008) reported that the mean RBV of MHA-Ca to dl-Met was 63% on a product-to-product basis in broiler chickens. Likewise, Dilger and Baker (Reference Dilger and Baker2008) reported that MHA-Ca was 65.6% as efficacious as dl-Met on a product-to-product basis in chicks. However, there is still scarcity of information on the RBV of MHA-Ca to dl-Met as a Met source for pigs. Zimmermann et al. (Reference Zimmermann, Mosenthin, Rademacher, Lynch and Esteve-Garcia2005) reported that supplementation of a Met-deficient diet with 100 parts of MHA-FA and 65 parts of dl-Met resulted in a similar performance in weaned pigs. This observation was in agreement with the results of Shoveller et al. (Reference Shoveller, Moehn, Rademacher, Htoo and Ball2010) who reported that the RBV of MHA-FA to dl-Met was 66% for protein deposition in growing pigs. It is unknown whether these observations hold true for MHA-Ca. Therefore, the objectives of the present studies were: (1) to determine the RBV of MHA-Ca compared with dl-Met in starter pigs in a N balance assay (Experiment 1 (Exp. 1)) and (2) to test if replacing 65 parts of dl-Met with 100 parts of MHA-Ca on a product basis in a Met-deficient diet supports similar performance in starter pigs under practical conditions (Exp. 2).
Material and methods
Two experiments were conducted with starter pigs at two separate locations. Experiment 1 (N balance assay) was conducted at the University of Manitoba (Winnipeg, Canada). Experiment 2 (performance assay) was conducted under the commercial conditions of pork producer Copaga S. Coop (Lleida, Spain). The experimental protocol for Exp. 1 was reviewed and approved by the animal care and use committee of the University of Manitoba.
Experiment 1
Forty-two Genesus barrows ((Yorkshire × Landrace) × Duroc; Keystone Pig Advancement Inc., Oakville, MB, Canada) with an average initial BW of 19 ± 2.0 kg were obtained from Glenlea Swine Research Farm in two batches of 21 pigs each. Each batch of pigs served as a block. Three pigs were randomly allotted to each of seven experimental diets within each block resulting in a total of six replicate pigs per dietary treatment. Pigs were housed individually in adjustable metabolism crates (0.91 × 1.52 m) with smooth, transparent plastic sides and plastic-covered expanded metal flooring in a temperature controlled room (22 ± 2°C). Each crate was equipped with a single low-pressure drinking nipple and a stainless steel self-feeder.
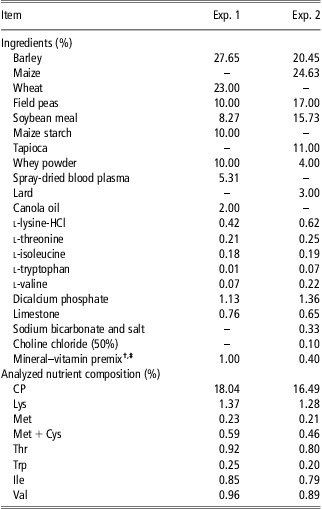
The dietary treatments consisted of a basal, wheat–barley–field peas–soybean meal diet formulated to be deficient in Met or the basal diet with three added levels of dl-Met (0.02%, 0.04% and 0.06%) or MHA-Ca (0.024%, 0.048% and 0.071%) supplemented on an equimolar basis (Table 1) at the expense of maize starch. The basal diet was formulated to be adequate in all essential nutrients and energy except for Met content, which was set at ∼78% of the Met requirement for 10 to 20 kg pigs as recommended by the National Research Council (NRC, 1998).
Composition and calculated nutrient and energy contents of the basal diets, as-is basisFootnote *

Exp. = Experiment; Lys = lysine; Met = methionine; Cys = cysteine; Thr = threonine; Trp = tryptophan; Ile = isoleucine; Val = valine.
* The calculated composition (%, standardized ileal digestible basis) of basal diet used in Exp. 1 and Exp.2, respectively, were: Lys, 1.35% and 1.21%; Met, 0.21% and 0.18%; Met + Cys, 0.58% and 0.38%; Thr, 0.91% and 0.74%; Trp, 0.24% and 0.21%.
† Supplied the following per kg of diet in Exp. 1: 8255 IU of vitamin A, 1000 IU of vitamin D3, 20 IU of vitamin E, 25 μg of vitamin B12, 1.5 mg of vitamin K, 30 mg of niacin, 781 mg of choline chloride, 7.5 mg of riboflavin, 200 μg of biotin, 4.5 mg of pyridoxine, 1 mg of folic acid, 4 mg of thiamin, 40 mg of Mn (as MnO), 130 mg of Zn (as ZnO), 130 mg of Fe (as FeSO4.H2O), 10 mg of Cu (as CuO), 0.30 mg of Se (as Na2SeO3) and 0.6 mg of I (as Ca(IO3)2).
† Supplied the following per kg of diet in Exp. 2: 10 000 IU of vitamin A, 2000 IU of vitamin D3, 15 mg of vitamin E, 1.3 mg of vitamin B1, 3.5 mg of vitamin B2, 0.025 mg of vitamin B12, 1.5 mg of vitamin B6, 10 mg of calcium pantothenate, 15 mg of nicotinic acid, 0.1 mg of biotin, 0.6 mg of folic acid, 2 mg of vitamin K3, 80 mg of Fe, 6 mg of Cu, 0.75 mg of Co, 150 mg of Zn, 60 mg of Mn; 0.75 mg of I, 0.10 mg of Se and 150 mg of ethoxiquin.
The experiment lasted 12 days consisting of a 7-day adaptation period to the metabolism crates, meal regimen and experimental diets and a 5-day period of quantitative collection of feces and urine. Each metabolism crate had a collection tray for urine collection and a fine-mesh net just above the tray for fecal collection thus, allowing for separate but total collection of feces and urine. Pigs were weighed at the beginning and end of the adaptation period and at the end of collection. Daily feed allowance during the adaptation and collection periods was set at 3.5% of the average BW at the beginning and end of adaptation period, respectively. The daily feed allotment was divided into two equal portions and offered at 0800 and 1600 h. Diets were fed as a mash and pigs had unlimited access to water at all times.
On the morning of day 8, each pig received 100 g of feed mixed with 3 g of ferric oxide as an indigestible marker to signal the start of fecal collection. Upon complete consumption of the marked diet, the remainder of the morning allotment was fed. Feces collection commenced once the marked (red) feces appeared. Feces were collected daily, weighed and stored immediately in a −20°C freezer. Once again, pigs were fed 100 g of feed mixed with 3 g of ferric oxide on the morning of day 13 and this was followed by feeding the remaining of the morning allotment. Fecal collection was terminated immediately when the marked feces appeared. The urine collection started and ended with the feeding of marked diet on the morning of days 8 and 13, respectively. Urine was collected in plastic jugs containing 10 ml of 6 N HCl. Glass wool was placed in the funnel of the collection jugs to trap any fecal materials contained in the urine. Urine weight was determined daily and a 10% aliquot was sub-sampled and stored at −20°C for subsequent analysis.
Experiment 2
A total of 280 crossbred (Pietrain × (Landrace × Large White)) mixed sex pigs weaned at 21 days of age were used in a 21-day performance trial. Pigs were adapted to the housing conditions for a period of 10 days during which they received a commercial starter diet. At 32 days of age, pigs were weighed, balanced for BW and sex and then randomly allocated to five dietary treatments. Pigs were housed in slatted floor pens (1.0 m × 2.2 m) in a temperature-controlled room with eight pigs (four barrows and four gilts) per pen. The pens were equipped with one stainless steel feeder (1.0 m in length) and a single automatic nipple drinker. Room temperature was maintained at 30°C during the 1st week and gradually decreased at a rate of 1.5°C per week.
The experimental diets were a basal diet or the basal diet supplemented with two graded levels of dl-Met (0.04% and 0.08%) or MHA-Ca (0.062% and 0.12%) on a product basis at dl-Met to MHA-Ca ratio of 65 : 100 (Table 1) at the expense of maize. The basal diet was based on barley, field peas, maize and soybean meal, and its Met level was set to be deficient at ∼70% of the recommended requirement for 10 to 20 kg pigs (NRC, 1998). However, it was adequate in all other essential nutrients and energy as recommended by NRC (1998). In both experiments, the AA-containing ingredients were analyzed for their AA contents, and the analyzed AA contents and the standardized ileal digestibility coefficients reported by Rademacher et al. (Reference Rademacher, Sauer and Jansman2001) were used in the actual diet formulations.
Pigs had free access to feed and water at all times. Diets were fed as a dry mash. Individual BW and pen feed disappearance were recorded weekly to calculate average daily gain (ADG), average daily feed intake (ADFI) and feed : gain ratio (FGR).
Sample processing and chemical analysis
At the end of collection in Exp. 1, fecal samples were dried at 55°C in a forced air oven for 5 days and ground in a Wiley mill through a 1-mm sieve along with feed samples. Feces were pooled per pig and then sub-sampled for analysis. Feed, feces and urine samples were analyzed for N content using a Leco NS 2000 Nitrogen Analyzer (LECO Corporation, St. Joseph, MI, USA). Nitrogen in urine was determined on fresh material.
Dietary AA concentrations were determined by ion-exchange chromatography with post-column derivatization with ninhydrin. AAs were oxidized with performic acid, which was neutralized with sodium metabisulfite (Llames and Fontaine, Reference Llames and Fontaine1994; Commission Directive, 1998). AAs were liberated from the protein by hydrolysis with 6N HCL for 24 h at 110°C and were quantified with the internal standard method by measuring the absorption of reaction products with ninhydrin at 570 nm. Tryptophan was determined by HPLC with fluorescence detection (extinction 280 nm, emission 356 nm) after alkaline hydrolysis with barium hydroxide octahydrate for 20 h at 110°C (Commission Directive, 2000). Supplemented AA were determined after extraction with 0.1N HCL (Commission Directive, 1998). The content of supplemented MHA-Ca was analyzed using the method described by VDLUFA (1997).
Statistical analysis
In Exp. 1, data were analyzed as a randomized complete block design using GLM procedure of SAS (SAS Inst. Inc., Cary, NC, USA). The fixed effect of diet and the random effect of block (batch) and pigs were included in the model. The individual pig was used as the experimental unit. Orthogonal-polynomial contrasts were used to determine linear and quadratic effects of increasing levels of dl-Met and MHA-Ca on response criteria, and the effect of Met sources. N retention data were subjected to multiple linear regression analyses to verify the fundamental validity assumptions of the slope-ratio assay (Littell et al., Reference Littell, Henry, Lewis and Ammerman1997), which include testing for linearity of responses, equality of the intercept and equality of the common intercept to the mean of the basal diet. The statistical validity tests described by Littell et al. (Reference Littell, Henry, Lewis and Ammerman1997) determine whether the average of the two slopes is different from zero and if the slopes of the individual lines are different from each other. Because the requirements for fundamental validity were met, the multiple linear regression analysis was performed using the following equation:
 $$y\,{\rm{ = }}\,a\,{\rm{ + }}\,b\times {{{\sc dl} \rm {\hbox{-}} Met}}\,{\rm{ + }}\,c\times {\rm{MHA {\hbox{-}} Ca}}$$
where y is the response variable (N retained, N retention), a is the intercept, b is the slope of the line in response to percent dl-Met in the diet, dl-Met is the percent supplemental dl-Met in the diet, c is the slope of the line for percent MHA-Ca in the diet, MHA-Ca is the percent supplemental MHA-Ca in the diet. The RBV of MHA-Ca as compared with dl-Met was calculated as the ratio of their linear slopes (i.e. c/b × 100) as described by Littell et al. (Reference Littell, Henry, Lewis and Ammerman1997).
In Exp. 2, data were analyzed as a completely randomized design using GLM procedure of SAS with pen as the experimental unit. The model included diet as the fixed effect, and pen as random effect. Orthogonal-polynomial contrasts were used to determine linear and quadratic effects of increasing levels of dl-Met and MHA-Ca on response criteria, and the effect of Met sources. The statistical significance level was claimed at P < 0.05.
Results
General
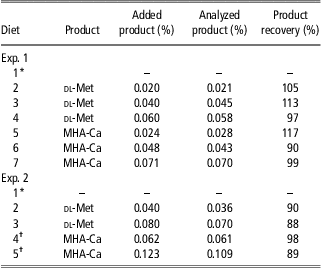
The analyzed CP and AA (Table 1) contents of experimental diets revealed that the formulated levels of nutrients were achieved in both experiments. The analyzed content of the supplemental dl-Met and MHA-Ca were slightly above or below the calculated values for some diets (Table 2), however, the graded levels were in the same order.
Analyzed dl-Met and MHA-Ca contents of diets, as-fed basisFootnote *
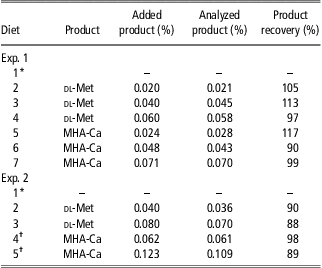
dl-Met = dl-methionine; MHA-Ca = calcium salt of dl-methionine hydroxy analog; Exp. = Experiment.
* Levels of dl-Met and MHA-Ca were non-detectable in the basal diet.
† Based on dl-Met to MHA-Ca ratio of 65 : 100, product-to-product basis.
Experiment 1: Nitrogen balance study
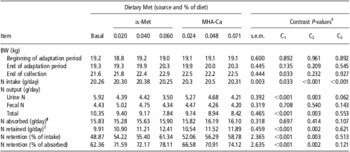
All pigs consumed their daily feed allotment during the experiment. The BW and N retention data were tested for linear and quadratic effects (Table 3). There was a linear (P < 0.05) response of final BW to dl-Met supplementation. Met supplementations had no effect on fecal N excretion. However, urinary N and total N output decreased linearly (P < 0.01) with increasing Met supplementation from both sources. Nitrogen retained (g/day) and N retention expressed as % of intake and as % of absorbed increased linearly (P < 0.01) with supplementation of the basal diet with increasing level of either dl-Met or MHA-Ca. There were no quadratic effects of the two Met sources on N output, N retained (g/day) and N retention (% of intake). A tendency towards increased N excretion via urine (P = 0.06) with the addition of MHA-Ca was observed. However, N absorbed and N retention parameters were not affected by the Met source (Table 3).
BWs and nitrogen retention of pigs fed diets containing graded levels of dl-Met or MHA-Ca, Exp. 1

Met = methionine; dl-Met = dl-methionine; MHA-Ca = calcium salt of dl-methionine hydroxy analog; Exp. = Experiment.
†P-values of orthogonal contrasts: C1 = linear effect of dl-Met, C2 = linear effect of MHA-Ca, C3 = dl-Met v. MHA-Ca diets.
‡N absorbed = N intake – fecal N.
§N retained = N intake – (fecal N + urine N).
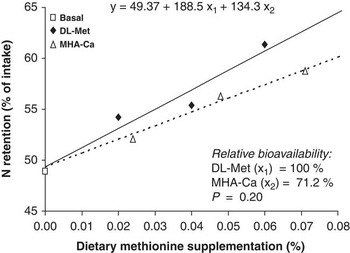
The slopes of the two Met sources were not different for N retention expressed as % of intake (Figure 1). Using a slope-ratio procedure, the RBV of MHA-Ca to dl-Met was estimated to be 71% on a product basis or 85% on equimolar basis for N retention (% of intake; Figure 1).
Bioavailability of calcium salt of hydroxy analog of methionine (MHA-Ca) relative to dl-methionine (dl-Met) based on N retention (% of intake), Exp. 1. Relative bioavailability was 71.2% (134.3/188.5 × 100) on a product basis (71.2/0.84 = 84.8% on equimolar basis).

Experiment 2: Performance study
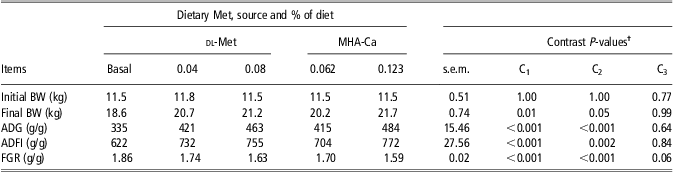
The performance results during the 21-day experimental period are presented in Table 4. The average initial and final BW of the pigs was 11.6 ± 1.2 and 20.5 ± 2.1 kg, respectively. Performance of pigs fed the Met-deficient basal diet was the lowest and addition of both Met sources to the basal diet linearly increased (P < 0.05) ADG, final BW, ADFI and tended to improve (P = 0.06) FGR. Overall, performance was not different (P > 0.05) among pigs fed similar inclusion levels of the two Met sources at dl-Met to MHA-Ca ratio of 65 : 100 on a product basis (Table 4).
Performance of pigs fed supplemented with dl-Met and MHA-Ca at a ratio of 65 : 100 (11 to 22 kg), Exp. 2
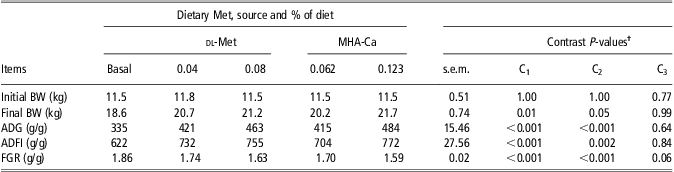
dl-Met = dl-methionine; MHA-Ca = calcium salt of dl-methionine hydroxy analog; Exp. = Experiment; Met = methionine; ADG = average daily gain; ADFI = average daily feed intake; FGR = feed : gain ratio.
†P-values of orthogonal contrasts: C1 = linear effect of dl-Met, C2 = linear effect of MHA-Ca, C3 = dl-Met v. MHA-Ca diets.
Discussion
Body N retention (Exp. 1) and growth performance (Exp. 2) were improved with Met supplementation, regardless of Met source, indicating that the basal diet was clearly deficient in Met and that the dose responses were tested at a sensitive level. In Exp. 1, the urinary N and total N output decreased linearly with Met supplementation from either dl-Met or MHA-Ca indicating a more efficient utilization of dietary N. Deficiency in Met will limit the use of other AA for protein synthesis and thus, would increase the amount of AA catabolized and excreted as urea via urine (Brown and Cline, Reference Brown and Cline1974). The higher urine N excretion associated with Met deficiency reiterate the importance of balancing swine diets for AA to optimize protein deposition and minimize N excretion in the manure.
The slope-ratio assay has long been used to determine the RBV of nutrients in animals (Littell et al., Reference Littell, Henry, Lewis and Ammerman1997). In the current study, the slope-ratio assay estimated the RBV of MHA-Ca to dl-Met using N retention expressed as % of intake as a response criterion to be 71% on product-to-product basis. Applying the N-balance technique, N retention (expressed as % of absorbed) has sometimes been used (e.g. Otto et al., Reference Otto, Yokoyama, Ku, Ames and Trottier2003). When N retention was expressed as % of absorbed, a lower RBV of 56%, on product-to-product basis, for MHA-Ca relative to dl-Met was estimated. This observation suggests a better post-absorptive utilization of dl-Met for N retention compared with MHA-Ca in Met-deficient diets. However, N absorbed in the current study was rather a measure of the amount of N disappeared from the gastrointestinal tract (GIT; i.e. N intake – fecal N), and thus the potential influence of N (AA) degradation by the gut microbes on the N absorbed results cannot be ignored. A tendency for dl-Met to minimize urinary N excretion more effectively than MHA-Ca was observed. The mean RBV of 71% for MHA-Ca observed in the current study is lower than its MHA content of 84% in the MHA-Ca on product basis.
Numerous studies have been conducted to compare the RBV of Met sources. Some reported that the RBV of MHA is significantly lower than dl-Met (e.g. Zimmermann et al., Reference Zimmermann, Mosenthin, Rademacher, Lynch and Esteve-Garcia2005; Kim et al., Reference Kim, Lindemann, Rademacher, Brennan and Cromwell2006; Shoveller et al., Reference Shoveller, Moehn, Rademacher, Htoo and Ball2010), whereas others suggested a similar RBV between dl-Met and MHA (e.g. Reifsnyder et al., Reference Reifsnyder, Young and Jones1984; Chung and Baker, Reference Chung and Baker1992; Knight et al., Reference Knight, Atwell, Wuelling, Ivey and Dibner1998; Roemer and Abel, Reference Roemer and Abel1999).
An important prerequisite to detect differences in comparing the RBV of an essential nutrient is that the basal diet has to be clearly deficient in the nutrient under study (Huyghebaert, Reference Huyghebaert1993). Supplying Met above requirement level will not lead to any further increase in performance. Therefore, the graded levels of Met in the test diets should be within the sensitive level, that is, the response curve should range between most deficient and near the asymptote. A minimum of three Met levels are required to determine bioavailability, and it should be used only ‘in the presence of high confidence that the assumptions are valid’ (Littell et al., Reference Littell, Lewis and Henry1995). Additionally, appropriate statistical methods such as linear slope ratio or simultaneous nonlinear regression analysis must be employed to interpret the results (Littell et al., Reference Littell, Henry, Lewis and Ammerman1997).
One factor contributing to the lower bioefficacy of MHA-Ca may be related to the efficiency of post-absorptive metabolic conversion to l-Met, which is necessary for incorporation into animal proteins. Both d- and l-isomers of MHA-Ca must be converted to l-Met whereas only d-isomers of dl-Met have to be converted (Dilger and Baker, Reference Dilger and Baker2008), thus allowing for a more efficient utilization of dl-Met for body protein synthesis (Payne et al., Reference Payne, Lemme, Seko, Hashimoto, Fujisaki, Koreleski, Swiatkiewicz, Szczurek and Rostagno2006). The process includes a unique oxidation step for each of the three compounds yielding keto-Met as an intermediate followed by a common transamination step to l-Met. In the case of dl-Met, 50% of the product is in the l-isomer form and does not require conversion. Interestingly, performance analysis studies in the pig suggest that d-Met can be converted to l-Met with 100% efficacy (Baker, Reference Baker1994).
Recently, Malik et al. (Reference Malik, Hoehler, Rademacher, Drew and Van Kessel2009) fed diets supplemented with purified 3H-labelled l-Met or 3H-labelled l-MHA-FA to conventional and germ-free (monoassociated) pigs, and reported that although no differences were observed in germ-free pigs, the residual (unabsorbed) radioactivity of l-MHA-FA in the small intestine was significantly greater than that of l-Met in conventional pigs, which suggests a higher absorption of Met relative to MHA-FA from the GIT of pigs. This finding agrees with Drew et al. (Reference Drew, van Kessel and Maenz2003) who also observed that in conventional broilers, the residual radioactivity in ileal digesta was 2.7-fold higher for l-MHA-FA than l-Met. Similarly, Lingens and Molnar (Reference Lingens and Molnar1996) reported that the residual radioactivity in ileal digesta of broilers fed labeled MHA-Ca was 3.9-fold higher (17% v. 4.4% of the amount consumed) than for dl-Met.
In addition, Malik et al. (Reference Malik, Hoehler, Rademacher, Drew and Van Kessel2009) also found that the dietary supplementation of MHA-FA significantly increased total aerobes and lactobacilli populations in the upper small intestine of conventional pigs, and suggested that this may have contributed to the increased residual MHA-FA activity in upper small intestinal contents. These results support the hypothesis that gut microbiota compete with the host for metabolism of supplemented AA, and microbial metabolism of MHA-FA is a potential contributor to a lower RBV of MHA-FA relative to dl-Met (Malik et al., Reference Malik, Hoehler, Rademacher, Drew and Van Kessel2009).
It was recently demonstrated in broiler chickens that the RBV of MHA-Ca was lower compared with dl-Met (66% on product-to-product basis) when the chicks were fed diets deficient in Met but containing excess amount of Cys (Dilger and Baker, Reference Dilger and Baker2008). However, no differences in RBV between the two Met compounds were observed when the basal diet was deficient in both Cys and Met. The proposition that dietary Cys concentration, the degree of Met deficiency and/or Cys : Met ratio may influence MHA-Ca utilization in poultry has been suggested previously (Scott et al., Reference Scott, Kelly and Huston1966; Christensen et al., Reference Christensen, Anderson and Dobson1980; Boebel and Baker, Reference Boebel and Baker1982). The role of Cys on Met utilization in pigs is less clear or inconsistent. For example, the RBV of MHA-FA was not different from that of dl-Met when Cys and Met were equally deficient in the basal diet (Yi et al., Reference Yi, Gaines, Ratliff, Srichana, Allee, Perryman and Knight2006). In contrast, Zimmermann et al. (Reference Zimmermann, Mosenthin, Rademacher, Lynch and Esteve-Garcia2005) and Feng et al. (Reference Feng, Qiao, Ma, Wang, Li and Thacker2006) observed a lower RBV of 62% to 64% on a product basis for MHA-FA compared with dl-Met despite the fact that both Met and Cys were limiting in the basal diet.
Because of a lack of Met source effect on absorbed N in Exp. 1, it would be logical to hypothesize that MHA-Ca supplementation to Met-deficient diet partly drives the conversion of Met to Cys via transsulfuration pathway. If that is the case, l-Cys synthesized in excess of the requirement for protein synthesis would be broken down and excreted as urea in the urine. This probably explains the reason why dl-Met was more efficient in reducing the urinary N excretion than MHA-Ca. The scope of the current study does not include specific investigation of the reasons for the lower post-absorptive efficacy of MHA-Ca relative dl-Met in Met-deficient diet in pigs. Thus, future studies should investigate metabolic indicators of MHA-Ca conversion to l-Met as well as that of transsulfuration pathway. In addition, the role of dietary Cys level and/or Cys : Met ratio on Met precursors in swine diets should also be investigated.
In addition to the N-balance assay, the RBV of the two Met sources were validated in a performance trial under commercial conditions. Although the FGR was numerically better for the diets supplemented with MHA-Ca v. dl-Met, the overall performance was not different (P > 0.05) among pigs fed diets supplemented with the two Met sources at dl-Met to MHA-Ca ratio of 65 : 100. The performance data indicate that supplying adequate level of Met in swine diets is essential to maintain optimal pig performance. To the best of our knowledge, there are no previous published data on the RBV of MHA-Ca and dl-Met to support N retention and performance in pigs. It has been recently reported that, on a product-to-product basis, the RBV of MHA-Ca relative to dl-Met was 63% in broiler chickens (Elwert et al., Reference Elwert, Fernandes and Lemme2008) and 66% in chicks fed Met-deficient basal diet (Dilger and Baker, Reference Dilger and Baker2008). These RBV values are slightly lower than the RVB value of 71% on a product-to-product basis observed in the current study.
Conclusions
The results of the present N balance study showed that the bioefficacy of MHA-Ca relative to dl-Met was 71% on a product-to-product basis (85% on equimolar basis) for N retention expressed as % of intake when added to a Met-deficient diet. The results of the performance study also showed that the overall performance was not different among pigs housed under commercial conditions and fed similar inclusion levels of two Met sources added to the Met-deficient diet at a dl-Met to MHA-Ca ratio of 65 : 100 on a product basis.
Acknowledgment
The authors would like to thank Lisa Rigaux for technical assistance and Robert Stuski for help with animal care.