Introduction
In the past two decades, the Galapagos Islands have become not only a laboratory for biological and ecological research but also an experiment in ecotourism, with potentially far-reaching ramifications for ecotourism policies worldwide. The Ley Especial de Galápagos (Special Law of the Galapagos), implemented in 1998, marked a shift towards local decision-making in the design and implementation of development policy on the islands. The findings presented below cast doubt on islanders’ ability to balance the dual objectives of economic development and conservation under this new policy regime.
The World Conservation Union and the Ecotourism Society define ecotourism as ‘responsible travel to natural areas that conserves the environment and sustains the well-being of local people’ (Blangy and Wood, Reference Blangy, Wood, Lindberg and Hawkins1993). The goal of channeling economic benefits to the local population in order to create incentives for conservation is central to nearly all definitions of ecotourism, and it has been a focus of recent conservation policy in the Galapagos.
Prior to 1990, studies of tourism's influence on the Galapagos Island economy employed partial approaches based on surveys of tourists. They understated tourism's impacts. De Miras (Reference de Miras1995) reported that only 7.6 per cent of the average cost of trips to the Galapagos was spent on the islands (e.g., in hotels, restaurants, souvenir shops, etc.). The rest went to purchase tourist packages, pay for stays on cruise ships, and hire tour operators based outside the islands. Zador (Reference Zador1994) argued that more than 90 per cent of the income generated by Galapagos tourism was absorbed directly by the two airlines serving the islands and by cruise ships based physically on the islands but owned by local operators or entities in mainland Ecuador. Both of these studies ignored the possibility that these entities may have economic linkages with the islands that shape island incomes. Examples of such linkages include the salaries of crew members whose families are based on the islands and the purchase of food from local fishermen and farmers to feed cruise ship guests.
In contrast, Taylor et al. (Reference Taylor, Yúnez-Naude, Dyer, Ardila and Stewart2003) proposed a micro economy-wide approach, using data from surveys of tourists, businesses, and households. Social Accounting Matrix (SAM) and small-economy general-equilibrium models reveal complex market linkages that transmit the impacts of exogenous income injections (like tourist spending) through local economies, creating many indirect income effects (Taylor and Adelman, Reference Taylor and Adelman1996). The study by Taylor et al. (Reference Taylor, Yúnez-Naude, Dyer, Ardila and Stewart2003) demonstrated that the indirect effects contribute significantly to the direct effects of tourist spending on income growth, resulting in significant multipliers of tourist expenditures in the local economy. For example, even though Galapagos tourists rarely purchase vegetables from farmers or fish from fishermen, a 10 per cent increase in tourist spending (the addition of approximately 6,600 tourists in 1999) was predicted to result in increases of 3.9 per cent and 4.7 per cent, respectively, in incomes of agricultural and fishing households on the islands, as well as an increase in population, via migration, equivalent to 5.7 per cent of the existing island workforce.
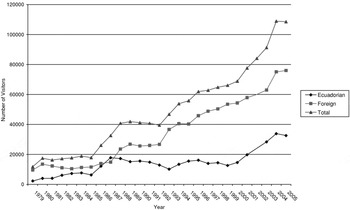
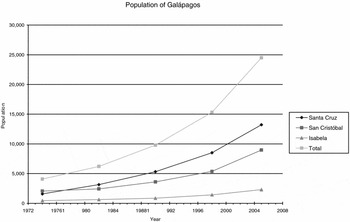
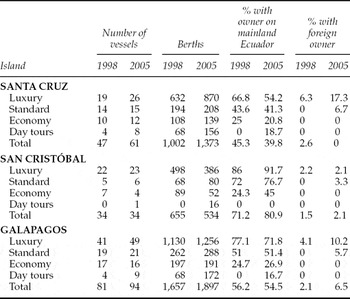
The period from 1999 through 2005 witnessed dramatic changes in the Galapagos economy, including a sharp increase in the number of visitors to the islands (from 66,071 in 1999 to 108,600 in 2005; figure 1); rapid demographic growth, through migration (the population of the archipelago increased from 15,311 in 1998 to an estimated 24,000 in 2005; see figure 2Footnote 1); a restructuring of the tourist sector in favor of larger cruise ships (table 1); and growth in the fishing sector, as reflected in an increase in the number of fishermen (from 795 to 993) and a doubling of the fishing fleet (to 446 vessels).Footnote 2 The demographic increase has occurred despite efforts by the Ecuadorian Government to control population on Galapagos, as called for in the Special Law.
Trends in the number of visitors to the Galapagos, 1979–2005 Source: Data obtained from Parque Nacional Galápagos, Sector de Turismo.

Demographic growth in the Galapagos, 1974–2005 Source: Data provided by Instituto Nacional de Estadística y Censos (INEC; www.inec.gov.ec).

Distribution of berths on cruise ships, by island, class, and owner

Sources: Data obtained from SPNG (1999, 2005) and CAPTURGAL (2005).
The present research updates the 1999 study to obtain estimates of total economic growth and the contribution of tourism to this growth between 1999 and 2005. The results reveal that tourism has been the primary driver of a rapidly growing economy, which was a magnet for new migrants from mainland Ecuador.Footnote 3 The high elasticity of migration to the islands, predicted by the 1999 model, limited the effect of total income growth on welfare as measured by per-capita income. As a result, despite major changes in environmental laws, the Galapagos Islands find themselves on a treadmill of income growth and immigration, resulting in new demographic pressure, an increased risk of exotic species introduction, and pressure on the islands' infrastructure for potable water, sewage, and waste disposal that are essential for the environmental protection of the islands. Our findings reinforce concerns raised by other researchers that economic pressures create migration incentives that conflict with the goals of the Special Law, with potentially significant environmental ramifications (for a detailed discussion see Kerr et al., Reference Kerr, Cardenas and Hendy2004).
Background and methodology
The Galapagos archipelago's historical isolation created its scientific and economic value today. No less than one-third of the species of flora and fauna found in the Galapagos are unique to the islands. The creation and maintenance of the islands’ fragile ecosystems depend on isolation; however, this imperative for isolation stands in contrast to the islands’ economic development model:
While the ecosystems are fragile because they depend on physical isolation, human societies multiply contacts, linkages, and exchanges . . . The contradiction only grows. (Ospina, Reference Ospina2006: 12)Footnote 4
The Islands are a focus of international conservation efforts, but in the 1990s they were the site of intense political conflicts between local residents, on one side, and conservation organizations and the central government, on the other. An alliance among the Ecuadorian government based in Quito, conservationists, and tourism enterprises resulted in the Plan Global de Manejo Turístico y Conservación de Galápagos (the General Plan for Tourism Management and Conservation in the Galapagos) in 1991 (Presidencia de la Republica, 1991). It became a catalyst for a local backlash against efforts by ‘outsiders’ to impose a development and conservation model on the islands. The result was the enactment of a compromise Ley Especial (Special Law) for Galapagos, creating significant local autonomy in managing economic development and conservation. This has made the Galapagos a laboratory for assessing the potential effectiveness of local-based economic development and conservation.
Drivers of economic growth in the Galapagos Islands
There are four key drivers of economic growth in the Galapagos, and the importance of each increased between 1999 and 2005. The economic drivers include:
Tourism A total of 108,600 people visited the Galapagos Islands in 2005, compared with 66,071 in 1999 (figure 1). The majority of these tourists, 76,000, were foreign. Increases in tourism directly stimulate growth in the tourism sector, which includes hotels, restaurants and bars, day-tour operations, cruise ships, boutiques and souvenir shops, dive shops, and other businesses that sell goods and services to tourists. Each of these businesses purchases inputs, pays salaries, and generates profits, which in turn enter the household economies of the three islands. Off-island purchases by businesses and to a smaller extent households are a leakage, shifting growth effects of Galapagos tourism to mainland Ecuador. Nevertheless, households spend most of their income locally, creating additional rounds of income growth on the islands.
The organization of the tourist sector in the Galapagos is evolving towards having a greater emphasis on tourist packages purchased abroad and oriented towards cruise ships and recreational activities, particularly diving. In addition, returning to the islands in 2005, one immediately notes the construction of newer and more luxurious hotels and a bipolar restructuring of the cruise ship sector around large ships (of 100 or more berths) and yachts, with eight to 16 berths, including luxury ships. With few exceptions, cruise ships are based on the islands. However, as the Galapagos cruise ship sector becomes increasingly capitalized, a growing share of berths is owned by outside investors. As a result, a larger share of profits in this sector left the islands in 2005 than in 1999.Footnote 5
Fishing Due to the archipelago's rich marine environment, fishing has been an important activity since the Galapagos Islands were first settled. Concerns that fishing constitutes a risk to conservation on the islands, together with what appears to be a growing population dependent on fishing (including many of the islands’ poorest families), have created an atmosphere of discord between fishermen, on one side, and tourism and conservation interests, on the other. At the start of our study period in 1999, the extraction of sea cucumbers was illegal, but contraband harvesting of this species was common. Highly publicized conflicts erupted over demands by fishermen to open up the sea cucumber fishery and access protected areas.Footnote 6 Sea cucumber extraction had been legalized by 2005, the year of our new study, and data on the quantity of sea cucumbers extracted in the Galapagos are available for 2005 (but not 1999). However, extraction has decreased sharply due to diminishing natural populations, and controversy over Galapagos fishing has shifted to contraband shark fin harvesting for Asian markets. In the midst of these debates, it is easy to lose sight of the fact that a major driver of fish production on the islands is endogenous: income growth creates a thriving demand for fish, and fishermen expand their activities to meet this demand. Island households spend an average of 3 to 5 per cent of their income on fish.Footnote 7
Conservation and research Scientific research and interest in conserving the islands’ unique ecosystem have stimulated another increasingly important activity on the islands. The work of scientists and conservation agencies is devoted to protecting the Galapagos environment, but it also injects millions of dollars each year into the Galapagos economy and is an increasingly important source of income growth. Most of this spending is done by the Galapagos National Park Service (GNPS) and foreign non-governmental organizations, whose logos are readily noted by visitors on the islands. Like tourism and fishing, expenditures on conservation and research have a multiplier effect on Galapagos incomes.
Government As population and tourism expand, so do public services funded, in part, by tourist entrance fees and economic growth on the islands. Government services are diverse, including public security, education, public works, water and sanitation, and the management of the Galapagos National Park. Multiplier effects of fiscal spending on income and employment are well known in the macroeconomics literature, dating back to the seminal work of Keynes (Reference Keynes1936). Keynesian multipliers operate on a local as well as on a national level.
All of these income sources – tourism, fishing, conservation and research, and government – are structural parts of the Galapagos economic system and are mutually dependent. Because of this, it is critical to adopt a systems approach when studying economic change and its components on the islands.
Ecotourism in an open demographic system
From an environmental point of view, the critical imperative facing the Galapagos, like other fragile ecosystems, is to limit competition between humans and other species. This includes creating economic incentives for the local population to conserve the resource base. The prevailing view among conservationists and researchers is that channeling the benefits of eco-tourism to local populations is a sina qua non for creating conservation incentives (e.g., see Wunder, Reference Wunder2000; Theophile, Reference Theophile1995; for an alternative view see Yu et al., Reference Yu, Hendrickson and Castillo1997). However, in an open demographic system confronted by a high elasticity of immigration, local income growth also creates incentives for demographic growth. Per-capita income in Galapagos depends on the migration response to total income growth.Footnote 8 If the migration response is sufficiently high, economic benefits from tourism may accrue to newcomers instead of to the local population, and the conservation incentives argument may break down. In fact, a high migration response may not only limit the flow of benefits to islanders but also reinforce an inequitable income distribution, which, in turn, may create disincentives for those at the bottom of the distribution to conserve.
A simple example illustrates this point. Imagine a hypothetical island economy with a population of 12 and an unequal income distribution such that two rich individuals have five units of income each, while the remaining ten individuals have one unit each. Total income, then, is 20 units, per-capita income is 1.67 (but the median is 1.0), and the Gini coefficient of income inequality is 0.33.
Now suppose that an increase in tourism doubles income on the island to 40, but new immigration to the island also doubles the number of low-income households (those with one unit of income), from ten to 20. It is easy to show that per-capita income increases slightly (by 11.5 per cent, to 1.82), the median is unchanged at 1.0, and the Gini coefficient increases by 22.7 per cent, to 0.41. Income from tourism is channeled to the island population, but the island population changes. Note that the increase in tourist income is a Pareto improvement for the island in a strict economic sense: the incomes of two households increase while the rest are unchanged. From the point of view of the country of which the island is part, the change is also positive in a Pareto sense, assuming that individuals would not migrate to the island unless the one unit of income they obtained by doing so was higher than the income they would have obtained at their place of origin. However, with income in most households unchanged, it is difficult to argue that channeling the economic benefits from tourism to the local population increases conservation incentives in this example. In fact, if relative deprivation negatively affects conservation incentives, it may even do the opposite.Footnote 9
Research methodology
In contrast to the concerted efforts by scientists, government and NGOs to monitor the Galapagos Islands’ ecology, there is no on-going attempt to monitor the Galapagos economy. How to estimate the effect of tourism on income in the Galapagos, given the complex market linkages connecting tourists, businesses, and households on the islands, was the focus of the 1999 study presented in Taylor et al. (Reference Taylor, Yúnez-Naude, Dyer, Ardila and Stewart2003). For that study, a social accounting matrix (SAM) was constructed from survey data for each of the populated islands of the archipelago (Santa Cruz, San Cristóbal, and Isabela). These island SAMs were nested within a larger SAM for the entire archipelago. The archipelago SAM was used to estimate tourist multipliers (Taylor and Yúnez-Naude, Reference Taylor and Yúnez-Naude1999) and as the data input for a Galapagos Islands computable general equilibrium model (Taylor et al., Reference Taylor, Yúnez-Naude, Dyer, Ardila and Stewart2003). The models were designed to capture both the direct and indirect effects of tourism on the island economies.Footnote 10
Injections of income into the economic system of the Galapagos by tourists directly raise the incomes of those who sell goods and services to tourists (cruise ships, hotels, restaurants, etc.). These direct impacts are easily estimated from surveys of tourist expenditures.Footnote 11 The SAM is a double-entry accounting system adhering to the identity that total expenditures equal total income for every actor in the economy. Because of this, in a SAM-based model, increases in income (e.g., of cruise ships and hotels) result in increased expenditures (e.g., on crew salaries, hotel staff, and other goods and services that are inputs into these businesses). This, in turn, raises the incomes and thus the expenditures of other agents in the economy (e.g., the households of crew and hotel staff). Off-island purchases of goods or services represent a leakage from the economy. However, if an important share of income is spent locally (as is the case in Galapagos), tourism can produce an income multiplier affecting agents throughout the economy, even those who do not sell to tourists. Taylor and Yúnez-Naude found that a $100 increase in spending by international tourists increased the gross island product by $28. This impact is nearly four times that estimated by De Miras (Reference de Miras1995). The difference is due to the income multiplier that results from linkages among production, factors, and households on the islands.Footnote 12
In general, income multipliers are good for economic development in low-income countries, particularly if they reach the poor. However, concerns arise when increased economic activity threatens the resource base, for example by raising the demand for environmental inputs and triggering demographic growth through migration. Understanding the direct and indirect environmental ramifications of tourism requires linking socio-economic and ecological models, which is beyond the scope of the present research. The first step towards doing this, however, is to quantify the determinants of economic growth on the islands, the focus of this article.
Updating the matrix
Quantifying tourism's contribution to economic growth in the Galapagos requires estimating the growth of tourism as well as of all other sectors of the island economy, most of which are intimately linked to tourism. The method we use to estimate economic growth and its determinants is based on updating the 1999 Galapagos Island SAM to 2005. The first step in doing this is to substitute new available data from 2005 into the 1999 SAM. The new data include:
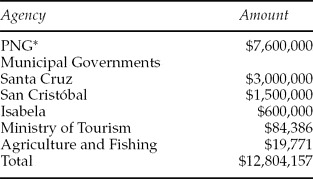
1. The 2005 budget for the Parque Nacional de Galápagos (Galapagos National Park, or PNG). The PNG budget increased from $4.5 to $7.6 million between 1999 and 2005 (table 2). This information was used to update total PNG spending in the SAM.
2. Budgets of municipal and provincial governments were used to update total spending by these government agencies (table 2).
3. A survey of 187 fishermen carried out in 2005 by Henderson et al. (Reference Henderson, Zurita and Hardner2005) provided information to update technology coefficients for fishing activities in the SAM.
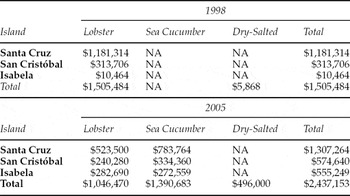
4. Data on total fish sales off island, by species, were used to update Galapagos fish exports to 2005 levels. Data on fish production to satisfy demand on the islands in 2005 are not available, but the rebalancing of the SAM produces an estimate of this production. The data show a notable shift in off-island sales between 1999 and 2005 (see table 3). Lobster sales decreased sharply (from $1.18 to $0.52 million), reflecting both over-exploitation of this species and an opening up of sea cucumber harvesting. In 2005, sea cucumber sales totaled just under $1.4 million, or 53 per cent of total legal off-island fish sales. The principal illegal fishing activity in 2005 was the harvesting of shark fins. Limited information on this activity is available for 2005. We use this information, below, to explore the sensitivity of our findings to assumptions about the magnitude of clandestine fishing activities.
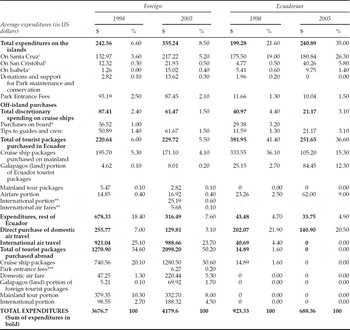
5. A new survey of 223 tourists in the Galapagos, which we carried out between October 2005 and February 2006, was used to update tourist spending and budget shares in the SAM. A comparison of tourist spending patterns between 1999 and 2005 appears in table 4. It reveals a shift in spending by both foreign and domestic tourists in favor of island-based activities. This almost certainly reflects strict quotas on cruise ship berths but not on island hotel construction. The table also shows a shift in foreign tourist expenditures in favor of tour packages purchased abroad (increasingly via the internet). Between 1999 and 2005, the part of the average tourist budget spent on packages abroad increased 65 per cent, from $1,271 to $2,098. There is also an increase in average total expenditures by foreign tourists, from $3,677 to $4,180.
6. A collection of 2005 data on the total number of tourists visiting the Galapagos (from the PNG) was used, together with total spending per tourist obtained from the tourist survey, to update total tourist expenditures. Between 1999 and 2005, estimated total expenditures by domestic and foreign tourists in the Galapagos increased by 92.9 per cent and 61.7 per cent, respectively.
7. New data on foreign and local ownership of cruise ship berths were used to adjust the share of profits leaving the islands from this sector.
8. The United Nations Development Program (UNDP) compiled a list of expenditures on conservation and research in the Galapagos from 1998 to 2005. It catalogued 63 projects funded by multiple private, multinational, and bilateral donors and international and local NGOs totaling $64.9 million. Of this amount 73 per cent was channeled through government agencies on the islands. Thus, to avoid double counting, we conservatively estimate non-governmental (primarily NGO) spending on conservation and research at $17.5 million over this seven-year period, or $2.5 million per year. The true level of conservation spending is likely to be higher than this.Footnote 13
Public expenditures in Galapagos, 2004–2005

Note: *Includes $380,000 to the Island Quarantine System.
Source: Budgets obtained from listed agencies.
Galapagos fish sales off island, 1998 and 2005*

Note: *Sea cucumber sales are not available for 1998, when extraction was illegal. Sales of dried-salted fish are available for Galapagos but not for each island. There is no reliable information on sales of shark fins or other illicit products. Fresh fish are produced for local consumption, not for export; thus, it is not included in this table.
Source: Hearn et al. (Reference Hearn, Murillo and Reyes2007).
Breakdown of average expenditures per Galapagos visitor, 1998 and 2005

Notes: †Trips on cruise ships, hotels, meals, souvenirs, etc., purchased on the islands.
*Not detailed in 2005 survey. **Not detailed in 1998 survey. ***The PNG entrance fee was not included in tourist packages in 1998.
Source: Original surveys of Galapagos visitors, 1998 and 2005.
The basic idea underlying our updating methodology is relatively simple. The 1999 SAM represents an economy in equilibrium in the sense that, for every production activity, factor, household group, and exogenous account, the sum of incomes from all sources (the row total in the SAM) is equal to the sum of expenditures (the corresponding column total). For example, fishing generates incomes and entails input costs (including salaries). The sum of input costs plus profits equals the total value of fish production. Similarly, for every household group, total expenditures equal total income.
Updating the SAM to reflect 2005 tourist expenditures, off-island fish sales, and government and conservation spending results in new injections of income into the economic system represented by the SAM. In the case of tourism, fishing, and government activities, it also entails updating SAM coefficients (e.g., tourist budget shares, fishing input–output coefficients, on- and off-island profit shares for tour operators, and the distribution of government expenditures across activities). This results in a disequilibrium, in the sense that total expenditures and incomes are no longer equal to each other for the endogenous actors in the economy (production activities, factors, and households). For example, the expansion of tourism increases tourist-sector incomes, salaries, and household incomes. Expenditures must adjust accordingly, and they, in turn, increase incomes and expenditures elsewhere in the system.
A RAS algorithm was used to rebalance the SAM in order to regain consistency; all endogenous sectors of the economy adjust to restore equilibrium in the system.Footnote 14 By comparing the new (2005) SAM to the old (1999) one, we obtain estimates of total income growth as well as its composition between 1999 and 2005.
The changes introduced into the SAM are largely exogenous. For example, tourist quotas and government expenditures are set by policy, conservation and research budgets are decided by NGOs, and the demand for fish exports lies outside the Galapagos economy. The resulting changes in income and its composition thus can be viewed as outcomes of the changes in these exogenous variables. This approach was designed to make efficient use of limited secondary data and small-scale targeted surveys to obtain estimates of economic growth and its components, where econometric estimation of the sources of economic growth is not possible.
It is important to keep in mind the limitations of this approach when interpreting the results presented below. The major limitation is the lack of new data on household expenditure patterns and on island businesses. Because of this, it is necessary to assume that household budget shares did not change significantly over the six-year period – that is, each group of households spent a given increase in income the same way in 2005 as it would have in 1999. We also have to assume that each production sector – e.g., agriculture, commerce, etc. – allocated its gross earnings in the same proportions in 2005 as in 1999. This is tantamount to assuming that production technologies did not change significantly between these two years. The exception is for fishing, inasmuch as new data on inputs were available from the Henderson et al. (Reference Henderson, Zurita and Hardner2005) survey to adjust input–output coefficients. Although these assumptions are restrictive, we see no alternative until new household and business surveys are conducted on the islands. Sensitivity tests of our findings with respect to changes in budget-share and input–output parameters are discussed below.
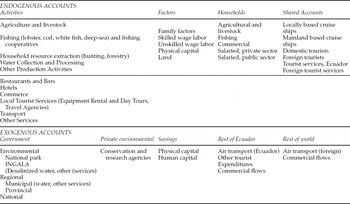
The accounts in the Galapagos SAMs are summarized in the appendix. The endogenous accounts include, for each of the three islands, 19 production activities, five factors, and five household groups. They also include six shared accounts. Exogenous accounts include government (federal, regional, and municipal), conservation agencies, and savings. Each island has three rest-of-world accounts: the rest of Galapagos (which is endogenous, because trade between islands depends on island incomes and expenditures), the rest of Ecuador, and the rest of the world outside Ecuador (these last two accounts are exogenous). When a foreign tourist enters the Galapagos economy, the cost of her trip is represented in the SAM as an injection of income from the rest of the world outside Ecuador into the tourist account (netting out international airfare, commissions, etc., that do not enter Ecuador). The foreign tourist column, in turn, allocates the tourist's expenditures to the different tourism activities.
Economic growth and its composition in the Galapagos, 1999–2005
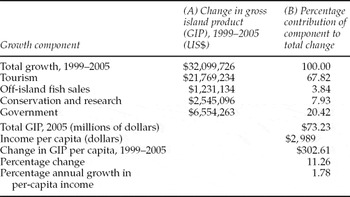
Our key findings are reported in table 5. The numbers in the table represent the estimated total economy-wide impacts of the exogenous changes and updated expenditure shares for 2005 that were introduced into the island SAMs. Column (A) reports the simulated change in total income that was attributable to changes in tourism, off-island fish sales, conservation and research, and government spending. Column (B) presents the percentage contribution of each of these four components to the total income change.
Income growth and its decomposition in the Galapagos, 1999 to 2005

Total and per-capita income growth
The results indicate that the Galapagos Islands had one of the fastest-growing economies in the world between 1999 and 2005. Our conservative estimates, based on changes in tourism, fishing, and government and conservation expenditures, indicate that total income in the archipelago increased by US$32.1 million in nominal terms (78 per cent, from a base of $41.1 million) over this six-year period. This represented an average annual growth rate of 9.6 per cent (see table 5, column (A)).
Despite this striking increase in total income, per-capita income increased at a rate of only 1.8 per cent annually. The relatively small contribution of income growth to average living standards on the islands was due to a highly elastic migration response. As illustrated in figure 2, the number of island inhabitants rose 60 per cent over this period. Taylor et al. (Reference Taylor, Yúnez-Naude, Dyer, Ardila and Stewart2003) modeled the link between island income growth and migration. Their findings, based on a CGE model, imply an elasticity of migration with respect to total income of approximately 1.0. The findings presented here suggest that the migration elasticity remained high during 1999–2005: population increased by 60 per cent, while nominal income rose by 78 per cent, implying an elasticity similar to the previous estimate.Footnote 15 If the Galapagos had had the same total income growth without migration, income per capita in 2005 would have been $4,783 instead of $2,989. This hypothetical scenario is not realistic, however, because population growth on the islands contributed not only to labor supply but also to the demand for goods and services. In real terms, i.e. adjusting for inflation, it is likely that per-capita income on the islands decreased.Footnote 16 The 2005 per capita income for Ecuador was $2,620 (World Bank, 2006). Thus, it appears that new migration significantly closed the gap between island and mainland per-capita incomes.
The components of economic expansion in the Galapagos
Tourism is the main motor driving economic growth in the Galapagos. Increases in expenditures by international and domestic tourists accounted for 68 per cent of the increase in total income in the archipelago between 1999 and 2005 (table 5, third column). Besides stimulating income on the islands, Galapagos tourism generated income for the rest of Ecuador, via the island's demand for goods and services from the mainland.Footnote 17
The three other drivers of growth in the islands were government, conservation, and fishing. Of income growth, 20.4 per cent is attributable to increases in government spending. Another 7.9 per cent is explained by spending on conservation, primarily by foreign non-government organizations (NGOs) and bilateral and multilateral aid programs. Just under 4 per cent can be attributed to sales of fish (principally sea cucumbers) off island. Between 1999 and 2005, a sharp increase in sales of sea cucumbers easily offset the effect of a decrease in lobster sales, resulting in an increase in total off-island fish sales of $932,000. The contribution of this increase in fish sales to Galapagos income was $1.2 million (see table 5). This contribution is greater than the increase in fish sales because of the income multiplier created by the injection of new fishing revenue into the Galapagos economy.
Despite a restructuring of the cruise ship and hotel sectors, the multiplier effect of tourist expenditures on economic growth and incomes did not change appreciably between 1999 and 2005. The majority of foreign tourists purchased tour packages abroad. Nevertheless, demand linkages within the Galapagos economy continued to generate a multiplier effect on income and employment on the islands. Even when tourists do not spend money in island businesses, tourist expenditures have a large effect on the local economy. Taking linkages into account, each foreign tourist generated $1,150 in new income for island residents in 2005.
Calculations using the updated SAM indicate that total income in the Galapagos would have been $21.8 million, or 29 per cent, lower in 2005 if the number of foreign and domestic tourists had not changed from their 1999 levels. Considering that immigration effectively broke the link between total and per-capita income growth, it is not unreasonable to conclude that every three additional tourists per year brought one new immigrant to the islands during this period.Footnote 18
A comparison of income multipliers
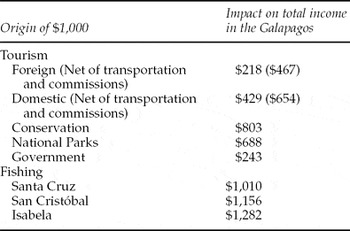
The impacts of tourist expenditures, fish sales, conservation spending, and government on income growth depend on the size of changes in these income injections as well as on the multipliers that these injections create within the island economy. Income multipliers resulting from a $1,000 increase in each of these exogenous income sources are presented in table 6.Footnote 19
Estimated effect of a $1,000 income injection into the Galapagos economy, by source

A $1,000 increase in foreign tourist expenditures raises island income by $218. The international tourist multiplier is the lowest of all multipliers in the table, because foreign tourists spend most of their budgets off the islands, limiting their direct impact. Nevertheless, it is evident that the indirect effects of tourism exceed the direct effects. Despite the fact that only 8 cents out of every foreign tourist dollar are spent on the islands (table 4), total income increases by 21.8 cents. The dominant effect of this type of tourism on economic growth, despite its relatively low multiplier, is due to the large magnitude of foreign tourist expenditures compared with other income sources. The effect of a $1,000 increase in domestic tourist spending is larger, because domestic tourists spend a higher percentage of their budgets on the island. Each $1,000 of domestic tourist expenditure is associated with a $429 increase in island total income. Nevertheless, because total spending by domestic tourists is relatively small, its effect on economic growth is also small compared with international tourism.
Tourism multipliers (though not the overall contributions of tourism to income growth) are higher if we net out airfares, travel agent commissions, and spending en route to and from the islands. Although these represent a major share of the cost of visiting the Galapagos, they are incurred entirely outside the island economy. Netting out these items makes the tourism multiplier more comparable to multipliers produced by other types of expenditures that do not have such large off-island components. The estimated effect of $1,000 of tourist expenditures net of these costs is $467 for international tourism and $654 for domestic tourism.
Conservation expenditures and off-island fish sales produce larger income multipliers. A $1,000 increase in spending by research and conservation agencies raises island income by $803. The largest multiplier is for fishing. This is because, when fish sales increase, income in fishing households increases by nearly the same amount (minus the cost of variable inputs, including fuel and labor). Higher fishing-household income, in turn, stimulates growth elsewhere in the economic system as a result of the demand linkages emanating from fishing households. A $1,000 increase in off-island fish sales raises total income in the Galapagos by $1,010 if the fisherman lives on Santa Cruz, $1,156 if on San Cristóbal, and $1,282 if on the more remote island of Isabela. Despite the size of these multipliers, off-island fish sales account for only 4 per cent of the total income growth in the Galapagos, because the increase in gross value of these sales is small compared with other income sources, especially tourism. Significant international attention has focused on off-island sales of sea cucumbers and (illicit sales) of shark fins. Nevertheless, much of the growth in fishing is driven by the endogenous demand for fish on the islands, which in turn depends on income generated by tourism and other activities.
A $1,000 increase in spending by municipal and provincial governments raises income on the islands by $243. Government spending (not including the National Park Service), particularly on public works projects, has significant leakages associated with the off-island purchase of building materials, consulting services, etc. These leakages limit the multiplier effects of spending on the islands. Nevertheless, significant growth in public spending made government second only to tourism in terms of its contribution to Galapagos income growth.
The largest source of public spending on research and conservation is by the Galapagos National Park Service. It entails smaller leakages than other types of government spending and has a large salary component (including for NPS guides). As a result, a $1,000 increase in GNPS spending contributes $688 to island total income.
Sensitivity analysis
The lack of data from new surveys of households and businesses (except for fishing) raises some concerns about the estimates presented above. The most important concerns have to do with possible changes in spending patterns by households and in production technologies by Galapagos businesses between 1999 and 2005. Sensitivity analysis with respect to these parameters finds marginal changes in estimated multipliers and growth estimates, but in no case do our findings change in a meaningful way. The results presented above are robust to all but unrealistically large changes in SAM coefficients.
A second limitation of this study is the lack of reliable information on illegal fishing, currently dominated by the harvest and sale of shark fins for Asian markets. Thirty per cent of boat owners interviewed by Viteri and Chávez (Reference Viteri and Chavez2004) acknowledged ‘capturing shark, rarely fulfilling regulations or having made some infraction’ of fishing laws. Henderson et al. (Reference Henderson, Zurita and Hardner2005), based on their 2005 survey of fishermen, concluded that 34 per cent of Galapagos fishermen participated in ‘shark finning’, earning an average of $4,000 annually from this activity. The reliability of these numbers is likely to be tainted by fishermen's reluctance to reveal their participation in this illicit activity.
We tested the sensitivity of the conclusions presented above to alternative assumptions regarding the intensity of illegal fishing. The most extreme scenario assumes that every one of the 993 fishermen in the Galapagos sold $4,000 of shark fins in 2005. Under this obviously unrealistic scenario, total income on the islands increases by $38 million between 1999 and 2005, instead of $32.1 million as reported in table 5, and off-island sales of fish explain 17 per cent of total income growth on the islands, compared with 53 per cent for tourism. In short, under any reasonable assumptions concerning contraband marine extraction, tourism remains far and away the most important driver of economic growth in the archipelago.
A final concern is related to the increasing use of temporary workers from the mainland in some tourist activities. Salaries paid to temporary workers whose families live (and spend their income) on the mainland represent a leakage rather than a stimulus to growth on the islands. That is, the use of temporary workers shifts part of the island multiplier to the mainland. Based on a survey of cruise ship tour operators, Hardner and Gomez (Reference Hardner and Gomez2004) found that temporary workers who did not live on the islands represented as much as 40 per cent of the skilled workforce (with secondary schooling or higher) and 25 per cent of the less-skilled workforce of tourist operations in 2005. Lacking surveys of temporary workers, it is not known how much of this group's income is spent on the islands or on board the cruise ships.
We explored the sensitivity of our findings to the presence of temporary workers by removing 40 per cent of all salaries paid to skilled workers and 25 per cent paid to unskilled workers by the cruise ship sector. The tourism multipliers decrease, but the conclusions presented above do not change. Netting out all salaries paid to temporary workers in the cruise ship sector, the estimated increase in Galapagos total income between 1999 and 2005 drops from $32.1 million to $31.1 million. The change in per-capita income is $266 instead of $303, and the average annual growth rate of per-capita income is 1.6 per cent instead of 1.8 per cent.
In short, our sensitivity analysis suggests that the finding that tourism stimulated rapid economic growth in the Galapagos is robust with respect to changes in these difficult-to-measure variables.Footnote 20
Conclusions
The findings from our economy-wide analysis indicate that the Galapagos Islands experienced an economic boom between 1999 and 2005. Total income increased by an estimated 78 per cent, or 9.6 per cent annually, placing the archipelago among the fastest-growing economies in the world.Footnote 21 However, this rapid income growth did not significantly improve living standards on the islands. Per-capita income increased only 1.8 per cent annually due to migration-induced population growth. In real terms, income per capita almost certainly declined. Tourism continued to be the principal contributor to economic growth, explaining 68 per cent of the increase in gross island product over this period. The majority of tourism's effects are indirect, the result of complex linkages within the island economy. Fish sales off island, a focus of international and local attention, explained only a small part of total economic growth. Nevertheless, economic growth on the islands created a rising demand for fish and stimulated fish production to meet local demand. Fishing is a source of income for an important group of households on the islands, including a disproportionate number of poor islanders.
Independent of the source or its magnitude, the injection of new money into the Galapagos economic system stimulates economic growth. Given a high migration elasticity, every increase of $3,000 in total nominal income on the islands resulted in the addition of approximately one additional person to the island population, via migration from mainland Ecuador, between 1999 and 2005. This high migration response significantly closed the gap between island and mainland per-capita incomes.
Our simulation results are strikingly similar to those of the hypothetical example of tourism and immigration presented in section 2 of this paper. In both cases, total income and population nearly double while per-capita income increases by only 11 per cent. Lacking new household survey data, the distributional impacts of recent island development cannot be ascertained. However, anecdotal and ethnographic evidence suggest that they, too, are increasing, as in our example.
These findings raise questions concerning the compatibility of local income growth with conservation goals in the Galapagos. They suggest that government and donor policies for the Galapagos (and other sensitive conservation areas) should be re-evaluated. Kerr et al. (Reference Kerr, Cardenas and Hendy2004) suggest a number of possible reforms to increase the effectiveness of the Special Law for the Galapagos while raising more fundamental concerns about conflicts between economic development and the potential to enforce the Law. Our findings confirm those concerns. They highlight the need for regulating tourism, economic growth, and migration. The experience of Ecuador and countries around the world reveal the difficulty of regulating migration, whether internal or international. Without question, tourism is the key driver of economic growth and migration in the Galapagos. The Special Law includes provisions to regulate the level of tourism, but more serious enforcement is needed. Price mechanisms could also potentially be used to limit tourism. Visitors to the archipelago currently pay an entry fee of $100. Without careful willingness-to-pay studies, it is not clear how much this fee would have to increase in order to discourage visitors, or whether a high fee would make the islands accessible only to the elite, to the detriment of educators, students, and researchers. While new regulation and enforcement clearly are warranted, further study is needed to design the appropriate regulatory mechanisms.
Our findings also highlight the importance of taking an economy-wide perspective when thinking about the likely consequences of new injections of income into the economies of fragile ecological zones. In the Galapagos, any injection of new income creates a stimulus for demographic as well as economic growth. Efforts to restrict population growth have failed to overcome the powerful economic stimulus for immigration from the mainland. Immigration, in turn, has diminished the effect of economic growth on household income, creating political pressure to find even more economic development options for Galapagos residents, including commercial fishing. It is not clear whether per-capita income growth is good for the environment, as commonly assumed among environmental NGOs in the Galapagos. Nevertheless, a vicious circle of rapid economic growth and unbridled population growth most certainly is not.Footnote 22 Our analysis highlights the importance of gathering socio-economic as well as biological data on the islands and the need for research linking economic with environmental outcomes.
Accounts in Galapagos economy-wide model