

1. Introduction
When did globalisation begin? There have been many different answers to this question – ranging from a couple of decades to several thousand years ago. Many have thought of the conquest of the Americas as a starting point, thus dating the start of globalisation at the beginning of the sixteenth century (or even more precisely to the year of 1492).Footnote 1 Two renowned scholars, Kevin O'Rourke and Jeffrey Williamson, have succinctly argued that we ought to consider the 1820s as the starting point of a first wave of globalisation. The authors claim this, since they find no evidence of price convergence in long-distance trade prior to this time.Footnote 2
In this article, I am going to test this argument empirically. The question that this article seeks to answer is therefore: is there any evidence of price convergence prior to the 1820s in the intercontinental commodity trade?
I use empirical data on prices for 11 commodities important in the early modern world trade to test the hypothesis. The commodities included are sugar, slaves, cacao, tobacco, rum, tea, Asian textiles, European broadcloth, cloves, coffee and pepper. These commodities represent a very large share of total long-distance trade during the early modern period. Patrick O'Brien has in a recent article computed the commodity composition of ‘third world’ exports between 1830 and 1937. By 1830, sugar alone was the single most important commodity traded, and responsible for approximately 25 per cent of the total value of ‘third world’ exports. The two second largest categories of products – textile fibres on the one hand, and coffee, tea, cacao and spices on the other – at the same time each accounted for approximately 15 per cent of the value of the exports, respectively.Footnote 3
The price data suggest that there are secular trends of price convergence taking place already by the late seventeenth or early eighteenth century. Despite many external factors thwarting market integration time and again, prices converge for many of the commodities included in this study, and they do so for quite long periods of time. The main conclusion of the article is therefore that the issue of an ‘early globalisation’ can not be dismissed as easily as has often been done so far.
2. Previous studies
2.1. Definition of globalisation
To quite a large extent, the debate on when globalisation began is a debate over the definition of globalisation. Many authors do not, however, provide clear definitions of what they mean by the concept. In their book Globalization and History, along with a range of articles, authors Kevin O'Rourke and Jeffrey Williamson have put forward a very clear definition of what they mean by globalisation. Globalisation of world trade, they argue, should be defined as synonymous with integration of international commodity markets. Furthermore, they claim that ‘the only irrefutable evidence that globalisation is taking place is a decline in the international dispersion of commodity prices or what might be called commodity price convergence’.Footnote 4
This definition has received some criticism by other scholars, such as Flynn and Giraldez or Joseph Inikori.Footnote 5 Karl Gunnar Persson, among others, has also argued that price convergence isn't a sufficient criterion of market integration, since convergence is a transitory event. Persson, as well as David Jacks and Victoria Bateman, have therefore used both price convergence and price adjustment as measures of market integration.Footnote 6
Even if we accept the definition of globalisation as synonymous with price convergence, the opposite does not follow automatically – i.e. evidence of price convergence taking place in any particular instance does not necessarily give us proof of globalisation. We might, for example, want to require that such convergence have an effect upon a significant share of world trade, that the effects are quite simultaneous in time, and/or that any convergence taking place is large enough to have a significant effect upon the economies of the countries participating in the trade.
Focusing upon the definition of globalisation would be beyond the scope of this article. Rather, the focus will be upon the issue of global price convergence – an issue that is important in and of itself, regardless of whether we believe it to be synonymous with globalisation, or just one possible aspect of globalisation.
2.2. Previous evidence on early modern price-dispersion
The book and articles by O'Rourke and Williamson have become highly influential in the discussion on historical globalisation. The two authors support their argument against an early globalisation by referring to the trade in several non-competing commodities, such as sugar, spices and textiles. The evidence they cite is quite diverse, depending on what trade route they study. In the transatlantic commodity trade, the only kind of evidence cited is calculations of the seaborne freight rates. They thus do not present any evidence at all regarding price convergence per se in the transatlantic trade, but only this one part of the price wedge.Footnote 7 In the trade between Europe and Asia, on the other hand, O'Rourke and Williamson use price data to support their argument for a set of different commodities – mainly different spices and textiles. In most cases, the data cover the trade between Great Britain and Asia during the period 1660–1710. Two figures also include prices over a longer period. From these data, they conclude that there seems to be no evidence in favour of price convergence.Footnote 8
Dennis Flynn and Arturo Giraldez have for their part argued that there is strong evidence of price convergence on the international silver market twice prior to the nineteenth century. This issue is avoided by O'Rourke and Williamson, since they are only interested in non-monetary commodity trade. This is a mistake, Flynn and Giraldez argue, since monetary commodity and non-monetary commodity exchange was intimately intertwined at the global level.Footnote 9
Many other studies have focused upon integration on the intra-European market. David Jacks has, for example, studied market integration in the Baltic and North Sea region, during the period 1500–1800. He finds that the markets did become more integrated during this period in this region.Footnote 10 Christiaan van Bochove comes to a similar conclusion in his study on market integration in the North Sea trade during the period 1600–1800.Footnote 11 Özmucur and Pamuk have investigated whether commodity prices in long-distance intra-European trade converged during the same period that David Jacks studied. They use price data from a set of different countries/cities in Europe, and for a few commodities such as wheat, olive oil and soap. In some of the cases, they find evidence of price convergence during the period, but in most of the cases the statistical tests they use show no significant evidence of convergence of prices for the whole of the period.Footnote 12 Victoria Bateman has studied grain prices in continental Europe, and finds no evidence of price convergence during the period of her study, 1350–1800.Footnote 13 Giovanni Federico has recently studied the European grain markets during the period 1760–1860, finding that prices of grain diverged significantly in Europe during the late eighteenth and early nineteenth centuries.Footnote 14
Previous studies have thus found evidence of market integration regionally at least in some parts of Europe during the early modern era. At a global level, however, previous studies have found no evidence of market integration.
3. Methods
The earlier studies referred to above raise three important methodological issues: how long is a long-term trend, how do we deal with external shocks to the market, and how do we properly measure price convergence? This section will try to deal with these three issues.
3.1. How long is a long-term trend?
The first issue to be discussed is: how long time must a trend last in order to classify as price convergence (and not only a temporary fluctuation)? Few authors discuss the issue explicitly. Let us therefore take a look at how some scholars in practice deal with the issue. Özmucur and Pamuk look for a trend of price convergence during the whole of a period of 300 years, apparently without testing if there are different trends during different parts of this very long period.Footnote 15 In a similar manner, Bateman looks for a single trend of convergence during the whole of her period of study, 1350–1800.Footnote 16 In the articles on early modern trade, O'Rourke and Williamson disqualify tendencies of price convergence seemingly just because the trends do not last the whole period for which they have data, which in some cases cover as long a period as 320 years.Footnote 17 In their book Globalization and History, on the other hand, the same authors base their conclusions on the trends of price convergence that are quite short: sometimes as short as 20 years (the figures reported normally cover 40–50 years of data in total).Footnote 18 Van Bochove looks at convergence during different periods, each covering 100 years.Footnote 19
We ought not to expect secular trends to be more long-lasting during the early modern era than during modern times. In this article, a secular trend is taken to mean that a converging price trend must be sustained for a period of 50 years or more in order to qualify. And as Karl Gunnar Persson has pointed out, convergence might be a transitory event. What is important is therefore that the convergence is sustained (i.e. not cancelled out by a new trend of divergence) for a period of time, even if the transition as such is swifter in some cases.
3.2. How do we deal with external shocks to the markets?
A second issue is how we deal with the impact of major external shocks to the markets, such as the French Revolutionary and Napoleonic Wars or World War I. Many scholars do not discuss the issue explicitly, but in practice begin their period of study after and/or end it before such major international conflicts. O'Rourke and Williamson acknowledge that the market for coffee showed signs of price convergence between the 1730s and the 1780s, but they go on to say that ‘everything gained was lost during the French Wars’.Footnote 20 In their book, the same authors let their period of data end abruptly at 1913, just before the outbreak of World War I, without discussing the issue explicitly. In their article on market integration between 1500 and 2000, Findlay and O'Rourke also make a break at the start of World War I, arguing: ‘1914 clearly marked a dramatic and discontinuous break with the past’.Footnote 21
In a recent article Kevin O'Rourke discusses the possibility that there actually was a potential for global market integration already prior to the nineteenth century, but that this potential was constantly frustrated by mercantilist policies and wars. In the article, O'Rourke has documented the most considerable effects the French Revolutionary and Napoleonic Wars had, not only upon the European nations but also worldwide.Footnote 22 In the words of O'Rourke: ‘The years between 1793 and 1815 saw an unusually bloody, lengthy and widespread conflict between Great Britain and France, which widened to include many of the other leading powers of the day.’Footnote 23
In this article, the French Revolutionary and Napoleonic Wars will be treated in a manner similar to how other scholars have treated World War I, i.e. it is considered as a discontinuous break with the past. This means that divergence of prices during this period will not automatically disqualify evidence of price convergence prior to it.
3.3. Measuring price convergence
Thirdly, it is not self-evident how we are to measure price convergence statistically, i.e. what measure of dispersion we are to use. The choice of statistical measure depends on what we want to analyse with the data. The point of measuring globalisation using data on price dispersion should be that this is an easy way to measure the size of the price wedge between different markets (instead of having to collect data for, and add together all the significant components of, the price wedge).
The measure of mark-up ratio between the purchasing and selling market, i.e. the selling price divided by the purchasing price is one possible measure, and is used for example by O'Rourke and Williamson.Footnote 24 The mark-up ratio is an easy and quite powerful illustration of how large a percentage is added to the price in the selling market, compared to the purchasing market – that is, how large the price wedge is relative to the price in the selling market. A possible drawback with this measure is that it limits us to measuring the price wedge between two different markets only. Furthermore, the mark-up ratio will also give a large weight to changes in the price in the purchasing market (the denominator in the equation), so that a quite small absolute change in the price in the selling market can translate into a rather big change in the mark-up ratio.
Another common measure is the coefficient of variation, i.e. the standard deviation of prices divided by the mean price. This is used, for example, by David Jacks, Giovanni Federico and Özmucur and Pamuk to test for price convergence.Footnote 25 This measure will show us the size of the price wedge, relative to the mean price between the markets. The coefficient of variation can, in contrast to the mark-up ratio, measure convergence taking place across many different markets at the same time, allowing the measurement of convergence among various markets. If we only have data from two markets, one exporting and one importing, the coefficient of variation and the mark-up ratio will yield essentially the same results if we are interested in their change over time.
A third measure of dispersion – the standard deviation – could also tell us something important. According to Feinstein and Thomas, this is a most useful and widely used measure of dispersion in historical statistics.Footnote 26 The standard deviation of the prices will tell us if there is an absolute convergence of prices (i.e. an absolute decrease in the size of the price wedge), in contrast to the mark-up ratio or the coefficient of variation showing convergence relative to the purchasing or mean price. In the literature on economic convergence, the standard deviation has been used to some degree. Dalgaard and Vastrup have, however, shown (in the context of convergence of global income per capita) that using the standard deviation or using the coefficient of variation will yield markedly different results. In their case, convergence is confirmed or refuted solely depending on the measure used.Footnote 27
In the case of price convergence, there are two reasons as to why the measure of standard deviation ought to be taken into consideration, one theoretical/statistical and the other historical. The first reason concerns a shortcoming with the coefficient of variation. Changes in supply or demand in either the exporting or the importing region will, assuming ceteris paribus, lead to changes in the equilibrium price. This will in turn have an effect upon the coefficient of variation between the markets. A positive demand shock – driving the equilibrium price upwards – could thus, for example, be interpreted as ‘globalisation’, if we use the coefficient of variation as the only measure, even if the costs of trade remain unchanged. If we want to use price convergence as a measure of ‘globalisation’, the coefficient of variation can therefore be misleading under certain, not uncommon, conditions.
There is also a second, historical, reason why the choice of statistical measure is important. If the price wedge is calculated as percentage mark-ups added on to the price in the purchasing market, the most important measure ought to be the mark-up ratio or the coefficient of variation. The profit of the merchants might, for example, have been calculated this way, and ad valorem tariffs obviously were as well. If, on the other hand, the price wedge is calculated as the price in the purchasing market, with different absolute costs added on to the purchasing price, the standard deviation of prices might be more adequate. During the early modern era, the absolute size of the price wedge seems to be quite important for some of the more important components of the mark-up in prices. Freight rates were, for example, determined not by the price or value of the commodities traded, but mainly by the volume of the goods. Furthermore, tariffs during this period were often specific (per weight or volume), rather than ad valorem tariffs. Such transaction costs will thus not necessarily change due to a changing price in the selling market of a commodity.
Using the standard deviation as a measurement does also have drawbacks. The example with a demand shock noted above assumes ceteris paribus. In actual fact, however, the ceteris paribus condition hardly ever holds. A potentially serious problem is that an absolute convergence of prices in a time series simply reflects a generally falling price level, including the price of transport. In order to control for this, we are going to deflate the standard deviation. We can furthermore only compare the convergence between different commodities' markets if the data on standard deviations are put relative to some benchmark year, since the standard deviation otherwise will be measured in the same units as the prices on the individual markets.
In essence, are we interested in finding out about the absolute size of price wedge, or the size of the price wedge relative to the mean or purchasing price? This article argues that we should care about both aspects. Both the standard deviation and the coefficient of variation are interesting to analyse, if we are interested in using price dispersion to talk about globalisation, since they show us slightly different aspects of the issue of market integration.Footnote 28
4. Data on price-dispersion in the intercontinental commodity trade
4.1. Available price data
So far, price data for identical commodities from different regions across the globe are pretty scarce prior to the nineteenth century. This author has been able to find comparable, long-term data assembled by other scholars on eleven commodities. Five of these commodities were traded across the Atlantic: sugar, tobacco, cacao, rum and slaves. Of these, sugar is by far the most important eastbound commodity in the Atlantic economy – accounting for approximately 50 per cent of the value of the European imports from the Americas.Footnote 29 Tobacco was also one of the most important commodities in the transatlantic trade. Slaves were, on the other hand, probably the most important westbound export across the Atlantic during the early modern era. The two other commodities, cacao and rum, are less important in the transatlantic trade, but are included to diversify the picture. In the trade between Europe and Asia, this author returns to the data used by O'Rourke and Williamson for the trade in textiles, cloves, coffee and pepper.Footnote 30 This is supplemented by other data on the price of broadcloth and tea in Europe and Asia.Footnote 31
The prices are in general converted into a comparable currency by the scholars collecting the data – either into silver price (in the case of sugar and tea) or converted into pound sterling or Spanish dollars using exchange rate data (in the case of slaves, textiles, rum, cloves, pepper and coffee). In two cases (tobacco and cacao), the current author has converted the local prices into silver prices. Descriptions of the source and quality of the data for all 11 commodities are included in the appendix to this article.
As mentioned in section 3, we want to deflate the data on standard deviation. Unfortunately, aggregate price indices are so far only available from a few countries in Europe. Instead, this author has opted for using the price of cereals as a proxy for the general price level, to deflate the standard deviation by. This seems to be an acceptable proxy, since important staples such as cereals will to a large extent determine the general price level over the long run.Footnote 32
4.2. The example of sugar
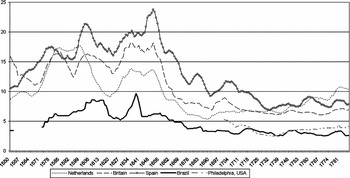
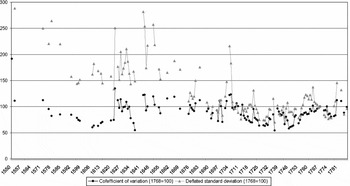
One commodity – sugar – is chosen to illustrate the data (Figure 1), and how these price data are reflected in the two different measurements of dispersion (Figure 2).
The price of sugar in the Atlantic, 1550–1787 (g silver/kg sugar, nine-year moving average nominal price)
Source: see Appendix A1.

Dispersion of the price of sugar in the Atlantic (Brazil–Europe), 1550–1787 (annual price data)
Source: see Appendix A1.

Figure 1 shows the (undeflated) price of sugar in a couple of regions around the Atlantic, in the form of nine-year moving average prices. During the late sixteenth century, prices of sugar were in general rising on both sides of the Atlantic. This seems to be a part of a general price increase – the price of sugar fell relative to the price of cereals. The price of sugar in Europe seems to be a driving force behind price changes in Brazil – some time after the price increased in Europe, the price of sugar in Brazil also increased. During the middle of the seventeenth century, however, the absolute size of the price gap decreased as the absolute prices in Europe fell quite significantly – an effect that was sustained throughout a long period of the eighteenth century.
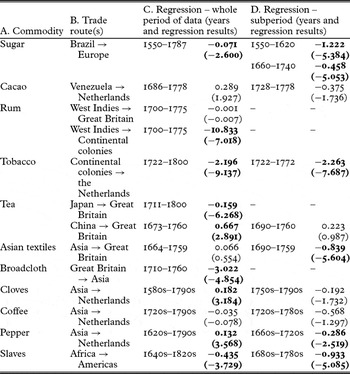
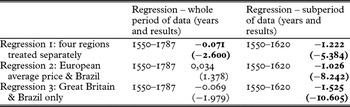
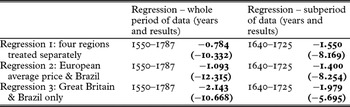
Figure 2 shows the dispersion of prices of sugar in Brazil and three countries in Europe (Great Britain, the Netherlands and Spain), both in the form of coefficient of variation and the (deflated) standard deviation. The evidence indicates that there was a slow convergence of prices (if measured by the coefficient of variation) taking place during the period 1550s to 1610s, when prices of sugar were increasing in Brazil as well as in Europe. A regression of this subperiod shows the trend to be negative and statistically significant. There is also a second period of statistically significant convergence, starting around the 1660s, continuing until the 1730s (see Table 1). A regression furthermore shows a negative (and statistically significant) trend for the whole period for which we have data, but the coefficient is so small that this trend is negligible in practice. A single year also has a major effect upon the results in this case; removing this outlier, the regression in this case shows no statistically significant results.
Relative (coefficient of variation) dispersion of prices

Sources: see Appendix.
Note: t-statistics in parenthesis. Statistically significant results are in bold. The regressions for slaves, cloves, coffee and pepper are all based on average price data per decade, since these are the only price data reported in the sources used in this article. In all other cases, the regressions are based on annual price data.
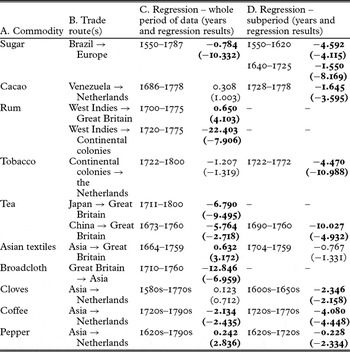
The price wedge is furthermore decreasing significantly if measured by the deflated standard deviation of prices (see Table 2). The regression analysis shows that the trend is negative (and significant) for the whole period for which we have data. Specific subperiods experience even more pronounced convergence of prices: the deflated standard deviation of the prices thus decreases rapidly from the 1550s until the early seventeenth century. After a brief period of increasing price dispersion, the prices in Brazil and Europe again converge rapidly from the 1640s, a process that continues at least until the 1720s.
Absolute (deflated standard deviation) dispersion of prices

Sources: see Appendix.
Note: t-statistics in parenthesis. Statistically significant results are in bold. The regressions for cloves, coffee and pepper are all based on average price data per decade, since these are the only price data reported in the sources used in this article. In all other cases, the regressions are based on annual price data.
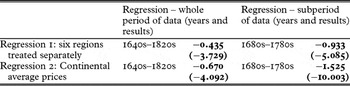
Robustness checks have been undertaken both in the form of computing a European continental average price of sugar (so as to make sure that the evidence of convergence is not due just to a convergence of prices on the same continent, but primarily in the intercontinental trade), and in the form of computing the dispersion solely between Brazil and Great Britain. The results show that neither of these checks affects the results significantly.Footnote 33
4.3. Summary of results
Tables 1 and 2 summarize the results of regression analyses for all 11 commodities studied in this article. The trend for the price data is analysed both for the whole period for which we have data (columns C in both tables), and for shorter subperiods during which convergence might be taking place in each respective case (columns D in both tables). Subperiods are only analysed and included in the tables if they differ significantly from the overall trend for the whole period for which we have data – otherwise no data are entered in the table.
As can be seen in Table 1, the data suggest that convergence of prices is taking place, if measured by the coefficient of variation, for many of the most important commodities traded internationally at the time, such as American sugar and tobacco, Asian tea, British broadcloth exported to Asia, slaves exported from Africa to the Americas as well as rum traded between the West Indies and the Continental colonies. The trends in price dispersion are in all these cases both negative and statistically significant both for the whole period for which we have data, and especially pronounced during certain periods prior to the nineteenth century. In one further case, cacao, there is a negative trend at least for a small period, but the regression is not statistically significant, while in the cases of Asian textiles and pepper there is a statistically significant trend of convergence at least during a subperiod of approximately 60 years in both cases. In total, eight out of 11 commodities studied do show signs of price convergence, if measured by the coefficient of variation, on some intercontinental trade route. For the remaining commodities, the results are either not statistically significant, or the trends are slightly positive (in the trade in tea between China and Great Britain, the positive result is solely driven by a single outlier).
As can be seen in Table 2, the data also suggest convergence of prices, if measured by the deflated standard deviation prices of the commodities, for a clear majority of the commodities analysed. The results from the regressions in Table 1 are confirmed in the case of sugar, tobacco, tea, broadcloth, pepper and rum traded between the West Indies and the Continental colonies. In a couple of cases, the results in Table 2 differ from Table 1: on the one hand, Asian textiles (which in this analysis show a slight positive trend, i.e. of divergence in prices, for the whole period, and no subperiod with a statistically significant negative trend), and, on the other hand, cacao, coffee and cloves (where the trends in this analysis are negative and significant, i.e. showing convergence, at least during a subperiod of 50 years or more). In total, nine out of 10 commodities studied do show signs of price convergence, if measured by the deflated standard deviation, on some intercontinental trade route.
Note should also be taken that in some trades, such as coffee, the trends might be on the margin of qualifying for this article's 50-year criteria of a secular trend, simply because the period for which we have data prior to the nineteenth century is quite short. Some of the results might therefore be strengthened if longer series of data are made available.
5. Discussion
As we have seen, most of the commodities studied in this article do show signs of price convergence, at least during a certain period prior to the nineteenth century, regardless of whether we measure convergence by the coefficient of variation or the deflated standard deviation. If we use the latter measurement, however, the results become somewhat more clear-cut than if we use the former. As Tables 1 and 2 make clear, there is not one uniform, simultaneous and uninterrupted trend towards price convergence for all the commodities investigated here. On the contrary, trends of price convergence occur at slightly different points in time, but many of the markets that show signs of price convergence do so during the late seventeenth or early eighteenth century. Furthermore, much if not all market integration is thwarted time and again by external shocks – such as monopolisation, externally imposed regulations to the market, and most importantly wars and other conflicts.
The largest shock of them all during the period of this article, having effects upon virtually all of the trade routes included, was the French Revolutionary and Napoleonic Wars. Many of the commodities traded did, however, experience divergence even a short time prior to the French Revolution. The empirical evidence presented here indicates that it was around the time of the American Revolutionary Wars (during the late 1770s and 1780s) that a long period of divergence in prices started. This fits well with the results of Giovanni Federico, showing a period of divergence of prices in the European grain trade during the late eighteenth and early nineteenth centuries.Footnote 34
Despite the many conflicts between the colonialist powers of Europe, despite a rather low degree of technological improvements in the transport sector, and in some cases even despite mercantilist regulations and monopolist trading companies, prices thus seem to converge in many trades during the early modern era. Since such disturbances were quite frequent during the early modern era, the findings of this article are not, however, as clear-cut as the evidence of price convergence taking place during later centuries might be.
Since there is very little simultaneous price convergence taking place, any explanation of the trends of price convergence during the period of this study must probably be sought on the individual commodity markets, rather than through general explanations such as improved shipping and decreasing freight rates. This article cannot deal with explanations for this development in as much detail as they would require, but will just propose some possible interpretations.
The trade in sugar is a case in point. Prices in Brazil and Europe seem to converge, particularly during the second half of the sixteenth century. This trend is sustained until the first half of the eighteenth century. The convergence is perhaps not surprising: the rapid development of the Portuguese-Brazilian sugar plantations meant increasing competition with an industry previously centred around the Mediterranean. From the seventeenth century onwards, both the French and the British were also quickly developing sugar colonies of their own in the West Indies, the British West Indies at least going through a so-called ‘sugar revolution’.Footnote 35 Richard Sheridan has argued that the falling price in Europe was due primarily to an increase in supply, relative to the size of the European demand.Footnote 36 In the case of price convergence, the important factor might have been the fact that the supply of sugar increased in many different areas of the Americas, with the effect that Dutch merchants – who had formerly been in control of much of the trade with Portuguese Brazil – lost their dominant market position. The falling price gap might therefore be an effect of increasing competition in the transatlantic trade in sugar, i.e. decreasing monopoly rents.
The convergence in the market for slaves can perhaps be explained in a similar manner. In an article on the topic, Joseph Miller argues that the slave trade route he focuses on – Brazil–Luanda – showed signs of market integration at least by the 1760s. This is the first time, he argues, that an economic boom in Brazil, driving up the price of slaves there, also led to an increasing price in Luanda.Footnote 37 The findings of this article suggest that the markets for slaves started to integrate even prior to that. The late seventeenth and early eighteenth centuries were a period of increasing demand for slaves, but also intensified competition in the international slave trade. Competition increased between merchants of different nationalities (such as the increasing competition between slave traders from Spain, Portugal, the Netherlands, France, Great Britain and even Denmark), but in some cases also between merchants of the same nationality, for example when the former monopoly companies lost their monopoly rights to the British and French trade in slaves by the end of the seventeenth century, opening up the trade for any British or French merchant.Footnote 38
Bulbeck et al. argue that the market for coffee converged during the eighteenth century due to the fact that the global market for this commodity became more efficient and open, and transport, handling and wastage costs were reduced.Footnote 39 The period of data available is unfortunately too short to strongly confirm any trend of integration. It does not, however, seem far-fetched to assume that the market for tea might have converged due to similar reasons, since a number of companies from different countries in Europe competed in trying to supply Europe with this commodity. Furthermore, the price on the British market in particular was to a large extent influenced by contraband trade in tea imported into Great Britain from other countries in Europe.Footnote 40 According to Frederick Smith, Caribbean rum found local and regional markets in the Caribbean and on the American continent. However, the rum trade failed to penetrate the alcohol markets of Europe, so only a small fraction of the production ever reached Europe, which in part might explain the lack of integration on that trade route.Footnote 41
The transatlantic market for cacao did not experience any clear-cut price convergence during the period for which we have data. Prices of cacao from Caracas reached a peak in the Netherlands by the late seventeenth century, and then started to fall, for a short time converging with the prices in Caracas. This comes to an abrupt halt by 1728, when the Caracas Company came into operation, monopolising the market for cacao from Caracas. Prices rose rapidly in Europe as an effect of the monopoly price setting.Footnote 42 Starting in 1728, the regressions show falling dispersion of prices – the coefficients are negative in both analyses (but the regressions are only statistically significant in the analysis of standard deviation). Furthermore, the market in the Netherlands was to a large degree dependent upon trade in contraband cacao, so the prices were most certainly largely determined by how effective the Spanish authorities and the Caracas Company were in enforcing the monopoly. Market integration was thus thwarted by this monopolisation of the market for cacao from Caracas.
In a manner similar to the case of cacao, the trades in cloves and pepper between Europe and Asia were at times monopolised, having a significant effect upon the prices both in Europe and Asia. This can be seen very clearly in the data, where the monopolisation shows up almost immediately in the form of a sudden and very drastic divergence in prices. As soon as the monopolies collapsed, by the late eighteenth century or early nineteenth century, respectively, prices for these commodities too started to converge.Footnote 43
There is a common theme to many of the explanations proposed above, namely that mercantilist institutions and policies – and the deregulation of such institutions – during the seventeenth and eighteenth centuries had a highly significant effect upon the prices of the commodities traded. Monopolisation ought to have increased, and deregulation on the contrary decreased, monopoly rents. Deregulation might at the same time have led to a lower deadweight loss in the international markets of the time. To some extent, decreasing monopoly rents might be an effect of the changes that mercantilism, particularly in Great Britain, underwent around this time. According to David Ormrod, several new trade policies in late seventeenth-century Great Britain were nationalist in a double sense – on one hand, the policies were highly protectionist in order to reduce competition from rival nations. On the other hand, and most importantly from the perspective of this article, the policies implied a degree of deregulation so that ‘the advantages could be exploited by the [British] merchant community as a whole, rather than specific groups, companies or sectional interests claiming special privileges’.Footnote 44
The findings of this article are different from those of O'Rourke and Williamson for several reasons. One important reason is that more data were included, and for different (and potentially more important) commodities than O'Rourke and Williamson look at in their studies of global market integration. Another reason is the issue of how long a secular trend is: if O'Rourke and Williamson had used the same yardstick during the period prior to the nineteenth century as they do for later periods, even their own data might have been interpreted differently by the authors. A third (but perhaps minor) reason is the issue of how to deal with external shocks to the market: O'Rourke and Williamson include price trends during the Revolutionary and Napoleonic Wars, which in practice stops trends prior to the conflict from qualifying as evidence in favour of market integration. However, they do not treat the period from World War I onwards in the same way, thus disqualifying evidence of convergence. A fourth reason is the choice of measurement of convergence: the choice between absolute or relative convergence matters somewhat for the results, but as we have seen there is evidence in favour of convergence for many of the trades regardless of which measurement we use.
The findings of this article also differ from those of both Bateman and Özmucur and Pamuk. One reason for this is the different geographical coverage: while these authors focus upon the trade (mainly in staples) within Europe, this article focuses upon intercontinental trade, mainly in colonial goods. The intra-European trades were possibly not subject to as many institutional changes as the intercontinental trade was during this time, which might contribute to explaining the different results. Another potential reason is, again, the issue of how long a secular trend of convergence must be in order to qualify as evidence of market integration. These scholars all require the trends of convergence to last for the whole of their period of study – i.e. some 300–350 years. In Bateman's study, at least, there seem to be quite long periods of time where the markets do seem to integrate, even if the trends do not last for the whole period of her study.Footnote 45
Since most of the commodities studied in this article were so-called colonial commodities, another question might be posed: did convergence in the price of colonial commodities really matter? Colonial commodities were, for sure, non-competing goods and luxury items rather than necessities, in the countries importing them. As non-competing goods, the price of imports probably had little or no effect upon the domestic price levels of goods in the importing countries. During the nineteenth century, international trade took on a different character than during the eighteenth century, so that the trade in competing staples became ever more important, having a significantly more important effect upon domestic prices as well. Colonial commodities did, however, have a historical significance in other ways. In the case of the Americas, the export production of colonial commodities was decisive for the development of the American plantation complex, and thus for much of the social structure in large parts of the Americas.Footnote 46 There has also been quite a large scholarly focus upon how such ‘new luxuries’ changed European society as well during the early modern period, for example through contributing to a new consumer society, and an ‘industrious revolution’ in Europe.Footnote 47 It is unfortunately beyond the scope of this article to study in depth whether the price convergence observed was big enough to have any impact on the trade in these goods, but it does not seem far-fetched to assume that it at least played a role in that respect.
6. Conclusions
The common view seems to be that there is no evidence of an early globalisation, at least not prior to the 1820s. This is so, argue O'Rourke and Williamson, since there is no evidence of price convergence prior to the nineteenth century. In this article, I have tried to test this argument on price convergence. There is, however, no self-evident way to measure price convergence statistically. In this article, I have estimated price convergence in two different ways – convergence of the deflated standard deviation and convergence of the coefficient of variation of the prices. In order to qualify as evidence of a secular trend of market integration, the article used a criterion of convergence spanning and sustained for approximately 50 years or more. The period prior to the French Revolution and the Napoleonic Wars has been the focus of attention, since it was argued that around this time a long period of de-globalisation was sparked off.
In total, 11 commodities important to the long-distance trade are included in the study. If and when further price data become available from other regions, these results might have to be re-evaluated. In the meantime, the price data available do point towards the occurrence of price convergence in early modern world trade, even prior to the nineteenth century.
If convergence is measured by the coefficient of variation, several of the most important commodities – such as tea, textiles, tobacco, sugar and slaves – do experience trends of price convergence prior to the nineteenth century. If convergence is measured in the form of the deflated standard deviation, most of the commodities studied in this article experience trends of convergence.
When we use a couple of different ways of measuring price convergence, we get a more complicated picture than what is commonly thought. Whether we should call this price convergence globalisation is to a large extent a question of definition – something that is beyond the scope of this article. It is also beyond the scope of this article to establish any explanations for this price convergence, but increasing competition (and thus falling monopoly rents) might be among them, an effect of what can be called the ‘nationalisation’ of mercantilism, following David Ormrod.Footnote 48
Kevin O'Rourke has in a recently published article argued that there was a potential for global market integration already prior to the nineteenth century, but that this potential was constantly frustrated by mercantilist policies and wars.Footnote 49 The findings of this article show that O'Rourke is correct in so far that such policies and wars often thwarted commodity market integration. The findings of this article also show that despite of this, the potential for market integration actually was realised in many intercontinental trades, and then for quite long periods of time.
There is a striking difference in what commodities are traded during different periods – i.e. in the scale and scope of globalisation. By the nineteenth century, the price wedge between markets internationally had become small enough to enable a trade in ever cheaper goods, instead of the primarily luxury-based early modern world trade. Globalisation has intensified over time. The findings of this article, however, show quite conclusively that we cannot dismiss the issue of pre-industrial price convergence and market integration – and thus premodern globalisation, if we accept this definition – as easily as has often been done so far.
Acknowledgements
The author would like to thank Jan Bohlin, Svante Prado, Staffan Granér, Astrid Kander, Christer Lundh, Oskar Broberg, Irene Elmerot, the participants at the 2nd Sound Economic History Workshop and most especially two anonymous referees for helpful and constructive comments on earlier drafts of this article.
Appendix: description of the price data
A1. Sugar
As for sugar, price data for the period prior to the 1820s are available from Brazil, Colombia and Peru in Latin America, from a couple of cities in the USA and from the Netherlands, Spain, France and Great Britain in Europe.Footnote 50 In all cases, the prices refer to white, i.e. refined, sugar.Footnote 51 Ideally, one would have wanted data on raw sugar since that is the form in which most of the sugar was traded internationally, but alas too little such data are available to enable a comparison. In all cases, the data used are converted into the price of sugar expressed in grams of silver per kilogram of sugar.Footnote 52
A2. Cacao
The price of cacao is so far available from two areas – Caracas in Venezuela, and the Netherlands – assembled by Roland Hussey and N. W. Posthumus, respectively. The Dutch data refer specifically to cacao from Caracas, sold on the Dutch market.Footnote 53
A3. Slaves
Joseph Miller has published calculations on the price of slaves in the southern Atlantic – between Africa and Brazil – and compared those prices to the price reported by other scholars from other regions around the Atlantic. In order to make the prices comparable, Miller has tried to find data for peças (a sort of ‘standardised slave’ – i.e. a strong, healthy, male slave – used by the merchants at the time to compare the prices of slaves on different markets) and has converted the local currencies into pounds sterling.Footnote 54 The data are only reported as average price per decade.
A4. Tobacco
Tobacco was often the first crop to be planted in the plantation complex of the Americas, and production increased rapidly during the seventeenth century. Data on the American price of tobacco are, however, not available until the 1720s. In Europe, the price of tobacco is available from the Netherlands (Virginian tobacco) from 1674 onwards.Footnote 55

Robustness check in the case of sugar (deflated standard deviation)

Sources: see Appendix A1.
Robustness check in the case of slaves (coefficient of variation)

Sources: see Appendix A3.
A5. Rum
In his dissertation, John McCusker assembled price data for molasses and rum, on both sides of the Atlantic. McCusker has converted the local currencies into pounds sterling, so as to make the prices comparable.Footnote 56 Prices are available from a couple of cities in three regions: the rum/molasses-exporting regions of the West Indies, and the importing regions in the USA and Great Britain.
A6. Broadcloth
Broadcloth was one of few commodities exported from Europe to Asia, aside from precious metals. K. N. Chaudhuri provides data on the price of British broadcloth, and the sale price in Bengal, in rupees per piece of broadcloth.Footnote 57 The price data only cover a period of 50 years, so any results will automatically be on the margin of the criterion for length of secular trends established in this article.
A7. Tea
Price data for tea are so far very patchy, but can be found in available datasets from Great Britain and Japan, as well as from China.Footnote 58 The prices from Japan seem to refer to local prices, while the prices from China are taken from the accounts of the British East India Company. The early years of data from China are somewhat unreliable, since they refer to extremely small amounts of tea, compared to later purchases. The Japanese price-series for tea contain quite long gaps in the series.
A8. Textiles, cloves, coffee and pepper
This article will also undertake a brief revisiting of the trade in textiles, cloves, coffee and pepper – four commodities reported by O'Rourke and Williamson as evidence in favour of their hypothesis. The data are in all cases taken from the same sources as O'Rourke and Williamson. The data therefore refer to the prices of cloves, coffee and pepper in southeast Asia and Amsterdam, respectively, and the price of textiles in Asia and Great Britain.Footnote 59 In the case of cloves, coffee and pepper, the data are only reported as average price per decade.