I. INTRODUCTION
The use of ferritic stainless steels for different applications has increased over the last years due to their resistance to corrosion and combination of good mechanical properties and low maintenance requirements Reference Cashell and Baddoo1 with lower cost of production compared to those of the austenitic stainless steels. Reference Siqueira, Sandim and Oliveira2 This reduction in costs stems mainly from the low additions or absence of nickel, which, in some cases, makes these steels a viable alternative to the austenitic stainless steels.
Ferritic stainless steels can develop an undesirable surface defect, after the cold rolling and/or deep drawing stage, called ridging or roping. Reference Wu, Jin, Shi and Lloyd3 This phenomenon, detracts from the aesthetics of the surface and is related with the crystallographic texture developed from solidification. Reference Brochu, Yokota and Satoh4–Reference Shin, An, Park and Lee7
After solidification, this type of steel presents mostly
 $\left\{ {001} \right\}\left\langle {{\rm{uv}}0} \right\rangle$
oriented columnar grains, which is generally considered harmful.
Reference Liu, Liu, Qiu, Cao, Li and Wang8
It is well known that cold rolled ferritic stainless steels inherit their texture from hot rolling,
Reference Raabe and Lücke9
which in turn, inherit their texture from solidification. To decrease ridging, this solidification texture must be somehow reduced/eliminated. This can be achieved via either phase transformation or mechanical straining and recrystallization. However, Nb-stabilized AISI 430 ferritic stainless steel, the object of the present study, does not transform on cooling. Therefore, the only possibility to change the solidification texture after thermomechanical processing is by recrystallization.
Reference Mehtonen, Palmiere, Misra, Karjalainen and Porter10,Reference Oliveira, Silva and Alcântara11
In the case of ferritic stainless steels, it is well known that dynamic recovery (DRV) is the dominating softening mechanism.
Reference Hinton and Beynon12–Reference Wei, Lai-Zhu, Quan-She, Zhen-Yu and Xin14
This mechanism reduces the stored energy from deformation, decreasing the driving force for static recrystallization (SRX). SRX during hot rolling for ferritic stainless steels can be promoted by an increase on the strain, an increase on the interpass time, and/or by using intermediary rolling temperatures (higher temperatures favor the recovery and in lower temperatures the material does not recover nor is recrystallized).
Reference Oliveira, Silva and Alcântara11,Reference Mehtonen, Karjalainen and Porter13
Industrial hot rolling is a complex process. There is, of course, the possibility of performing industrial scale trials to optimize temperature ranges which would favor the occurrence of SRX. However, these trials are expensive, difficult to conduct and usually samples cannot be taken from intermediate passes, thus making it impossible to have details of microstructure evolution during processing. The alternative is to use mechanical testing such as hot compression or hot torsion.
Different authors have studied the hot deformation behavior of ferritic stainless steels to reduce/eliminate ridging and improve drawability. Reference Mehtonen, Palmiere, Misra, Karjalainen and Porter10–Reference Hinton and Beynon12 Hinton and Beynon Reference Hinton and Beynon12 studied the softening mechanisms of an AISI 430 ferritic stainless steel in industrial conditions by hot compression simulation of a Steckel mill. However, the AISI 430 steel is not stabilized, and thereby suffers from phase transformation during hot rolling, which affects both the restoration mechanisms and the texture development.
Mehtonen et al. Reference Mehtonen, Palmiere, Misra, Karjalainen and Porter10 analyzed the microstructure and texture development during multipass hot deformation of an stabilized ferritic stainless steel by hot compression simulation of a Steckel mill. They applied two passes at relatively high temperatures, the sample was then cooled down to 800 and 650 °C, and the third deformation was applied. They concluded that full recrystallization occurred between passes at high temperatures and that, as the temperature decreased in the third pass, the work hardened was more preserved, thus having the potential to recrystallize during the subsequent annealing that takes place after hot rolling. In their case, the steel used did not transform on cooling. However, the number of passes given was very limited (just three) and the temperature was rather low, compared to the usual temperatures used in an industrial process.
Oliveira et al. Reference Oliveira, Silva and Alcântara11 reported that recrystallization during hot rolling results in both ridging reduction and improved drawability. Furthermore, addition of Nb as a stabilizer, combined with controlled hot and cold rolling, resulted in steel with superior drawability, lower ridging, and shinier surface than those of the nonstabilized ferritic stainless steels. Nb has been used also as refining microalloying element, especially in HSLA (High strength low alloy) steels. The main effect of Nb is the increase of the mechanical resistance without the necessity of increasing the amount of C, Mn, or other element, due to the delay of austenite recrystallization during thermomechanical processing. Reference Grey and Siciliano15
In the current work, hot finishing rolling on a Steckel mill of an Nb-stabilized AISI 430 ferritic steel was simulated via hot torsion tests. This steel does not transform during cooling, hence changes in texture can only be promoted from recrystallization. It is then expected that the steel will behave much like that reported for Ti–Nb steel. However, by using hot torsion, it was possible to simulate conditions much more similar to those found in industry, namely, by applying a larger number of passes, contrary to the ones used by Mehtonen et al. Reference Mehtonen, Palmiere, Misra, Karjalainen and Porter10 and Hinton and Beynon. Reference Hinton and Beynon12 The temperatures used in the experiments were also very close to those practiced in actual Steckel rolling.
The aim of the present work is then to simulate this process via hot torsion testing and investigate, within the restrictions of a Steckel hot rolling schedule, which thermomecanical conditions, largely related to pass temperature, would mostly favor SRX.
II. MATERIALS AND METHODS
The chemical composition of the Nb-stabilized AISI430 ferritic stainless steel used in this work, in weight percent is: 16.07 Cr, 0.18 Ni, 0.02 C, 0.20 Mn, 0.48 Si, 0.32 Nb, 0.0017 Al, and 0.0005 S. This steel was produced and supplied by Aperam South America.
A. Hot torsion simulations
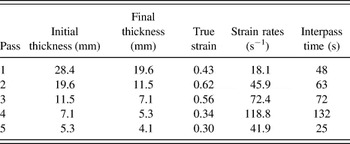
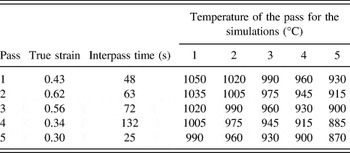
Rolling practices at a Steckel type mill at Aperam South America steelworks was taken as reference for the hot torsion simulations. Detailed description of the mill is given elsewhere. Reference Schuwarten16 Table I gives the industrial data used as base for the simulations. For torsion tests, 7 mm (diameter) × 15 mm (useful length) samples were machined from 28 mm thick plates, obtained from the hot roughing mill. The torsion test is commonly used to simulate high-temperature deformation since the specimens can be severely deformed without rupturing. This test also allows reproducing preheating process of the slabs, deformation, and cooling rates, which are similar to those used in industry. Furthermore, the microstructure of the samples obtained by high-temperature torsion is also similar to that obtained via industrial processing. Reference Schuwarten16–Reference Boratto, Barbosa, Yue, Jonas and Tamura18 The tests were performed on a mechanical testing machine INSTRON 1125 (Canton, Massachusetts), equipped with a torsion unit. An electromagnetic induction coil, connected to a programmable controller, was positioned around the sample to apply different heating and cooling rates. Argon atmosphere was used to protect the samples from excessive oxidation. Six simulations were performed aiming to determine the optimum conditions to promotes interpass softening via recrystallization. During testing, the torsion samples were heated at a rate of 2 °C s−1 to 1050 °C, held at temperature for 120 s, and then cooled at a rate of 1 °C s−1 to the temperature of the first pass. Immediately after that, the deformations were imposed according to the temperatures and interpass times specified for each simulation. A total of five passes were applied with a constant strain rate of 0.3 s−1. The values of true strain (εeq) applied to the sample are equivalent to those obtained from industry rolling data and calculated as shown below.
 $${\varepsilon _{{\rm{eq}}}} = {{\left[ {2\,\ln \left( {{{{h_1}} \mathord{\left/ {\vphantom {{{h_1}} {{h_2}}}} \right. \kern-\nulldelimiterspace} {{h_2}}}} \right)} \right]} \mathord{\left/ {\vphantom {{\left[ {2\,\ln \left( {{{{h_1}} \mathord{\left/ {\vphantom {{{h_1}} {{h_2}}}} \right. \kern-\nulldelimiterspace} {{h_2}}}} \right)} \right]} {\sqrt 3 }}} \right. \kern-\nulldelimiterspace} {\sqrt 3 }}\quad ,$$
where h1 and h2 are the initial and final thickness of the plate, respectively.
Thermomechanical parameters for industry processing 430Nb steel in a Steckel mill. Reference Schuwarten16

The true strain is converted into the torsion angle by
 $$\theta = {{\sqrt 3 L{\varepsilon _{{\rm{eq}}}}} \mathord{\left/ {\vphantom {{\sqrt 3 L{\varepsilon _{{\rm{eq}}}}} r}} \right. \kern-\nulldelimiterspace} r}\quad ,$$
where: θ is the angular displacement, L the length and r the radius of the specimen.
Measured values at torque were converted to true stress using
 $${\sigma _{{\rm{eq}}}} = {{\sqrt 3 \tau \left( {3 + m + n} \right)} \mathord{\left/ {\vphantom {{\sqrt 3 \tau \left( {3 + m + n} \right)} {2\pi {r^3}}}} \right. \kern-\nulldelimiterspace} {2\pi {r^3}}}\quad ,$$
where: σeq is the equivalent stress, τ the measured torque, m the sensitivity coefficient to angular strain rate, and n the sensitivity coefficient to angular strain changes. Table II shows details of the deformation schedules used in the torsion experiments.
Hot torsion parameters used in the simulations.

B. Electron backscatter diffraction (EBSD)
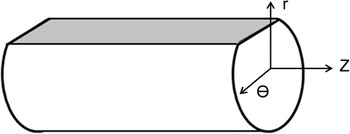
Figure 1 shows a schematic of the sample surface that was used for the EBSD analyses; this plane corresponds to the θZ plane, where the z axis is parallel to the horizontal direction of the EBSD maps.
Scheme of the analyzed region for the torsion samples.

For the EBSD measurements, the samples were cut with an abrasive disc and the entire useful length of 15 mm was mounted, ground, and polished with 9 and 1 µm diamond paste. After this, the samples were polished with colloidal silica for 40 min. The longitudinal section of the sample was prepared to a depth of 0.1 mm below the surface; microstructural analysis was performed near the sample surface on a ∼2 mm width section. The EBSD maps were collected using a FEI Quanta 650 FEG microscope (Hillsboro, Oregon) equipped with Oxford High Speed Nordlys Max 2 detector. The data was collected using an acceleration voltage of 20 kV, a working distance of 18 mm, and a step size of 3 µm. Data were analyzed by the OIM™ software. All the measurements obtained have a confidence index higher than 0.7 and were cleaned by using grain dilatation and grain CI standardization (grain tolerance angle or 5 and minimum grain size of 2). The mean grain size was measured to analyze the refinement of the microstructure. Measurements were obtained from EBSD data considering a misorientation angle ≥15°.
In the present work, the kernel average misorientation (KAM) was calculated on the basis of first nearest neighbors for a maximum misorientation angle of 5°. The grain orientation spread (GOS) was also calculated to obtain relevant additional information on the deformed and recrystallized grains.
III. RESULTS
A. Flow curves
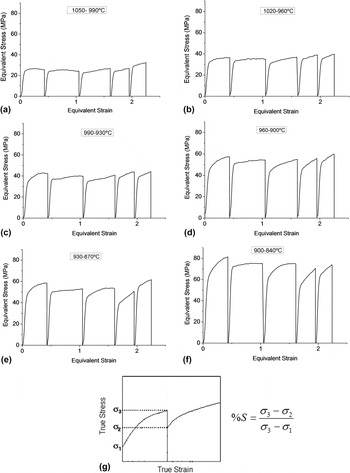
Figure 2 shows the flow stress curves for the six simulations of the finishing hot rolling in the Steckel mill. It is possible to observe that the stress increases with decreasing simulation temperature (listed in Table II). From the shape of the curves, it is possible to predict the type of dynamic softening suffered by the material. They can be distinguished from one another by start temperature at the first pass and temperature at the last pass, as displayed in Fig. 2. Hence 1050–990 °C means simulation 1 and 900–840 °C, simulation 6.
Flow stress curves of the finishing hot rolling for (a) simulation 1, (b) simulation 2, (c) simulation 3, (d) simulation 4, (e) simulation 5, and (f) simulation 6. The temperatures indicated refer to the temperature of the first and last passes. Figure (g) shows schematics used in the calculation of fractional softening between passes.

The level of the stress–strain curves increases as temperature decreases, as expected. The shape of the curves are however very similar in all experiments, that is, all curves indicate the occurrence of recovery as the sole dynamic softening mechanism. When passes were given at higher strains, case of passes 1 to 3 in which strains were respectively 0.43, 0.62, and 0.56, even then, no dynamic recrystallization happened. In these passes, the flow curves reach a plateau, in special in the case of curves seen at higher temperatures (the simulation run at 1050–990 °C). This is typical behavior for hot resistance of 430Nb steel. So it can be concluded that, under the conditions tested, the steel was always dynamically softened by dynamic recovery only.
Other important information that can be obtained from stress–strain curves shown in Fig. 2(g) is the fractional softening between deformations. The fractional softening (%S) can be calculated by,
 $$\% S = {{{\sigma _3} - {\sigma _2}} \over {{\sigma _3} - {\sigma _1}}}\quad ,$$
which is very often used in the case of hot deformation of austenite. Reference Hong, Kang and Park19 However, in the case of ferritic steels, it seems, the use of a parameter like this may be not very effective or conclusive, but it may be used to indicate trends.
Parameter S may not be very effective in pointing out explicitly small differences from pass to pass as in the case of passes 1 to 3 in all simulations. It is, however, more effective in pointing out trends, though. In this sense, fractional softening computed between passes 4 and 5 is clearly different from those calculated between passes 1 to 3. In the case of passes 4 and 5 the fractional softening is around 50% or less. Also, DRV is not effective enough in passes 4 and 5 when compared to previous passes and the shapes of the curves in passes 4 and 5 display some work hardening. In this way, the results seem to indicate almost full softening in the group of passes 1 to 3 and some work hardening retained in the group 4–5.
B. EBSD
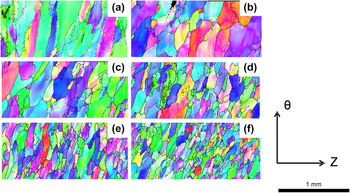
Figure 3 shows the corresponding inverse pole figure maps obtained from postprocessing the EBSD data resulting from the simulations. After simulation, micrographs show elongated grains, which are consistent with comments just made on the shape of the stress–strain curves and fractional softening calculated from the flow curves.
Inverse pole figure maps of the samples after finishing rolling simulation: (a) simulation 1, (b) simulation 2, (c) simulation 3, (d) simulation 4, (e) simulation 5, and (f) simulation 6.

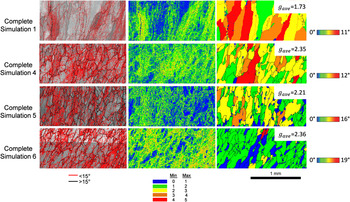
Figure 4 shows EBDS maps which were performed for samples with torsion simulations finishing at lower temperatures, namely, simulation at temperature ranges of 960–900, 930–870, and 900–840 °C. Simulation 1 (1050–990 °C) was also studied to compare with the lower temperature simulations.
Grain misorientation, kernel average misorientation and grain orientation spread results for the complete simulations 1, 4, 5, and 6.

The KAM results were used to evaluate the mean misorientation of a pixel, based on the comparison of the orientation of n layers of neighboring pixels that constitute a kernel; i.e.,
 $$\theta _i^{{\rm{KAM}}} = {1 \over n} \sum \limits_{j = 1}^n \Delta {\theta _{ij}}\quad ,$$
The KAM can be also be used to characterize the spatial distribution of stored energy in a sample since its relationship to the dislocation density allows a direct comparison between the different levels of deformation in the same EBSD map. Reference Boulnat, Pérez, Fabregue, Douillard, Mathon and De Carlan20,Reference Badji, Chauveau and Bacroix21 In general, high (>1°) KAM is obtained for deformed grains, owing to their high density of dislocations. In contrast, recrystallized grains have low (<1°) KAM. Reference Li, Hsu, Szpunar, Utsunomiya and Sakai22 In the KAM maps, blue and red regions have the lowest and highest dislocation density, respectively.
The GOS is the average deviation in orientation between each point in a grain and the average orientation of the grain. This approach leads to assigning the same value to every scan point contained within the grain. Reference Wright, Nowell and Field23 It is mathematically expressed as:
 $${\rm{GOS}} = {1 \over N} \sum \limits_{A = 1}^N f\left( x \right) = \left\{ {{\rm{min}}\left[ {{{\cos }^1}\left( {{{{\rm{trace}}\left[ {{g_{{\rm{ave}}}}{{\left( {{h_i}{g^A}} \right)}^1}} \right] - 1} \over 2}} \right)} \right]} \right\}\quad ,$$
where A indicates the Ath measurement point in a grain consisting of N measurements, g ave is the average orientation of the grain, g A is the orientation measured at the Ath position within the grain, and h i is the appropriate symmetry element yielding the minimum misorientation angle between the average orientation and the Ath measurement. Reference Cao, Di, Zhang, Zhang, Maa and Misra24 These calculations were used to distinguish the recrystallized grains from the deformed ones.
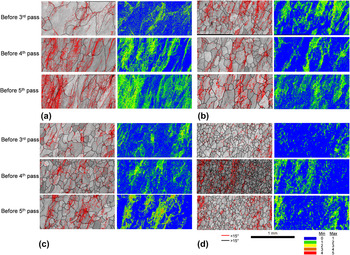
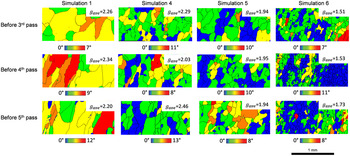
Interpass recrystallization was also investigated by interrupting rolling simulations 1, 4, 5, and 6 and analyzing the samples via EBSD. These interruptions were done prior to the 3rd, 4th, and 5th passes. Simulations 2 and 3 were not studied since the results from the torsion test and EBSD were similar to those obtained for simulation 1. The interrupted torsion tests allowed the analysis of the microstructures formed between the passes. Figures 5 and 6 show the grain boundary misorientation and KAM and GOS, respectively, as obtained from the EBSD data of interrupted simulations 1, 4, 5, and 6. The results from the interrupted tests and complete simulations were separated since the samples from the interrupted tests were quenched after waiting for period equivalent to the interpass times (listed in Table II). However, in the complete simulations, the samples were quenched immediately after the last deformation pass.
Grain misorientation and kernel average misorientation results from the interrupted (a) simulation 1, (b) simulation 4, (c) simulation 5, and (d) simulation 6.

Grain orientation spread results from the interrupted simulation 1, simulation 4, simulation 5, and simulation 6.

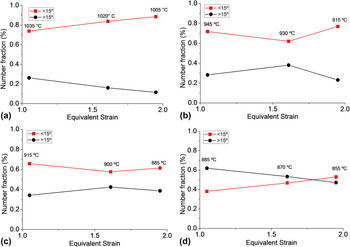
The number fraction of low and high angle grain boundaries, as defined by misorientation angles was lower and higher than 15°, respectively, was calculated from the EBSD data obtained from the samples; plotting these fractions as a function of the equivalent strain revealed the evolution of nucleation of these boundaries with applied strain, as shown in Fig. 7.
Equivalent strain as a function of the grain misorientation (a) simulation 1, (b) simulation 4, (c) simulation 5, and (d) simulation 6.

As Fig. 7(a) shows, the number fraction of high angle grain boundaries decreased with temperature and applied strain, while those of their low angle counterparts increased. These results are consistent with the stress–strain curves [Fig. 2(a)], since the material softens predominantly by recovery, as evidenced by the increase of subgrains in the microstructure; the results also concur with the trends observed in the KAM maps [Fig. 5(a)], which revealed the increase in the dislocation density through the passes.
Figure 7(b) shows that the sample that interrupted before the 4th pass has a higher number fraction of high angle grain boundaries than those of the other samples. This confirms the occurrence of recrystallization, as previously discussed. However, the fraction of subgrains (<15°) increases in the subsequent pass. This can be explained by the fact that a grain, which recrystallized during the interpass time, may strain harden or soften by recovery during subsequent passes, thereby increasing the number fraction of subgrains. In addition, the KAM maps show that the energy accumulation is high for the complete simulation [Fig. 5(b)] and low (as indicated by the blue-colored regions) in the sample interrupted before the 4th pass.
The results [Fig. 7(c)] from this simulation 5 are similar to those obtained for simulation 4. However, the number fraction of subgrains is slightly lower than that resulting from simulation 4. This difference indicates that the microstructure was more refined in simulation 5 than in simulation 4, although the number fractions resulting from the complete simulations are very similar. These results are consistent with the stress–strain curves [Fig. 2(e)], which indicated that recrystallization occurred between the 3rd and 4th passes. This occurrence was evidenced by the pronounced difference between the maximum stress of the 3rd pass and the yield tension of the 4th pass. Furthermore, the KAM maps revealed that the energy accumulated in the sample interrupted before the 3rd pass is lower than that of its counterpart in simulation 4. This difference stems from the fact that a higher fraction of the sample recrystallized in the former than in the latter. The difference is further related to the temperature of initiation of simulation 5, which is lower than that of simulation 4. This decrease on temperature increases the amount of strain hardening, and hence the dislocation density in the sample, relative to that of its counterpart in simulation 4. Since the dislocation density is the driving force for recrystallization, the sample from simulation 5 was therefore more recrystallized than its counterpart from simulation 4.
Figure 7(d) shows the results of simulation 6, where the behavior of the material differs from those of the other simulations. The number fraction of high angle grain boundaries is higher than the fraction of subgrains for the samples interrupted before the 3rd and 4th pass. However, the behavior is inverted for the 5th pass. The recrystallized grains may have strain hardened during the subsequent (5th) pass and may have then softened via static recovery, which resulted in an increase in the number fraction of subgrains. These results concur with the stress–strain curve. Moreover, the KAM results showed that the sample interrupted before the 3rd pass was even more recrystallized than the sample, which underwent simulation 5.
From the GOS results, presented in Fig. 6, it is clear that in simulation 1, the material softens predominantly by recovery, since there is no evidence of recrystallization in the samples (blue grains), which concurs with the results discussed above. It is also possible to observe the difference between the g ave from simulations 1, 4, 5, and 6. This parameter allows separating the deformed and recrystallized grains: the grains having orientation spread less than the average GOS were recrystallized and the ones having greater orientation spread were deformed for each of the conditions. Reference Biswasa, Kimb and Suwasa25 It is clear from Fig. 6 that decreasing the temperature simulation improves the recrystallization of the sample. Also it is possible to observe that simulation 6 has a more recrystallized microstructure due to the lower g ave and the higher presence of recrystallized grains (blue grains).
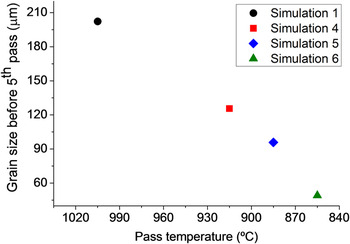
The mean grain size of the complete simulations 1, 4, 5, and 6 is presented in Fig. 8. As the figure shows, just before the last pass of the simulation, the grain size resulting from simulation 6 is the smallest of all the grain sizes; this result is consistent with the stress–strain curve and EBSD results presented above.
Mean grain size before the 5th pass for simulation 1, 4, 5, and 6.

C. Microtexture results
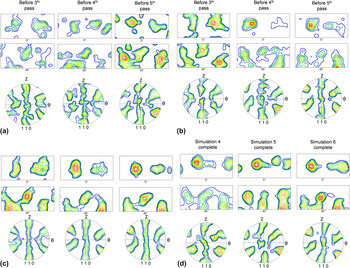
Figure 9 shows the microtextures resulting from the interrupted and complete simulations. The results from simulation 1 were not included since the number of grains in the samples was insufficient to perform a reliable statistical analysis of the microtexture.
Microtexture results from the interrupted (a) simulation 4, (b) simulation 5, and (c) simulation 6, (d) complete simulations 4, 5, and 6. Calculation method: Discrete binning. Levels 1, 1.4, 1.8, ….

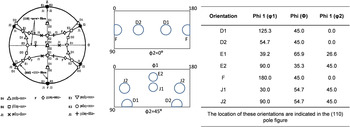
Some of the important ideal torsion orientations and their respective Euler angles for α-iron are listed and their position in the {110} pole figure and the orientation distribution function (ODF) plot are shown in Fig. 10. As the figure shows, some of the pole figures are tilted away from their symmetrical position and some of the components in the ODFs are shifted (or rotated away) from their ideal positions. This phenomenon was also observed by Baczynski and Jonas
Reference Baczynski and Jonas26
who attributed this deviation to the level of strain in the sample. In addition, the intensities of the typical glide components, F and J,
Reference Baczynski and Jonas26,Reference Baczynski and Jonas27
increase with increasing strain
Reference Baczynski and Jonas27
; and the J1 and J2
 $\left\{ {110} \right\}\left\langle {112} \right\rangle$
texture components are formed first and dominate at low strains. Moreover, when the strain is increased, the intensities of the E1 and E2
 $\left\{ {110} \right\}\left\langle {111} \right\rangle$
components decrease and the intensity of D2 increases
Reference Baczynski and Jonas26
; the recrystallization texture is also composed primarily of the
 ${\rm{D}}1\left( {11\bar 2} \right)\left[ {111} \right]$
,
 ${\rm{D}}2\left( {\bar 1\bar 12} \right)\left[ {111} \right]$
, and
 ${\rm{E}}2\left( {0\bar 11} \right)\left[ {111} \right]$
under these conditions.
The (110) pole figure, ODFs (φ2 = 0° and 45°) and Euler angles of some important torsion ideal orientation for the α-iron. Reference Baczynski and Jonas26,Reference Baczynski and Jonas27

For a given simulation, the microtextures obtained in this work exhibited, in most cases, small differences with each deformation pass. These small differences are attributed to the low amount of strain imparted during passes and to the partial recrystallization of the sample during the interpass time.
In simulation 4 [Fig. 9(a)], the texture resulting from the simulation interrupted before the 3rd pass is composed mainly of D1 and D2; these components are however, more diffusible compared to their counterparts in the sample resulting from interruption before the 4th pass, where the recrystallization components are sharper. In addition, the presence of the F component suggests that the sample was deformed and then partially recrystallized during the interpass time, but this recrystallization was not enough to remove the F component completely. The intensity of the D2 and J2 components increased in the sample interrupted before the 5th pass, relative to the intensities resulting from interruptions before the 4th pass. These components are typically associated with increasing strain Reference Baczynski and Jonas26,Reference Baczynski and Jonas27 as well as recrystallization, and hence, these results are consistent with those presented in Fig. 5(b).
For simulation 5 and 6, the results also concur with those shown in Figs. 5(c) and 5(d), respectively. The sample clearly recrystallized before the 4th pass, as indicated by the respective increased and decreased intensities of D2 and D1, and the absence of any slip components. Furthermore, the F and J2 component first appear in the sample before the 5th pass suggesting an increase in the deformation.
The presence of the D1 and D2 components appears prominently in the microtextures of the samples from the complete simulations. In addition, the intense F component results from the sample being immediately quenched after the last pass of deformation; therefore, the sample was only strain hardened.
IV. DISCUSSION
Results from the flow curves (Fig. 2) and microstructure (Figs. 4–6) evidence that the main dynamic softening mechanism during the first three passes is recovery. Calculated softening fractions of approximately 100% proved that SRX occurred between passes. However, DRV was not efficient for the last two passes since stresses did not achieve a plateau. This evidences an increase of work hardening when the deformation temperature is decreased.
Mehtonen et al. Reference Mehtonen, Palmiere, Misra, Karjalainen and Porter10 obtained similar results after investigating the flow stress evolution, microstructure, texture, dislocations, and precipitation during multipass deformation of a dual-stabilized 21%Cr ferritic stainless steel. They observed softening by DRV during the first two passes applied at 950 °C and SRX during the interpass time of 20 s. A small fraction of recovered grains remained in the microstructure, indicating that the SRX was not complete. In their work, only the last pass was applied in a different temperature than the two previous passes. They found that lowering the deformation temperature resulted in a higher amount of work hardening, which may accelerate the SRX kinetics during subsequent hot band annealing stage. Reference Mehtonen, Karjalainen and Porter13
The coarse grains in the microstructures resulting from simulations 1 and 2 (Fig. 3) reveal the occurrence of strain hardening. This is in agreement with results reported in Ref. Reference Mehtonen, Palmiere, Misra, Karjalainen and Porter10, that is, full recrystallization between deformations given at 950 °C and work hardening at 800 and 650 °C. The latter two temperatures reported in Ref. Reference Takechi, Kato, Sunami and Nakayama6, however, are either in the very low end for a Steckel mill processing or altogether unrealistic. In the present work, as torsion was used to simulate the industrial process, a more realistic condition could be used and hence the results obtained here may approach better than those found in the industry. Moreover, Fig. 3 shows that the fragmentation of the microstructure increases with decreasing simulation temperature. This refinement of the microstructure indicates that recrystallization occurred. These results are consistent with those of the torsion simulations curves and the ones presented in Fig. 6. The grain refinement results also concur with those reported by Gao et al. Reference Gao, Liu, Liu and Wang17 who studied a ferritic stainless steel microalloyed with Nb and B.
Finally, it was possible to observe that the texture for all the analyzed simulations was not strong due to the fact that the total deformation was lower than 2.3 and also due to the deformation and softening mechanisms between passes. In consequence, this may reduce the influence of the texture in the final properties of the 430Nb steel. Similar results were found by Oliveira. Reference Oliveira28
Together, EBSD, and flow stress curves, revealed that the hot rolling simulation in Steckel mill, performed at temperatures of 930–870° (simulation 5) and 900–840 °C (simulation 6) is sufficient for promoting interpass recrystallization between the three first passes of the AISI 430Nb ferritic stainless steel. Furthermore, the work hardening obtained from the last two passes of deformation, will favor the occurrence of recrystallization in the annealing stage after finishing hot rolling. Reference Mehtonen, Karjalainen and Porter13 This recrystallization will give rise to a grain-refined microstructure and less texturized material, leading to improved drawability and reduced ridging in this steel. Reference Oliveira28
V. CONCLUSIONS
-
(1) EBSD combined with the analysis of torsion test curves is an adequate technique to verify the occurrence of static interpass recrystallization during simulation of finishing hot rolling in a Steckel mill.
-
(2) Interpass recrystallization of the AISI 430Nb ferritic stainless steel is optimum at temperatures of 930–870 °C (simulation 5) and 900–840 °C (simulation 6).
-
(3) The work hardening from the last two passes of deformation can favor the occurrence of recrystallization in the annealing stage after finishing hot rolling.
-
(4) Microtexture results obtained in the present work concur with those reported in previous studies.
-
(5) Results obtained in this work could contribute to the improvement of the established practice of hot rolling.
ACKNOWLEDGMENTS
The authors would like to thank CBMM for the financial and technical support, to Aperam South America for the technical support and for providing the material for this study, Dr. Marco Antônio da Cunha for the technical discussions and to LNNanno at CNPEM, where EBSD analyses were performed. FVB and MSA would also like to thank the CNPq and CAPES institutions for granting academic scholarships.