Introduction
GaN is a promising material for the construction of blue laser diodes, ultrahigh power switches or UV photo detectors and much information about the growing of GaN and device processing was gathered during the last years and is summarized in recent published review articles [Reference Pearton, Zolper, Shul and Ren1,Reference Ambacher and Phys2]. Ge and Se are promising candidates to act as donors in GaN, and calculations predict a much higher doping efficiency for Ge than Si, the commonly used donor in GaN [Reference Park and Chadi3,Reference Boguslawski and Bernholc4]. Arsenic is suspected to compensate charge carriers after ion implantation [Reference Metcalfe, Wickenden and Clark5], in spite of being isoelectronic to N. The energy levels of these impurities have been first optically determined by Pankove et al. [Reference Pankove and Hutchby6]. As was found to produce a broad PL band centered at 2.58 eV, in agreement with results from Metcalfe et al. [Reference Metcalfe, Wickenden and Clark5] and Li et al. [Reference Li, Kim, Reuter, Bishop and Coleman7]. A deep PL band at 1.59 eV was assigned to Se, but recent results only report on enhanced DAP recombination at 3.278 eV [Reference Yi and Wessels8] or an increasing yellow luminescence [Reference Chen, Chen, Lee and Feng9] after doping GaN with Se. An increase of the UV emission (3.2 eV) and the yellow luminescence (2.2 eV), but no additional transitions, was observed in Ge doped or implanted samples [Reference Pankove and Hutchby6,Reference Nakamura, Mukai and Senoh10]. But one has to take into account that PL spectroscopy is not able to determine the chemical nature of a defect. Hence, a chemical identification of a defect is difficult and the assignments are sometimes controversial. One way out of this dilemma is to use element specific properties, like the half-life of a radioactive isotope undergoing a chemical transmutation. If an optical transition is due to a defect in which the parent or daughter isotope is involved, the concentration of that defect will change with the half-life of the radioactive decay. Finally, the change in the defect concentration then shows up in the PL intensity of the corresponding transition [Reference Magerle, Burchard, Deicher, Kerle, Pfeiffer and Recknagel11,Reference Stötzler, Weissenborn and Deicher12].
Another important class of intrinsic defects in III-V semiconductors is antisites. Theoretical investigations of Jenkins et al. calculate the GaN antisite level at 0.7 eV above the valence band [Reference Jenkins and Dow13], in agreement with the predictions of Tansley et al. [Reference Tansley and Egan14]. In contrast to these results, Boguslawski et al. [Reference Boguslawski, Briggs and Bernholc15] calculate the GaN antisite level at around EV +1.4 eV, and Neugebauer et al. state that antisites in GaN are energetically less favorable [Reference Neugebauer and Van der Walle16] than in other III-V semiconductors. As shown by Magerle et al. [Reference Magerle, Michel, Kennedy, Wada and Thonke17], another advantage of radioactive isotopes in PL experiments is the chance to create antisites intentionally with suitable isotopes. We report on experiments with the isotope 71As, which decays via 71Ge into stable 71Ga. Provided that after implantation and annealing all 71As occupies a N site and no site changes are taking place during the decay, then all 71Ga atoms form GaN antisite defects. The aim of this report is the unequivocal chemical assignment of optical transitions found in As, Ge, and Se doped GaN, and to investigate the existence of optically active GaN levels.
Experimental
Nominally undoped GaN layers (n ≈ 5 × 1016cm−3) grown by metal organic vapor phase epitaxy (MOVPE) on AlN/c-sapphire substrate by Cree Research were implanted either with radioactive 72Se or 71As. The implantations were carried out at the on-line mass separator ISOLDE at CERN with an energy of 60 keV and a dose of 3 × 10¹² ions/cm2. The ions end up within a Gaussian shaped profile centered at 21 nm depth with a width of 10 nm and a peak concentration of about 2 × 1018 cm−3. To serve as reference, a small part of each sample was not implanted. The implantation induced damage was reduced by annealing the samples at 1270 K for 10 min in sealed quartz ampoules filled with nitrogen gas at a pressure of 1 bar at room temperature. The isotope 72Se transmutes via the decay chain 72Se (8.4 d) → 72As → (26 h) into stable 72Ge while the isotope 71As (64.28 h) first decays into 71Ge (11.43 d), which finally transmutes into stable 71Ga. The half-life of each decay is given in parentheses. These chemical transmutations were monitored by PL spectroscopy at 4 K using a He flow cryostat. The 325 nm line of a HeCd-laser with an excitation density of 160 Wcm−2 was used to excite the samples. The luminescence was dispersed with a 0.75 m monochromator and detected with a cooled GaAs-photomultiplier.
Results and Discussion
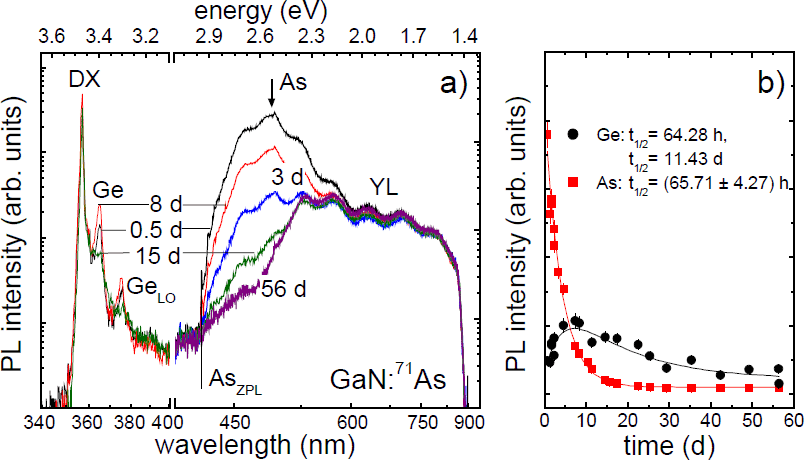
Figure 1a shows a selection of the 22 recorded PL spectra of 71As-doped GaN successively taken within 56 days after ion implantation and annealing. The spectra are not corrected for the spectral response of the measurement system. The common features of all spectra are the transition DX at 3.471 eV resulting from a donor-bound exciton [Reference Viswanath, Lee, Yu, Kim, Choi and Hong18] and the broad band centered at 2.2 eV labeled with YL, known as the “yellow luminescence” in GaN [Reference Chen, Chen, Lee and Feng9]. The spectrum recorded 12 hours after implantation shows clearly a new broad and intense PL band centered at 2.58 eV, in contrast to the unimplanted part of the sample (not shown). In addition, a new transition labeled with Ge at 3.398 eV and its LO phonon replica Ge-LO at 3.306 eV can be seen. The intensity of the PL band at 2.58 eV decreases continuously during the whole measuring period, in contrast to the intensities of the PL transitions at 3.398 eV and 3.306 eV. Within the first eight days after implantation the intensity of these transitions increases before this trend changes into a decrease of the PL intensity of these lines after nine days. Finally, after 56 days no luminescence at 2.58 eV and only weak luminescence at 3.398 eV can be detected. A comparison with the radioactive decay chain of the isotope 71As clearly shows that the decreasing PL band at 2.58 eV has to be correlated with As, in agreement with earlier assignments [Reference Metcalfe, Wickenden and Clark5-Reference Li, Kim, Reuter, Bishop and Coleman7]. The transition at 3.398 eV and its phonon replica can only be explained by a recombination center involving Ge. A detailed analysis of the time dependence of the PL intensities of the As and Ge transitions delivers information about the involved number of As or Ge atoms, respectively. For such an analysis, it is necessary to eliminate intensity variations due to inhomogeneous samples or experimental limitations, like focusing reproducibly onto the entrance slit of the monochromator, by a suitable normalization. The selection of a normalization point requires that the normalization point itself shows no time dependency and does not overlap with the questioned transitions. For this reason, all spectra were normalized to the same intensity at 1.59 eV.
a) PL spectra of 71As doped GaN recorded at 4 K between 0.5 d and 56 d after implantation and annealing. All spectra are normalized to the intensity at 1.59 eV. b) Normalized PL intensity of the As (squares) and Ge (circles) related transitions in GaN as a function of time. The solid lines correspond to exponential fits to the data using equations 1 and 2.

In figure 1b, the integral PL intensities of the As and Ge related PL transitions are plotted as a function of time. The solid lines correspond to exponential fits to the data using equations 1 and 2:


For the As-band the fit yields a half-life of


An additional experiment was performed to determine if Se creates an optically active recombination center and to check again the previous results. A GaN sample was doped with 72Se, which decays via 72As into stable 72Ge. Figure 2a shows four of the 15 PL spectra of the 72Se doped GaN recorded within 50 days after implantation and annealing. As in the previous experiment, all spectra have the DX transition and the yellow luminescence band YL in common. The spectrum recorded one day after implantation shows a new PL band centered at 1.49 eV. Also, the same PL transitions are observed as in the previous experiment, namely the As band centered at 2.58 eV and the Ge transition at 3.398 eV and its phonon replica (Ge-LO). All spectra have been normalized to the PL intensity at 1.83 eV. Within the 50 days, the PL intensity of the 1.49 eV transition and the intensity of the As band are decreasing while the intensities of the Ge related transitions (Ge and Ge-LO) are increasing continuously. Also these results clearly show the involvement of As in the 2.58 eV band and Ge in the 3.398 eV transition. Furthermore, the 1.49 eV emission has to be caused by a recombination center involving Se. Since As is the daughter isotope of Se, one expects that the intensity of the As band increases first, and decreases after the maximum As concentration is reached. Here, the As band starts to decrease immediately without a preceding increase. This result is not surprising, since during the 72Se implantation a fraction of 72As atoms was co-implanted due to the decay of 72Se in the implantation ion source itself. Hence, 72As and even 72Ge are still present in the ion beam and cannot be separated by the separation magnet. One also has to keep in mind that the half-life of As is much smaller than the half-life of Se. After two days, the initial implanted As concentration can be neglected, leading to the same time constant

a) PL spectra of 72Se doped GaN recorded at 4 K between 1 d and 50 d after implantation and annealing. All spectra are normalized to the intensity at 1.83 eV. b) Normalized photoluminescence intensity of the Se (squares), As (up triangles), Ge (circles), and Ge-LO (down triangles) transitions in GaN as a function of time. The solid lines correspond to exponential fits using equation 1.

Figure 2b shows the normalized PL intensities of the Se, As, Ge and Ge-LO transitions as a function of time after implantation. The solid lines represent exponential fits to the data using fitting functions similar to equation 1. The fits yield half-lives of


In figures 1a and 2a, a small peak denoted with AsZPL at 2.945 eV can be detected, followed by a series of less well resolved peaks, each separated by the energy of a LO phonon (92 meV) on the high energy side of the As band. This substructure is additional evidence for this assignment. Unfortunately, the recoil energy (140 eV) transferred to the 72Ge nucleus is again sufficient for a site change of the 72Ge. Furthermore, our results do not agree with the GeN level (EV+0.4 eV) calculated by Jenkins et al. [Reference Jenkins and Dow13], which is too high, compared with our results. Hence, it is not yet definitely clear if the Ge transition is caused by a GeGa or GeN defect.
Conclusion
In conclusion, using radioactive isotopes we have proven that the PL emission centered at 2.58 eV is caused by a recombination center involving one As atom located on a N site. Se is found to produce a luminescence band centered at 1.49 eV and Ge introduces a PL transition at 3.398 eV. In both cases, only one Se or Ge atom, respectively, is involved in the defect center. Furthermore, we do not observe any transition related to the GaN antisite.
Acknowledgements
This work has been supported by the Bundesminister für Bildung, Wissenschaft Forschung und Technologie under Grant No. 03-DE5KO1-6.