I. INTRODUCTION
In the course of material development, it exhibits a rising trend of chemical complexity versus time, in other words, materials are gradually developed from the initial simple system to multiple components. High-entropy alloys (HEAs) are a kind of solid-solution alloys composed of multiprincipal elements in equal or near-equal atom ratio (at.%).Reference Yeh, Chen, Lin, Gan, Chin, Shun, Tsau and Chang1–Reference Cantor, Chang, Knight and Vincent4 Initially, it is loosely cognized that alloy incorporation into more than five-principal elements possessed high mixing-entropy (e.g., CoCrFeNiMn,Reference Cantor, Chang, Knight and Vincent4 AlxCoCrFeNi,Reference Zhou, Zhang, Wang and Chen5 and Al0.5CoCrCuFeNiReference Hemphill, Yuan, Wang, Yeh, Tsai, Chuang and Liaw6). With further development, the concept of quaternary, ternary, and nonequal atomic ratio HEAs has been proposed (e.g., CoFeNiAlx,Reference Zuo, Li, Ren and Zhang7 NbMoTaW,Reference Senkov, Wilks, Miracle, Chuang and Liaw8 FeCoCrNi,Reference Lucas, Wilks, Mauger, Muñoz, Senkov, Michel, Horwath, Semiatin, Stone, Abernathy and Karapetrova9 and ZrNbHfReference Guo, Dmowski, Noh, Rack, Liaw and Egami10). From the perspective of entropy, many alloys reported with special properties have medium value of entropy, e.g., stainless steels, high speed steels, super alloys, bulk metallic glasses, Al–Mg alloys, etc.; thus, the medium-entropy alloys usually define as the entropy of mixing with a value of entropy of 0.69R to 1.61R, where R is the gas constant. Both alloys with medium entropy and high entropy can be collectively referred to as multiple component materials.
Statistics show that approximately 25 kinds of elements used for the design of multiple component materials. Using the combinatorial computing:  $C{n \over m}$, where m ≈ 25 and n means the number of components (n = 3, 4, 5, 6, 7, …), there are at least 1.8 million various systems. Obtaining better performance through adjusting the proportion of the components is a common approach in the research. For a given alloy system incorporation with n components, each component varies 10 points of content (0.1–1), and 10n various compositions will be obtained. Compared with traditional materials, the design and preparation of multiple component materials are more complicated. It is undoubtable that the verification of various systems is a huge workload through the traditional approach. Since the discovery of new materials is a time-consuming and inefficient process, “trial and error” is still the main approach. Few theoretical calculations can predict the structure and performance of materials, especially for such complex materials. There needs a more effective approach to screen multi-principal materials with ideal phase structure and performance, and the preparation of material library is the first step. To date, the techniques of parallel preparation have been applied into materials in various forms such as films,Reference Yan, Li, Zhang and Zhang11 bulks,Reference Li, Liaw and Zhang12 particles, and fluid.Reference Yao, Huang, Xie, Lacey, Jacob, Xie, Chen, Nie, Pu and Rehwoldt13 Among them, the film methods are not limited by the number of components; thus, it is more suitable for the parallel preparation of multicomponent materials. In the field of semiconductors, film technologies have been applied to the synthesis of composite material samples, such as continuous moving mask,Reference Chang, Takeuchi and Xiang14–Reference Mao17 discrete mask,Reference Jin, Fukumura, Kawasaki, Ando, Saito, Sekiguchi, Yoo, Murakami, Matsumoto and Hasegawa18–Reference Sun, Gao, Wang and Xiang20 and multitarget co-sputtering.Reference Hanak21–Reference Ding, Liu, Li, Liu, Sohn, Walker and Schroers24 High-entropy films (HEFs) are a class of alloy films developed on the basis of HEAs and feature the similar scientific concept to HEAs.Reference Huang, Chen, Lui, Cai and Yeh25–Reference Ye, Feng, Li, Lu, Li, Huang and Wu27 Hence, it is an effective way to obtain the high-entropy composition gradient materials through the preparation of HEFs.
The purpose of this study is to find a combinational synthesis approach for multiple component materials through the multitarget deposition technique. In this paper, the Ti–Al–Cr–Fe–Ni system alloys with compositional gradient were synthesized by multitarget co-sputtering in a pseudo-ternary Ti–Al–(Cr, Fe, Ni) system. In the process of co-sputtering, using the spatial gradients between targets and substrates, spatial variations in the composition can be obtained, and ultimately a compositional gradient was exhibited on the substrate.
II. EXPERIMENT PROCEDURES
A. Parallel preparation
The Ti–Al–Cr–Fe–Ni system material library was synthesized by magnetron co-sputtering using Al, Ti, and CrFeNi targets with a diameter of 50 mm and a thickness of 3 mm. Both targets of Al and Ti have a purity of 99.995% and the composition ratio of CrFeNi target was 1:1:1. The target distribution has been chosen for the following reasons: (i) Atomic radius: elements with larger difference in atomic radius should be prepared as single element target. On the contrary, the alloy target can be considered. (ii) sputtering yield: the sputtering yield of Al is low, and a large area is necessary to reach the required ratio.Reference Kimblin and Lowke28 (iii) Physical properties: both Fe and Ni are ferromagnetic elements. The target built with two magnetic elements can avoid the local perturbation of the permanent magnetic field.
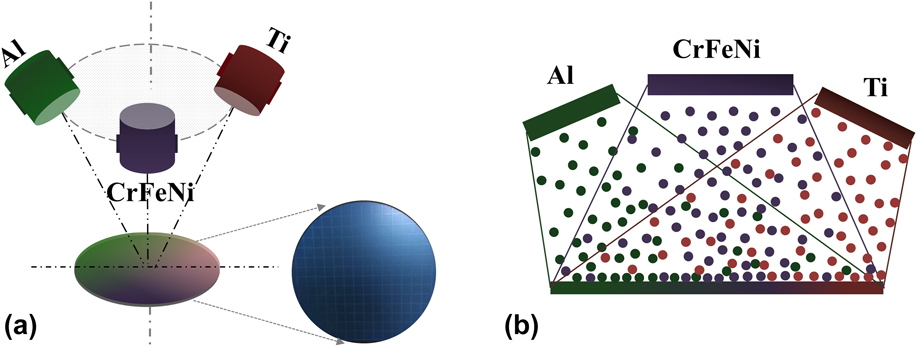
Three targets were 120° apart and focused on stable silicon-oxide-coated silicon wafer (p-Si (1 0 0) wafers with a diameter of 6 inches), and the schematic diagram is shown in Fig. 1(a). It is well known that the angle of sputtered atoms leaving the target surface is a simple cosine distribution, and a certain inclination angle will exist between the targets and substrates in the process of deposition. Using the spatial gradients between three targets to substrates, spatial variations in the composition can be obtained and exhibited on the substrates [Fig. 1(b)]. Before deposition, the substrate was divided into small squares with an area of 1 cm2 through laser beam cutting to facilitate the characterization of the material library. Cutting is done on the back side of the substrate, and semipermeable cutting is required to ensure the integrity of the front surface of the substrate. Removing incomplete squares in edges, there were 144 small squares on a Si substrate, and each square was treated as an independent sample point for the material library, so-called “sample unit”. In other words, 144 independent sample units with different compositions can be obtained for one time. The specific cutting depth and other parameters of the Si substrates are shown in Table I.
Schematic diagram of multitarget co-sputtering: (a) three-dimensional view co-sputtering and (b) front view and the process of deposition.

Parameters of substrates.

Pre-sputtering is a necessary step way to remove oxide or contaminants on the surface of the target. When the base pressure was held at 2.0 × 10⁻⁴ Pa, the high purity argon was injected into the vacuum chamber, and targets were cleaned by argon ion bombardment for 15 min at a power of 100 W. The material library was synthesized in Ar atmosphere with a working pressure of 0.8 Pa, the flow rate of Ar was maintained at 60 standard cubic centimeters per minute (sccm). The work distance was 60 mm, and the deposition time was kept 60 min. The working power of Al, Ti, and CrFeNi targets were 120 W, 100 W, and 100 W, respectively. It should be noted that Al with low deposition yield requires a higher work power to maintain the element content. To ensure an efficient sputtering process, the CrFeNi target was equipped on an alternating current power with strong magnetic field, while both Al and Ti targets were equipped on a direct current power.
B. Material library characterization
The composition content of the material library (TixAly(CrFeNi)1−x−y) was carried out using an energy dispersive X-ray spectrometer (EDS) which equipped on field-emission scanning electron microscopy (SEM) (Auriga Field Emission Scanning Electron Microscope, Carl Zeiss, Jena, Germany). The crystal structure of sample units was analyzed by using a glancing-incidence (1°) X-ray diffractometer (XRD, BRUKERD8 Discover, Bruker, Beijing, China) using the Cu Kα radiation at a scanning rate of 4°/min. The scanning step was 0.02°, and the scanning range was 20–80°. The surface roughness of the coatings was obtained by using an atomic force microscope (AFM, Veeco DI-3100, Bruker, Beijing, China). The hardness of the sample units was tested five points at different places with a nanoindenter and a Berkovich triangular pyramid indenter, and the distance between each indentation was 50 μm. To avoid the effect of the substrate on hardness, the maximum displacement into the sample surface was 400 nm.
III. RESULTS AND DISCUSSION
A. Composition gradient analysis
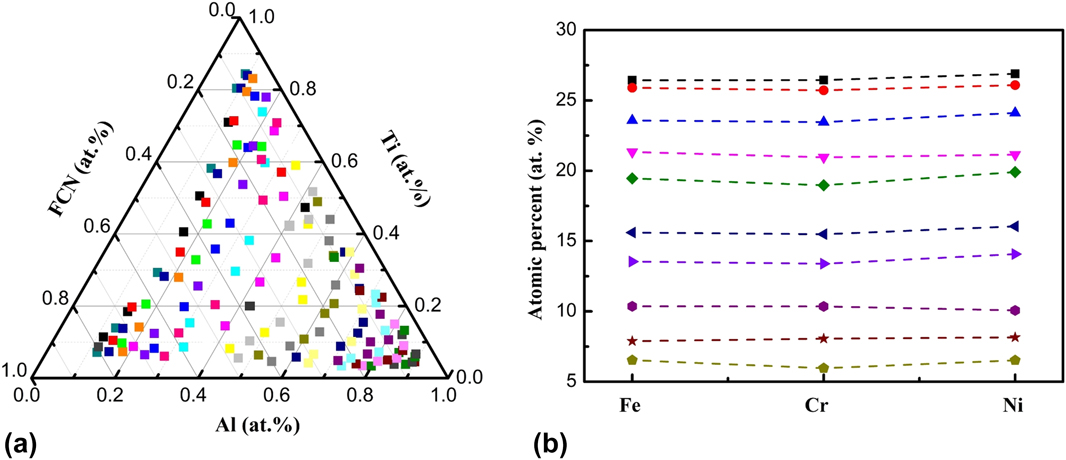
The material library exhibited a high coverage of composition. The distribution of 144 sample units is shown in Fig. 2(a), and the content of Al and Ti varies from 9.06 at.% to 89.25 at.% and 3.34 at.% to 84.39 at.%, respectively. The total content of FeCrNi varies from 4.36 at.% to 79.61 at.%. Compared with the edge, sample units sparsely distributed in the center of Fig. 2(a), and the larger composition gradient in unit length is easily obtained in this area. Through the quantitative analysis, it was found that the maximum value of composition gradient reaches ∼13 at.%/cm. In the section of experiment procedures, it has been elaborated that Fe, Cr, and Ni were melted into an alloy target. The 10 sample units were selected randomly from the 144 sample units, and it was found that the content of Fe, Ni, and Cr exhibited a ratio of equal-atomic. The content relationship of Cr, Fe, and Ni is demonstrated in Fig. 2(b). The phenomenon proves that utilizing different inclination angles between targets and substrates is an effective way to obtain composition gradient of multicomponent materials.
EDS element contents in the material library: (a) the content distribution of 144 sample units and (b) relationship between the Fe, Cr, and Ni element content (near-equal atomic ratio).

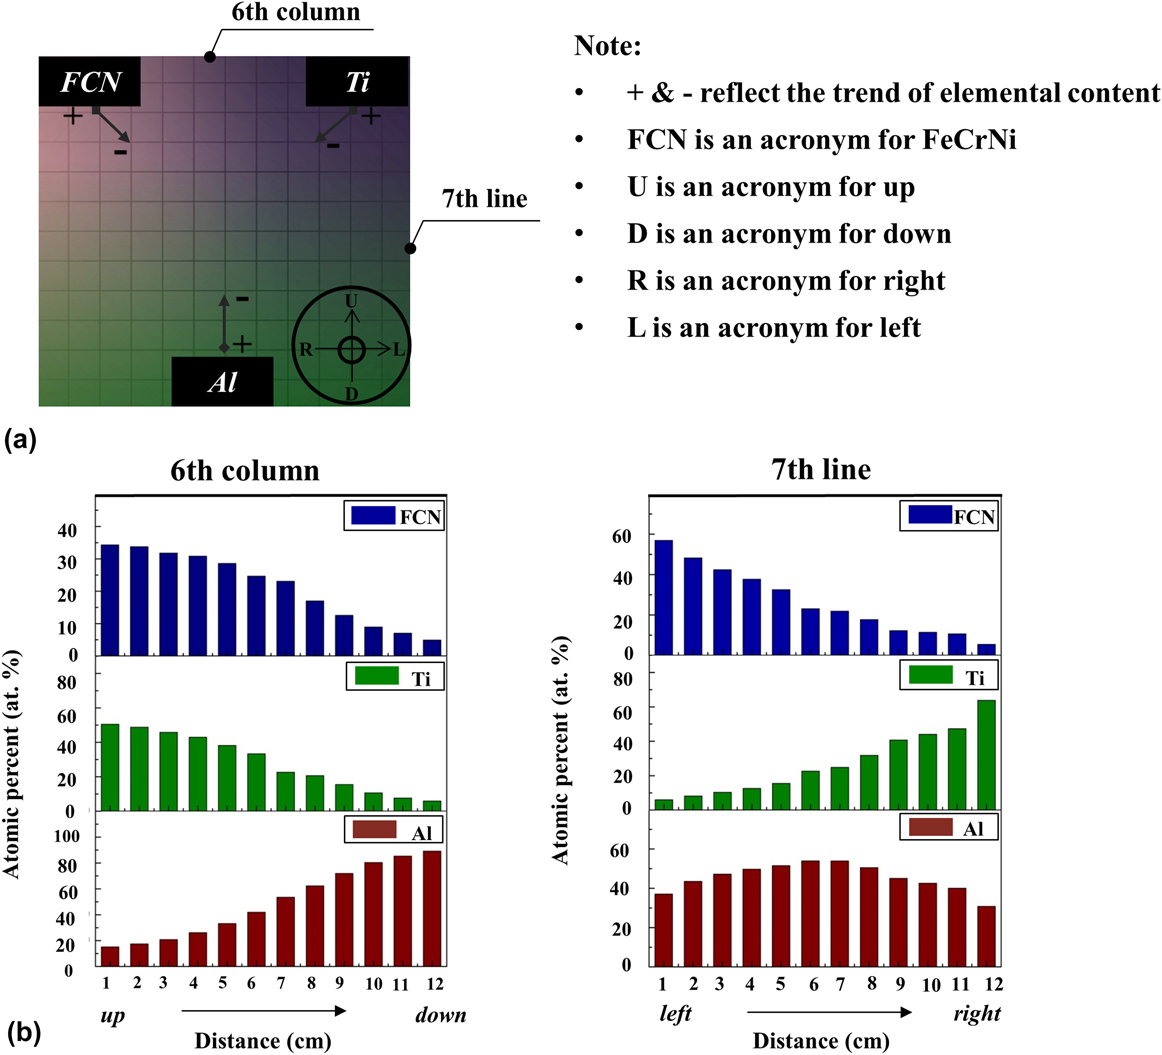
With simultaneously sputtering of the three targets, a composition gradient of Ti–Al–CrFeNi was obtained. Figure 3 illustrates the trend of element content from macro and specific direction. It should be noted that the trend of element content is summarized by targets as reference objects. The macro trend of element content is shown in Fig. 3(a), and the gradual changing color characterizes the gradient of the elemental content. It can be observed that element content decreases toward the periphery with the deposition source as the center. Taking the sixth column and the seventh line as an example, the trend of element content in line and column is shown in Fig. 3(b). In the sixth column, from top to bottom, the sample units move away from the both CrFeNi and Ti targets gradually, and close to the Al target. A tendency in S-curve rising and falling is observed. In the seventh line, from left to right, the sample units are far away from CrFeNi and close to the Ti target, showing a tendency in concave curve falling and rising for CrFeNi and Ti content, respectively. For the Al target, there is a tendency for the convex curve to rises first and decreases subsequently, which corresponds to the change in distance. In repeated experiments, as long as the relative position between the targets does not change, the composition gradient has a high degree of consistency when targets are used as reference objects.
Trend of elements’ content: (a) macro trend and (b) specific trend (taking 6th column and 7th line as example).

B. Homogeneity of material library
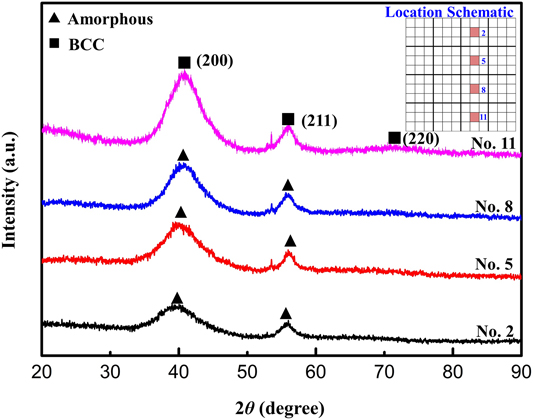
Homogeneity is an important criterion for assessing whether a material library can be used as a high-throughput screening platform. By characterizing the continuous transition of the structure and surface topography between adjacent sample units, the homogeneity of the material library can be determined. Four sample units located on internal of material library were selected for structure and surface topography characteristics. Figure 4 presents the XRD patterns of the sample units, and the location is shown in the internal map. With the slight change of element content, the intensity of diffraction peaks gradually increases and shows a crystallization trend [from amorphous to body-centered cubic (BCC)]. Gradual change can be observed between the four nearby sample units, which indicates that the change in composition of the material library is continuous and stable.
XRD patterns of the four nearby sample units in the material library (amorphous & BCC).

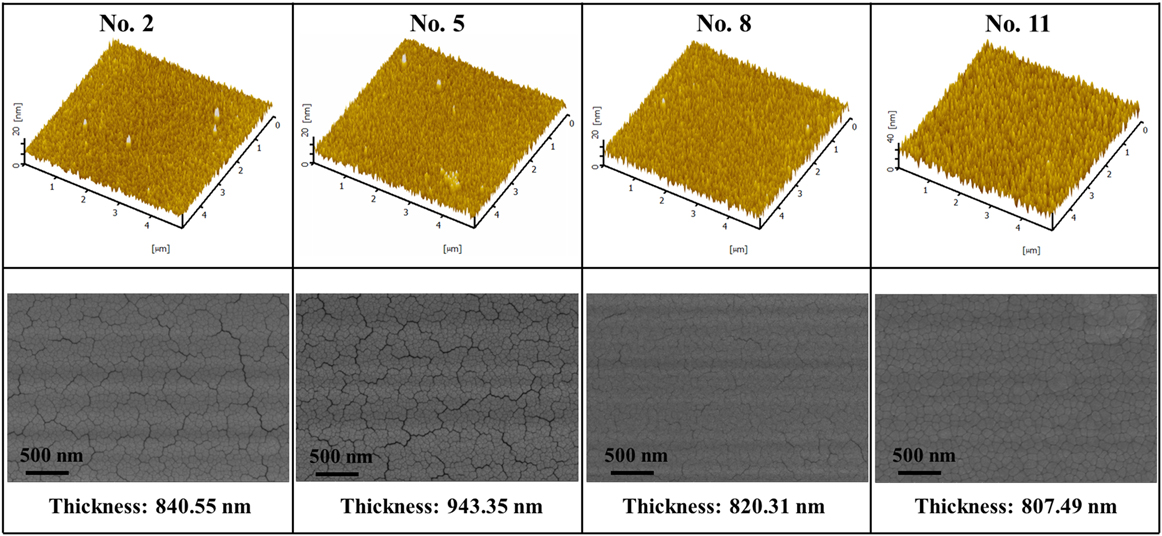
Figure 5 shows the AFM images and SEM micrographs of the four sample units mentioned above. AFM images present a uniform surface topography, and needle-like structures are observed in sample units. From No. 2 to No. 11, there is an increasing trend for the size of the needle-like structure. According to the full width at half-maximum (FWHM) in Fig. 4, the trend of grain size can be estimated using the Scherrer’s formulaReference Arrhenius29:
 $$D = {{K\lambda } \over {B\cos \theta }}\quad ,$$
where K is the dimensionless shape factor, λ is the X-ray wavelength, and B and θ are FWHM and diffraction angle, respectively. As the FWHM observed in the XRD pattern decreases, the size of the grain increases correspondingly. This trend is consistent with the phenomenon exhibited by AFM and SEM. From SEM micrographs, the cracks are distinguished as well in the No. 2 and No. 5 samples. Stress caused by the thickness difference is the main reason for the cracks. The thickness of sample units is shown in Fig. 6. The No. 5 sample unit had the largest thickness, which caused higher internal stress and contributed to the appearance of cracks. With the decrease in thickness, the cracks gradually reduce until they completely disappear.
AFM images and SEM micrographs of four nearest sample units (the relative location of four sample units is the same as Fig. 4).

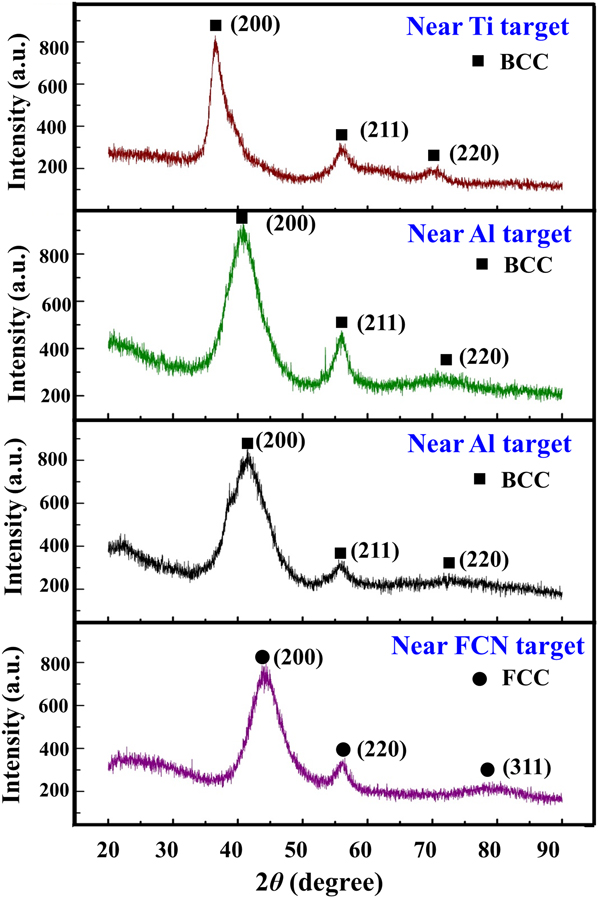
XRD patterns of the four boundary sample units in the material library.

C. Phase structure and mechanical property screening
Based on the material library, preliminary screening of the phase structure and properties was performed. Four boundary sample units near the targets exhibit different phase structures in Fig. 6. All the sample units are crystal: FCC structure near the CrFeNi target and BCC structure near the Ti and Al targets. Due to the high cooling rate caused by direct deposition on silicon wafer without substrate heating, the crystallization ability of the sample unit is not high. Significantly, there is a clear phase structure difference between the selected sample units. The results can help us achieve a rapid screening of the ideal phase structure. For the Ti–Al–CrFeNi system, the formation ability of BCC solid-solution was improved with the increasing content of Al and Ti. Correspondingly, the formation ability of BCC solid-solution was improved as increasing content of CrFeNi.
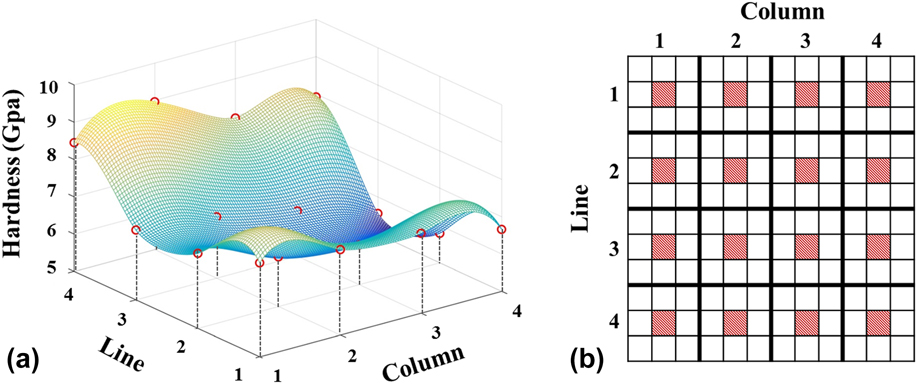
The fixed-point sampling method is an effective way to screen the excellent mechanical property from many sample units. To ensure the representativeness, the material library was divided into 9 parts, and the central sample unit of each part was taken for characterization of mechanical property. The hardness of sample units and location are shown in Fig. 7. It can be observed that the 4th line showed a highest hardness, which corresponds to sample unit incorporation into higher Al content with BCC structure. Contrast in landscape (in line direction), sample units in Ti-rich regions show a higher hardness than those in CrFeNi-rich regions. It is consistent with the cognition that materials with BCC structure possess higher hardness. The trend of hardness can give a direct guide to screen the areas with excellent mechanical properties.
Mechanical properties (a) hardness fitted by MATLAB and (b) location schematic diagram of selected sample units.

IV. DISCUSSION
Utilizing the nonuniform deposition resulted in spatial gradient of sputtering sources relative to the substrate, multicomponent materials with composition gradient can be obtained in once deposition. 144 sample uints were separated from a substrate and used to characterize composition distribution, phase structure, and properties. The material library exhibits a high coverage of composition in the Ti–Al–CrFeNi system. Actually, the material library synthesized in this study can be divided into more than 144 various composition samples. Through the quantitative analysis of ingredients, it was found that the maximum value of compositon gradient of Al, Ti, and FeCrNi reached 13.71 at.%, 14.89 at.%, and 12.07 at.% per centimeter, respectively. However, the minimum value of the composition gradient was about 2 at.% per centimeter. The difference between maximum and minimum proved that the distribution of composition gradient obtained by co-sputtering exhibited a nonlinear change. In Fig. 2(a), it can be observed that composition points distributed at the center area are sparse, while the composition points are dense in the edge. It needs to be noted that the points at the center of Fig. 3 represent alloy incorporation with equal or near-equal atomic ratios (the ratio between Al, Ti, and CrFeNi equals or near-equals 1:1:1), which correspond to sample units deposited and formed at the center of the substrate. The center of the substrate is the farthest area away from the three targets; thus, the lowest deposition yield per unit area will be harvested in this area, which ultimately results in a larger composition gradient, and the distribution of composition point is sparse. In other words, the inhomogeneity of the spatial gradient leads to the inhomogeneity of the composition gradients.
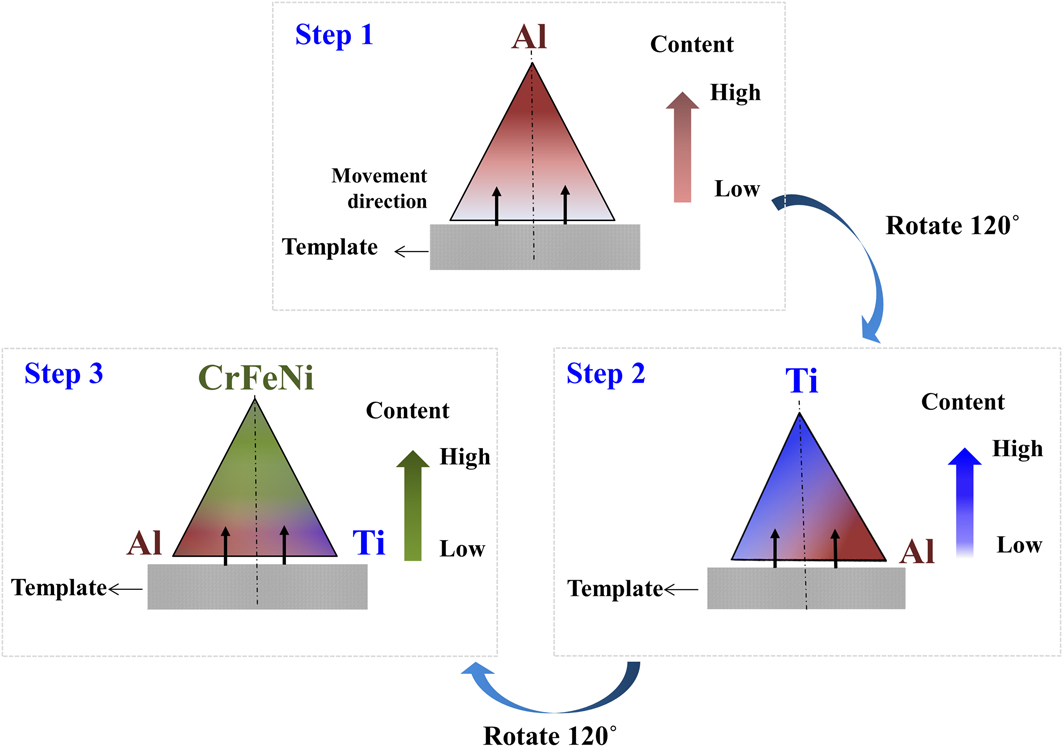
In the following work, adding a template to solve the problem of composition gradient nonuniformity can be considered, and the schematic diagram is shown in Fig. 8. The template moving over time is installed upon the substrate, and the substrate is covered from bottom to top gradually. Hence, a thickness gradient (i.e., the deposition yield gradient) is obtained on the substrate. Significantly, the composition gradient can be controlled by the moving speed. Rotate the substrate 120° after the deposition of a material and other materials are deposited in the same approach. A multilayer film with a continuous composition gradient in the direction of movement is obtained. A series of post-processing can facilitate the processes of diffusion and homogenization in the material library, such as thermal diffusion, ion beam cladding, etc. Ultimately, the material library with composition gradient in the direction of movement will be obtained.
Schematic diagram of the continuous masking method.

The material library synthesized in this study exhibits three different phase structures: amorphous, BCC, and FCC. Overall, sample units in Al-rich and Ti-rich regions tend to form BCC structures, while the sample unit in the CrFeNi-rich region tends to form the FCC structure. Compared to the substrate in the vicinity of the target, the central area of the substrate where far from targets shows an amorphous structure. The screening results can provide an intuitive demonstration of the phase formation ability for the Ti–Al–Cr–Fe–Ni system. Moreover, sample units with BCC phase structure possess higher hardness than FCC. The Al-rich region has shown a higher hardness in the whole system and the Ti-rich region is followed. Hence, for the Ti–Al–Cr–Fe–Ni system, the composition with high-strength should be found in both the regions.
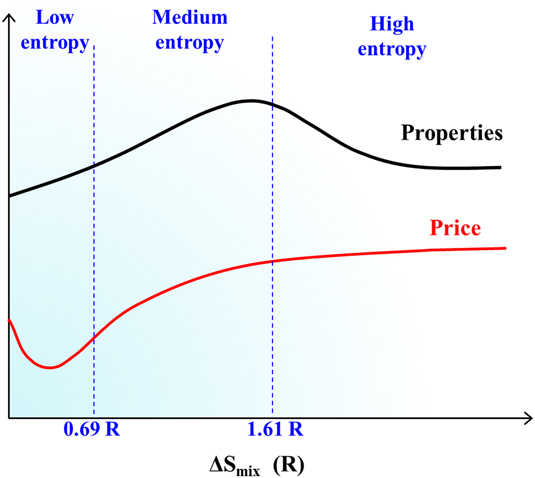
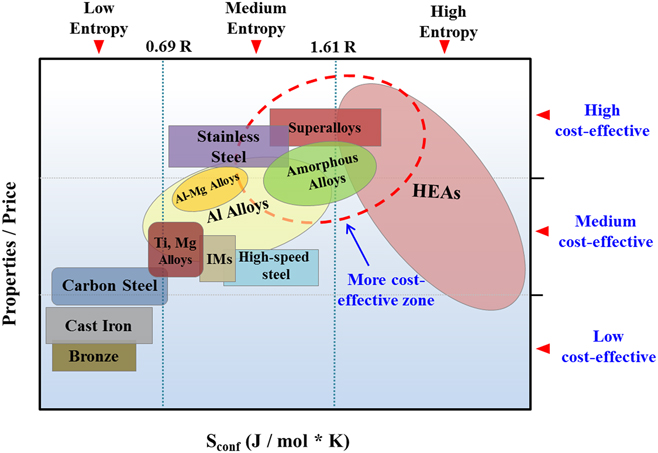
In general, the entropy value of 1.61R is cognized as the boundary between medium-entropy zone and high-entropy zone. With the further development of HEAs, it is found that alloys with multiple component solid-solution structure can be obtained when satisfied the two following conditions: (i) ∆S mix plays a major role when Ω > 1.1 in the molten state (where Ω = T m∆S mix/|∆H mix|) and (ii) ∆S mix ≥ 1.5R. Thus, the formation region of solid-solution also contains the medium-entropy zone. Both alloys in the medium-entropy zone and high-entropy zone can be collectively referred to multiple component materials. To date, multiple component materials with medium entropy exhibit a good development potential in engineering applications. Many special properties of alloys with medium entropy have been reported, such as high hardness, high-temperature resistance, corrosion-resistance, wear-resistance, anti-oxidant, etc.Reference Zhang, Zuo, Tang, Gao, Dahmen, Liaw and Lu2,Reference Shafeie, Guo, Hu, Fahlquist, Erhart and Palmqvist30–Reference Li and Zhang32 Apparently, there is a nonlinear relationship between the entropy and properties, and the same relationship also exists between entropy and price, which is implied in Fig. 9. The alloys in the medium entropy zone possess both low-price and excellent properties. Figure 10 illustrates the relationship between the price/properties ratio and the entropy of the common materials. More cost-effective alloys usually exist in the junction of medium-entropy and high-entropy zones, which will be the key region for material development in future. Compared with traditional materials, the design and preparation of medium-entropy alloys are complicated and less efficient. Thus, the development of high-throughput technologies is more significant.
Trend of properties and price of alloys with different entropies.

Relationship between the price/property ratio and the entropy for the common materials (IMs: intermetallics or metallic compounds, HEAs: high-entropy alloys).

V. CONCLUSION
The work described above proposed a parallel preparation to multiple component materials. The material library synthesized in this method is stable and homogenous and exhibits a large coverage of the Ti–Al–CrFeNi system in various compositions. High-throughput technology is urgently needed for the multiple component materials, and the synthesis of materials with composition gradient is the key step for high-throughput screening. For such multiple component materials, approach combined with multitarget deposition is an effective way to achieve the parallel preparation.
ACKNOWLEDGMENT
Y. Zhang would like to thank the financial supports from the National Science Foundation of China (NSFC, Granted Nos. 51471025 and 51671020).