Introduction
Optoplasmonic materials that integrate photonic microresonators and plasmonic nanostructures into a hybrid on-chip platform are attractive building blocks for light and information processing.[ Reference Hong, Ahn, Boriskina, Zhao and Reinhard 1 – Reference Chamanzar and Adibi 4 ] Of particular interest are optoplasmonic structures that contain dielectric microspheres that trap light by excitation of low-loss whispering gallery modes (WGMs) and plasmonic nanoantennas that localize the guided light in the evanescent field of microspheres arranged in a pre-defined geometry.[ Reference Ahn, Boriskina, Hong and Reinhard 5 , Reference Ahn, Hong, Boriskina and Reinhard 6 ] This hybrid approach can take full advantage of the strengths of individual components for complementing each other's functionalities with the aim to overcome limitations inherent to each individual component. Dissipative losses in metals are mitigated by high-Q photonic modes of dielectric microresonators, and in return, photonic modes that are otherwise inaccessible to the environment are enhanced by strong E-fields localized on the surface of plasmonic nanostructures.[ Reference Ahn, Boriskina, Hong and Reinhard 5 ] Synergistic interactions between photonic and plasmonic resonators have shown to create additional functionalities such as adaptive spectral and spatial control,[ Reference Boriskina and Reinhard 7 ] frequency switching of nanoscale fields,[ Reference Boriskina and Reinhard 8 ] and long-range energy transfer to excite quantum emitters located several micrometers away from the light source.[ Reference Ahn, Zhao, Hong and Reinhard 9 ] All of these functionalities are difficult to achieve with “pure” plasmonic or photonic structures. Another interesting characteristic of the optoplasmonic structures is that they provide new opportunities for modulating the shape and intensity of the near- and far-fields through photonic–plasmonic mode coupling.
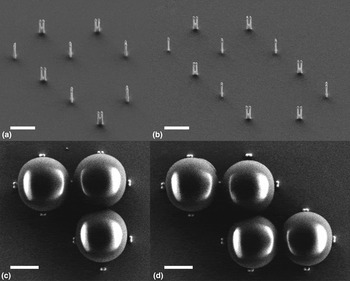
Although the advantages of optoplasmonic structures have been clearly documented by a series of theoretical studies,[ Reference Chamanzar and Adibi 4 , Reference Haddadpour and Yi 10 – Reference Arnold, Dantham, Barbre, Garetz and Fan 13 ] only a limited number of discrete optoplasmonic structures have been experimentally realized. The latter is in part, due to the lack of robust fabrication strategies. The major challenge in fabrication results from a large size mismatch between nanometer-scale plasmonic and micrometer-scale photonic components. For this reason, most current photonic–plasmonic hybrid approaches rely on a direct attachment of plasmonic nanoparticles (NPs) to the surface of photonic crystals,[ Reference Barth, Schietinger, Fischer, Becker, Nüsse, Aichele, Löchel, Sönnichsen and Benson 2 , Reference Zhang, Callard, Jamois, Chevalier, Feng and Belarouci 3 ] dielectric microspheres,[ Reference White, Oveys and Fan 14 – Reference Santiago-Cordoba, Boriskina, Vollmer and Demirel 16 ] or toroidal microcavities,[ Reference Shi, Choi and Armani 17 ] using atomic-force microscope tips, chemical functionalization, or multi-step top-down lithography. To address this fabrication challenge we have recently developed a new three-dimensional nanofabrication technique based on template-guided self-assembly approach that allows the integration of WGM supporting dielectric microspheres and plasmonic antennas in discrete optoplasmonic networks.[ Reference Hong, Ahn, Boriskina, Zhao and Reinhard 1 ] Figure 1 shows the representative scanning electron microscope (SEM) images of optoplasmonic networks before (a, b) and after insertion of the dielectric microspheres (c, d) into the binding sites defined by gold NP-tipped silicon nanopillars. These nanopillars are fabricated through dry etching of a metal nanostructure created by electron beam lithography (EBL) on a silicon substrate.[ Reference Ahn, Boriskina, Hong and Reinhard 5 ] In optoplasmonic structures, gold NPs are not directly attached on the surface of microspheres as this may cause quenching of the WGMs, but instead are separated from the microsphere surface by a gap with a typical dimension between 5 and 20 nm [Figs 1(c) and 1(d)]. A limited number of gold NPs located at the predetermined locations within a few nanometers from the microsphere surface ensures efficient excitation of the metal NP plasmons and, at the same time, minimizes the perturbation of the WGMs through dissipative losses in the metal. In this regard, the outlined design of an optoplasmonic system seeks to achieve an efficient coupling between photonic and plasmonic modes without quenching the photonic modes. The template guide self-assembly is, thus, capable of positioning plasmonic nanoantennas at pre-defined locations in the evanescent field of the WGM resonators. Other important structural factors, such as the size and shape of the plasmonic nanostructures, the number of microspheres, or the angle in the chain of the microspheres can be controlled through EBL patterning.
Optoplasmonic structures fabricated through template-guided self-assembly. (a b) Gold nanoparticle tipped silicon pillars before adding polystyrene microspheres (images are 30°-tilted for better visualization). The number of binding sites [three in (a); four in (b)] can be determined during EBL. (c, d) Completed optoplasmonic structures after beads are inserted into the binding sites. Scale bars are 1 μm.

In this paper, we provide a detailed analysis of the influence of key structural parameters, including the size of the NPs, the separation between the microspheres and their geometric arrangements, on the properties of these new electromagnetic materials. Implications for an active control of light at the nanoscale are discussed. Of particular interest in this paper is the fact that optoplasmonic materials are capable of shaping the near- and far-field around individual elements through a tunable photonic–plasmonic mode coupling. Electromagnetic simulations show that optoplasmonic structures not only enhance the E-field intensity by more than two orders of magnitude over that of pure dielectric microspheres, but also provide opportunities to redistribute the near-field intensities through an electromagnetic coupling between photonic and plasmonic components. We also observed WGM dips in the simulated far-field spectra of the optoplasmonic structure as a result of destructive interference between the broad plasmon mode of gold dimers and the sharp WGMs of a dielectric microsphere, also known as a Fano resonance. Finally, we investigate the effect of an angle in the microsphere chain on its function.
Results and Discussion
Spectral shaping through photonic–plasmonic mode coupling in optoplasmonic structures
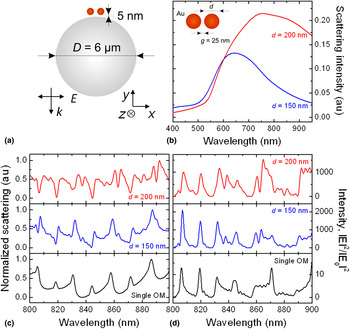
A microcavity resonator supports high-Q WGMs at the dielectric–air interface through total internal reflection of the incident light.[ Reference Astratov and Rhodes 18 ] As WGMs decay exponentially with growing distance from the cavity surface, it is important to position plasmonic nanostructures in the evanescent tail of the WGMs to maximize the photonic–plasmonic mode coupling in the optoplasmonic structure. The representative optoplasmonic structure shown in Fig. 2(a) has a 5 nm gap between a 6 µm diameter polystyrene bead and gold NP dimers. We varied the diameter (d) of the gold NPs and quantified the effect on the photonic–plasmonic mode coupling and, thus, tested the relevance of this parameter for spectral shaping. We chose d = 150 and 200 nm with a fixed interparticle gap distance (g) of 25 nm between NPs. As the size of the gold NPs increases from 150 to 200 nm, the scattering intensity increases and the plasmonic resonance peak broadens, and shifts from 643 to 758 nm [Fig. 2(b)]. We characterized photonic–plasmonic mode coupling in the 800–900 nm spectral range where the spectrum of the hybrid system overall follows the WGM shape. Closer to the plasmon resonance strong coupling distorts the spectral shape.[ Reference Ahn, Boriskina, Hong and Reinhard 5 ]
Near- and far-field spectra shaping through photonic–plasmonic mode coupling in an optoplasmonic monomer. (a) Schematic diagram of an optoplasmonic monomer composed of 6 µm diameter polystyrene bead and gold NP dimer. The gap between a microsphere and gold dimers is set to 5 nm. (b) Far-field scattering intensity of gold dimers with varying diameters (d) of 150 (blue) and 200 nm (red) with a fixed dimer gap (g) of 25 nm. (c) Normalized far-field scattering spectra of the optoplasmonic monomer under normal illumination by a plane wave for cases of d = 150 and 200 nm. A spectrum of a reference single microsphere, which is void of gold dimers, is also included. (d) The corresponding E-field intensity enhancement monitored in the gold dimer gap.

The optoplasmonic monomer in Fig. 2(a) is characterized through finite-difference time-domain (FDTD) simulations under normal illumination by a plane wave. Normalized far-field scattering spectra are shown in Fig. 2(c) for the optoplasmonic monomers with d = 150 (blue) and 200 nm (red) together with the spectrum for a reference single optical microcavity (OM, black). The corresponding near-field intensity enhancement monitored in the gold NP dimer gap is shown in Fig. 2(d). Several features distinguish the optoplasmonic monomers from the reference microsphere. First of all, the WGM peaks of the optoplasmonic monomers are slightly shifted to the red and broadened with respect to those of a single microsphere as a result of the strong coupling of WGMs to the plasmonic modes of gold NPs. Second, the E-field intensity on the optoplasmonic monomers is increased by more than two orders of magnitude over that of a single microsphere. Furthermore, the far-field spectrum of an optoplasmonic monomer with d = 200 nm in Fig. 2(c) has prominent spectral dips, which are missing in the far-field spectra of the isolated microsphere and the optoplasmonic monomer with d = 150 nm. These dips are indicative of the formation of Fano resonances[ Reference Luk'yanchuk, Zheludev, Maier, Halas, Nordlander, Giessen and Chong 19 , Reference Fan, Wu, Bao, Bao, Bardhan, Halas, Manoharan, Nordlander, Shvets and Capasso 20 ] for optoplasmonic structures with larger gold NPs, for which the broad low-energy tail of the plasmon resonance overlaps with the narrow WGM resonances in the 800–900 nm spectral window, causing destructive interference.[ Reference Hentschel, Saliba, Vogelgesang, Giessen, Alivisatos and Liu 21 – Reference Gallinet, Siegfried, Sigg, Nordlander and Martin 23 ] The dips in the far-field spectra coincide with peaks in the near-field in Fig. 2(d). These results confirm that the size of the metal NP represents a rational control parameter for tuning the near- and far-field responses of optoplasmonic structures.
Effect of the gap distance in optoplasmonic chains
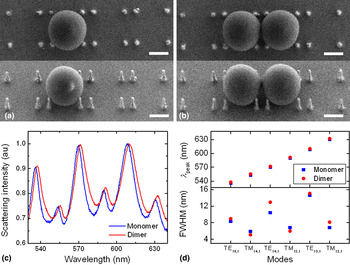
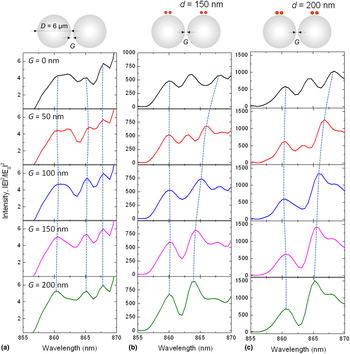
Extended chains of optoplasmonic structures provide additional degrees of freedom for tailoring near-field spectra, for instance, with the gap width (G) between the individual optoplasmonic units. Before we characterize near-field spectra of optoplasmonic chains in detail, we first want to characterize the influence of coupled microspheres in optoplasmonic structures through far-field scattering spectroscopy. Figure 3 shows SEM images and experimental scattering spectra of the optoplasmonic structures containing either monomer or dimer microspheres in the structure, while other experimental parameters such as a diameter of gold NPs (d = 150 nm) and spacing between gold NP tipped nanopillars (d p = 400 nm) remain unchanged. The observed spectral red-shift and broadening of the WGM peaks indicates mode coupling between the two microspheres. In the next step, we analyzed optical hybridization between neighboring microspheres through near-field simulation of the coupled microspheres. Figure 4 shows the E-field intensity enhancement of (a) a 6 µm diameter microsphere dimer with no gold NPs, and (b, c) optoplasmonic dimers having two optoplasmonic monomers with G between 0 and 200 nm. The size of the gold NPs is varied between (b) d = 150 nm and (c) 200 nm, and we monitored the spectral range between 855 and 870 nm. In the optoplasmonic dimer, the variation of G results in systematic resonance shifts and the formation of additional peaks for G ≤ 50 nm. In contrast, the WGM peaks of a reference microsphere dimer show a much smaller dynamic range when G is varied. The spectral shape tuning by coupling between individual optoplasmonic units provides additional degrees of functionality that can be used to shape and control the near-fields around optoplasmonic structures with well-defined geometry.
The effect of coupled microspheres in the optoplasmonic structure. 0° (top) and 30° (bottom) tilted SEM images of (a) monomer and (b) dimer microspheres (D = 2 µm) in the optoplasmonic structures. Scale bars in all SEM images are 1 µm. (c) Experimental scattering spectra of the optoplasmonic monomer (blue) and dimer (red) structures. (d) Peak wavelengths (λ peak, top) and full-width at half-maximum (FWHM, bottom) of individual WGMs shown in (c).

Spectrum shaping by controlling gaps in optoplasmonic dimers: E-field intensity enhancement of (a) OM dimers (D = 6 µm), (b) optoplasmonic dimers with d = 150 nm, and (c) d = 200 nm. Gap between microspheres (G) is varied from 0 to 200 nm. Dotted lines are drawn to guide the eye.

Characterizing the near-field distribution in coupled optoplasmonic systems
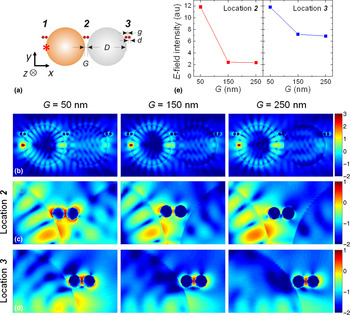
To investigate near-field intensity distributions obtained through a synergistic mode coupling between photonic and plasmonic components, we analyzed E-field maps of simple optoplasmonic dimer structures that contain two microspheres and three gold dimers located off-axis of the microsphere chain [Fig. 5(a)]. We refer in the following to the different plasmonic antenna positions as locations 1–3 as indicated in the figure. We emulated a dipole emitter as a light source located on the axis of the microsphere chain [a red star in Fig. 5(a)] and performed FDTD simulations at the fixed wavelength of 650 nm. Microspheres efficiently trap and re-cycle the incident light through total internal reflection and form WGM characteristic field distribution patterns within the microsphere [Fig. 5(b)]. The evanescent field of these modes extends into space and interacts with the plasmonic components in the vicinity of the dielectric microspheres [Fig. 5(c)]. Mode coupling between photonic and plasmonic components leads then to an efficient light localization around the gold NP dimers and increases the E-field intensity more than an order of magnitude above that of the OM-free gold dimers (data not shown). The off-axis arrangement of the gold NPs relative to the microsphere chain in Fig. 5 allows for both light localization in the evanescent field of the microsphere around the metal NPs as well as a light guiding with minimal perturbation along the microsphere chain.
E-field intensity landscape around optoplasmonic dimers with different microsphere gap separations (G). (a) A schematic diagram of the optoplasmonic dimer that consists of coupled microspheres (D = 2 µm) with varying dimer gaps (G = 50, 150, and 250 nm), and gold NP dimers (d = 150 nm, g = 20 nm) located off the microsphere dimer axis. Gold NPs at location 2 are separated from the OM surface with 5, 15, and 35 nm gap as G values increase from 50, 150, to 200 nm. The OM-gold dimer edge-to-edge distances at locations 1 and 3 remain unchanged with 5 nm. A dipole emitter is located on the axis of the microsphere chain (a red star). (b)–(d) E-field intensity distributions, log(|E|2/|E 0|2), in the optoplasmonic dimer simulated at a fixed wavelength, λ = 650 nm, for (b) entire structures, at locations (c) 2, and (d) 3 with varying G values. Peak E-field intensity values measured from 400 × 400 nm2 areas centered at gold NP dimers at locations 2 (red) and 3 (blue) are shown in (e).

Both light guiding and light localizing efficiencies in optoplasmonic chains depend on the gap distance (G) between the microspheres. We systematically investigated the G dependency in the optoplasmonic dimer by simulating the E-field intensity distribution in optoplasmonic dimers with G = 50, 150, and 250 nm through FDTD calculations. As G values increase from 50, 150, to 200 nm, the OM-gold dimer edge-to-edge distances at location 2 increase from 5, 15, to 35 nm, while the OM-gold dimer distances remain unchanged at locations 1 and 3 with 5 nm. We plotted the E-field intensity map as a function of G for the entire structure [Fig. 5(b)] or magnified at locations 2 and 3 [Figs 5(c) and 5(d)]. In Fig. 5(e), we plot the peak E-field intensities obtained from 400 × 400 nm2 square areas centered at each gold NP dimer. Overall, the E-field intensities decrease as G increases. However, the difference in peak E-field intensities of gold NPs at locations 2 and 3 between G = 150 and 250 nm are small due to the efficient E-field localization provided by the plasmonic antennas. The overall higher total E-field intensity at location 3 is understood in terms of the shorter microsphere-metal NP separation at location 3 than at location 2. The absence of an additional microsphere contributes further to a redistribution of the energy at the end of the chain, achieving a higher degree of localization at the plasmonic antenna.
The near-field maps at the chosen locations in Fig. 5 show clearly that the excitation of plasmonic nanoantennas through the evanescent field of microsphere WGMs creates unique asymmetric field patterns, which can be spatially modulated by choice of the wavelength.[ Reference Ahn, Zhao, Hong and Reinhard 9 ] Near-field enhancement and active modulation in optoplasmonic dimers can provide important properties to all-optical nanocircuits and on-chip optical links.
Light guiding and localization in angled optoplasmonic chains
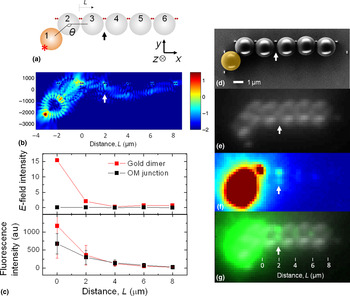
So far, we considered optoplasmonic monomer and dimer structures only in a linear geometry. To demonstrate the potential of optoplasmonic structures for near-field light manipulation in more complex geometries, we will in the next step characterize optoplasmonic chains with a non-linear geometry. Figure 6(a) shows a schematic view of an optoplasmonic chain that includes one quantum dot (QD)-coated microsphere (shaded in orange, #1) displaced from the chain axis formed by other five microspheres. The angle (θ) in the optoplasmonic chain is set to 135° for the calculation, which is in good agreement with the chain angle in the experimentally fabricated optoplasmonic chain shown in the SEM image [Fig. 6(d)]. The dipole emitter in the calculation is located at the end of the microsphere #1 (marked with a red star) and oriented perpendicular to the microsphere surface. In the experiments, QD-coated microspheres acted as an integrated light source in the chain, and the evanescent field of the guided light in the microspheres excited gold NPs that are coated with the Cy5 acceptor dyes.[ Reference Ahn, Zhao, Hong and Reinhard 9 ]
Angled optoplasmonic chains. (a) Schematic diagram of an angled optoplasmonic chain with an angle, θ = 135°. The dipole emitter is located at the side of the angled microsphere (a red star). (b) An E-field intensity map of the angled optoplasmonic chain in a log scale. (c) Top: E-field intensity values obtained at gold dimers (red) and microsphere junctions (black) of the angled optoplasmonic chain shown in (b). Bottom: Fluorescence intensities measured from the experimentally fabricated angled optoplasmonic chains. (d) SEM, (e) bright-field, and (f) fluorescence image of the identical angled optoplasmonic chain. (g) An overlap image of (e) and (f). The position, L = 2 µm, is indicated with arrows in (a), (b), and (d)–(g).

In analogy to previous observations in conventional microsphere chains,[ Reference Mitsui, Wakayama, Onodera, Hayashi, Ikeda, Sugimoto, Takamasu and Oikawa 24 ] the angle plays a crucial role in guiding, switching, and routing the light in the optoplasmonic chain. Especially photonic nanojet-induced modes (NIMs)[ Reference Kapitonov and Astratov 25 ] are attenuated in this non-linear structures. The reason for that becomes apparent in Fig. 6(b), where the focused E-field intensity spot at the back of the second microsphere off-axis with the remaining microsphere chain represents an exit point where the energy is lost out of the waveguide. A small fraction of light is reflected from this point, resulting in the wave-like light propagation pattern on the right of the exit point. The overall E-field intensity of the angled chain is lower than that of the linear one. However, depending on the trajectory of the light in the angled optoplasmonic chain, it is conceivable to “focus” the light on one particular gold NP dimer along the chain for which the E-field intensity can become very high. The angled optoplasmonic chain in Fig. 6(b) focuses the light onto the NP dimer located between the second and third microspheres. The enhanced E-field (top, calculated) and fluorescence (bottom, measured) intensities of the gold dimers (red) at these positions are shown in Fig. 6(c), in comparison with the intensities measured at microsphere junctions (black). Particular attention should also be paid to the gap region between microspheres #3 and #4. In Fig. 6(f), the fluorescence image reveals two spots of increased fluorescence intensity (white arrow), presumably one from the gold dimer and another from the microsphere junction. Figure 6(g) confirms that the location of the gold dimer and the microsphere junction matches very well when the white-field image (e) is overlaid with the fluorescence image (f).
Our studies show that by tuning the angle in the optoplasmonic chain photonic NIMs can be focused at selected metal antennas, further enhancing the E-fields at particular locations. This structural flexibility makes it possible to boost the E-field significantly beyond what can be with the WGM-guided component of the electromagnetic energy in the chain.
Conclusion
In conclusion, we have demonstrated that the separation between microspheres and the angle of the microsphere are important geometric parameters that provide control over the resonance positions and field distribution in optoplasmonic networks. Furthermore, we demonstrated that the size of the metal NPs determines the nature of the hybrid resonances. The large number of degrees of freedom in optoplasmonic chains paves the path to hybrid structures with customized near- and far-field responses based on template-guided self-assembly for a broad range of applications in light-harvesting substrates, biomedical arrays, sensing platforms, and microfluidic chips.
Acknowledgments
This work was supported by the U.S. Department of Energy, Office of Basic Energy Sciences, Division of Materials Science and Engineering under Award DOE DE-SC0010679.