Introduction
The eutectic and near eutectic alloys exhibit narrow range of melting temperatures and thus exhibit superior castability [Reference Elliott1]. The lamellar eutectic microstructure has been reported in Fe–Nb–Al, Ni–Zr, and Ti–Fe–Sn alloys [Reference Park, Kim, Kim, Lee, Eckert and Kim2, Reference Park, Kim, Sohn, Kim, Kim, Kim and Eckert3, Reference Das, Theissmann, Löser and Eckert4, Reference Zhang, Das, Lu, Duhamel, Calin and Eckert5], comprising of alternate hard and soft solid solution phases, represents a true composite microstructure, and possesses good mechanical properties. However, a high degree of constitutional undercooling increases the nucleation rate and retards the growth of the lamellar phases leading to the development of nano-eutectic composites [Reference Maity, Roy and Das6]. A large number of nano-eutectic composites reinforced by micrometer size soft dendritic β-Zr/Ti phase have been developed to improve the room temperature plasticity of the nanostructured/glassy alloys in several multicomponent Ti-, Fe-, and Zr-systems [Reference Barbier, Huang and Bouaziz7, Reference He, Eckert, Löser and Schultz8, Reference Louzguine, Kato, Louzguina and Inoue9, Reference Eckert, Das, Pauly and Duhamel10].
Recently, Ni-based alloys have gained remarkable attention due to their excellent mechanical properties, high thermal stability, and creep resistance properties [Reference Pint, DiStefano and Wright11]. Ni–Zr nano-eutectic composites are being developed in order to find the possible alternatives of high strength Ni-base advanced alloys. Along this line, the microstructure and mechanical properties of as-cast rods (ACRs) of 2 mm diameter in hypoeutectic Ni92Zr8 alloy have been reported by Park et al. [Reference Park, Kim, Sohn, Kim, Kim, Kim and Eckert3]. The eutectic matrix in Ni92Zr8 is composed of nano-lamellar fcc γ-Ni and ordered fcc Ni5Zr, which provide high strength [Reference Park, Kim, Sohn, Kim, Kim, Kim and Eckert3]. However, the presence of micrometer size fcc γ-Ni dendritic solid solution phase enhances the room temperature plasticity [Reference Park, Kim, Sohn, Kim, Kim, Kim and Eckert3]. It was proposed that the soft γ-Ni dendrites prevent catastrophic failure by restricting the propagation of shear bands during deformation [Reference Park, Kim, Sohn, Kim, Kim, Kim and Eckert3]. Similarly, the effect of ternary addition (Al) on the microstructure and mechanical properties of as-solidified Ni–Zr–(Al) eutectic ingots were reported [Reference Maity and Das12]. Along this line, the slip transfer across the interface of γ-Ni/Ni5Zr lamellae in the eutectic matrix was explored [Reference Maity, Singh, Dutta and Das13, Reference Kim, Hong, Park, Kim, Park, Park, Lee, Seo, Park and Kim14, Reference Kim, Lee, Hong, Park, Park, Lee, Seo, Wang, Park and Kim15]. The dislocation slip and the large interfacial area in the nanolamellar eutectic were shown as the origin of improvement of the plasticity [Reference Maity, Singh, Dutta and Das13, Reference Kim, Hong, Park, Kim, Park, Park, Lee, Seo, Park and Kim14, Reference Kim, Lee, Hong, Park, Park, Lee, Seo, Wang, Park and Kim15, Reference Kim, Hong, Park, Kim, Suh, Lee, Park, Maity, Eckert and Kim16, Reference Lee, Kim, Hong, Park, Park, Lee, Seo, Suh, Eckert, Kim, Park and Kim17].
However, both the microstructure and the mechanical properties of such nanostructure-dendrite composites can be easily tuned by adopting proper cooling rate or solidification conditions [Reference Das, Güth, Klauß, Mickel, Löser, Eckert, Roy and Schultz18, Reference Das, Pauly, Duhamel, Wei and Eckert19, Reference Das, Roy, Löser, Eckert and Schultz20, Reference Löser, Das, Güth, Klauß, Mickel, Kühn, Eckert, Roy and Schultz21]. Various microstructural parameters such as eutectic lamellar spacing and dendritic arm spacing may influence the mechanical properties of these multiphase composites [Reference Zhang, Das, Lu, Duhamel, Calin and Eckert5, Reference Chadwick22]. However, the effect of cooling rate/casting thickness on the microstructure evolution and the mechanical properties of Ni–Zr–(Al) have not been investigated yet.
In the present work, the effect of cooling rate on the evolution of microstructure and the resulting mechanical properties of the model Ni–Zr–(Al) composites with varying Al content have been investigated. The effect of cast rod diameter on the evolution of various microstructural parameters such as the volume percentage of the constituent phases, dendritic arm spacing, and eutectic lamellar spacing has been correlated in terms of microstructure homogeneity. Furthermore, the bulk hardness and strength of these composites have been measured under compression and are correlated with the adopted cooling rate. The homogeneity of the microstructure and the reliability of the mechanical properties have been assessed.
Results
X-ray diffraction and phase analysis
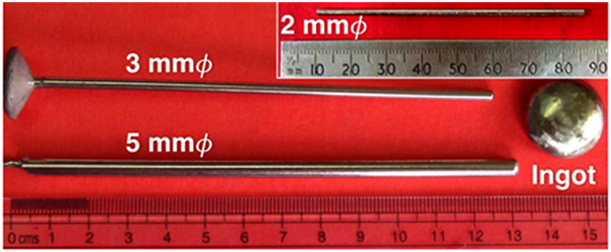
In order to explore the effect of cooling rate, the as solidified ingots (ASIs) and the as-cast rods (ACRs) of 2, 3, and 5 mm diameter (Ø) of (Ni0.92Zr0.08)100−xAlx (0 ≤ x ≤ 4 at.%) were prepared. A few images of such ingot and rods are shown in Fig. 1.
The outer look of the as-solidified ingot and ACRs for x = 4.

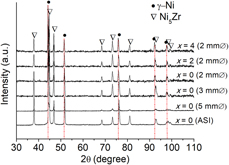
Figure 2 shows the X-ray diffraction (XRD) patterns of ASI and ACRs of x = 0, x = 2, and x = 4. The XRD patterns of all the ACRs and ASIs with varying Al content show sharp peaks of fcc γ-Ni  $\left( {Fm\bar{3}m} \right)$ phase and ordered fcc Ni5Zr
 $\left( {F\bar{4}3m} \right)$ phase. However, the peaks of fcc γ-Ni phase have been gradually shifted toward the lower 2θ value with increase of Al content, whereas peak positions of Ni5Zr phase remain at the same 2θ position irrespective of Al content of the alloy. Table I summarizes the lattice parameter (a) of the constituent phases, as estimated by Rietveld refinement. The lattice parameter of fcc γ-Ni (a γ-Ni) increases gradually with addition of Al, without alteration of the lattice parameter for Ni5Zr
 $\left( {{a_{{\rm{N}}{{\rm{i}}_{\rm{5}}}{\rm{Zr}}}}} \right)$. Hence, the solubility differences of Al in γ-Ni and Ni5Zr phases cause Al to dissolve preferentially into fcc γ-Ni phase rather than Ni5Zr. No change of the lattice parameter of both fcc γ-Ni and Ni5Zr has been noticed for ASIs and ACRs for identical alloy composition, as shown in Table I.
XRD patterns of ASI and ACRs for (Ni0.92Zr0.08)100−xAlx (0 ≤ x ≤ 4) composites showing presence of γ-Ni and Ni5Zr phases.

Lattice parameters (a) of the constituent phases for 2 mm Ø, 3 mm Ø, and 5 mm Ø ACRs (error on lattice parameter lies within ±0.0003 Å).

Microstructure analysis
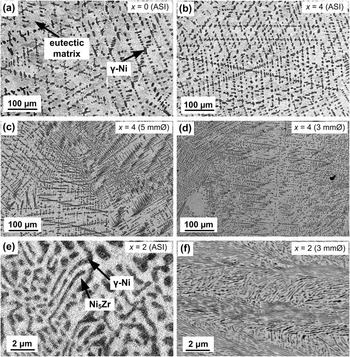
Figure 3 shows the back-scattered electron (BSE) micrographs of the ASIs and ACRs with varying diameters and Al content. Microstructures of all the ASIs and ACRs show the presence of darker Ni-rich dendrites, which are distributed in a brighter eutectic matrix. In order to reveal the effect of cooling rate, microstructures of the differently solidified specimens were investigated along the cross-section and were compared at identical locations. As example, the micrographs of x = 0 and x = 4 ASIs are shown in Figs. 3(a) and 3(b), respectively. It has been noticed that the vol% of the γ-Ni dendrites in x = 4 ASI has been increased and the microstructures have been refined upon Al addition than that of x = 0 ASI. However, Figs. 3(c) and 3(d) represent the micrographs at the center of 5 mm Ø and 3 mm Ø ACRs of x = 4 viewed under same magnification to show the effect of alloy composition and adopted cooling rate on the vol%, size, and distribution of γ-Ni dendrites. The size of the secondary dendritic arms has been reduced substantially in Figs. 3(c) and 3(d) for ACRs, which were cooled at a faster rate during solidification than that of ASI. In case of 2 mm Ø ACRs, the primary dendritic arms are more randomly oriented with each other throughout the cross-section. However, secondary dendritic arms attached to the primary arms are found very lesser in number for 2 mm Ø ACRs, as the growth of these dendrites becomes sluggish at higher cooling rate. Figures 3(e) and 3(f) represent the higher magnification images of the matrix of ASI and 3 mm Ø ACR for x = 2 showing alternate lamellar structure of the eutectic comprising of γ-Ni and Ni5Zr phases. The interlamellar spacing (λ) value is finer in ACRs than that of ASIs for identical alloy composition.
SEM BSE micrographs of (a) x = 0 ASI, (b) x = 4 ASI, (c) x = 4 ACR of 5 mm Ø, (d) x = 4 ACR of 3 mm Ø, and higher magnification image of the nano-eutectic matrix as evolved in (e) x = 2 ASI and (f) x = 2 ACR of 3 mm Ø, showing the microstructural refinement upon Al addition and by reducing the casting thickness.

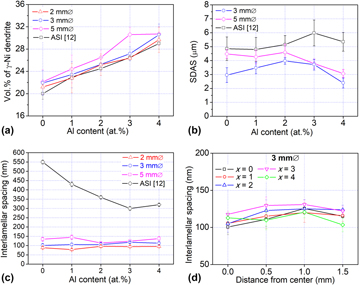
Figure 4 shows the results of the quantitative analysis of the microstructure in terms of vol% of γ-Ni dendrites, secondary dendritic arm spacing (SDAS), and λ showing the variation of the microstructure due to the casting thickness and composition of the bulk alloy. The vol% of dendrites (at center) varied in a range of 21 ± 1% and 31 ± 1% in all the different ACRs, as shown in Fig. 4(a). Therefore, it can be inferred that the vol% of γ-Ni dendrites in ACRs increases upon Al addition similar to ASIs [Reference Maity and Das12]. The vol% of dendrites is measured to be slightly more in the ACRs. The SDAS in 5 mm Ø ACRs lies in the range of 3.07 ± 0.29 µm (x = 4) and 4.59 ± 0.59 µm (x = 2), whereas SDAS gradually decreases upon addition of Al as shown in Fig. 4(b). On the other hand, the SDAS lies in the range of 2.39 ± 0.36 µm (x = 4) and 3.97 ± 0.23 µm (x = 2) in 3 mm Ø ACRs. In both the cases, the SDAS values in x = 2 ACRs are slightly higher than that of other ACRs.
Plots showing variation of (a) vol% of γ-Ni dendrites, (b) secondary dendritic arm spacing (SDAS), (c) eutectic interlamellar spacing (λ) with Al content for ASI and ACRs in (Ni0.92Zr0.08)100−x Alx (0 ≤ x ≤ 4). (d) The variation of λ from center to periphery for 3 mm Ø ACRs with different Al contents.

Figure 4(c) represents the variation of λ with alteration of the cast rod diameter, whereas the reported values of λ for ASI composites are also shown for comparison. The λ value at the center is much smaller in ACRs than that of ASI, which decreases with decreasing the rod diameter. As an example, the λ values of ASI composites are reported to vary in the range of about 320–550 nm, whereas the λ values are estimated to vary in the range of 114 ± 4 nm (x = 2) and 145 ± 12 nm (x = 1) for 5 mm Ø, 101 ± 10 nm (x = 0) and 118 ± 4 nm (x = 3) for 3 mm Ø, and 78 ± 6 nm (x = 1) and 96 ± 7 nm (x = 2) for 2 mm Ø ACRs at the center. The λ values have been observed to vary from the center to the periphery along the cross-section of ACRs. As an example, the variation of λ across the section has been estimated to vary in the range of 100–125 nm, 105–120 nm, 105–125 nm, 118–131 nm, and 104–121 nm, for x = 0, x = 1, x = 2, x = 3, and x = 4 composites, respectively, as shown in Fig. 4(d) for 3 mm Ø.
Differential thermal analysis (DTA)
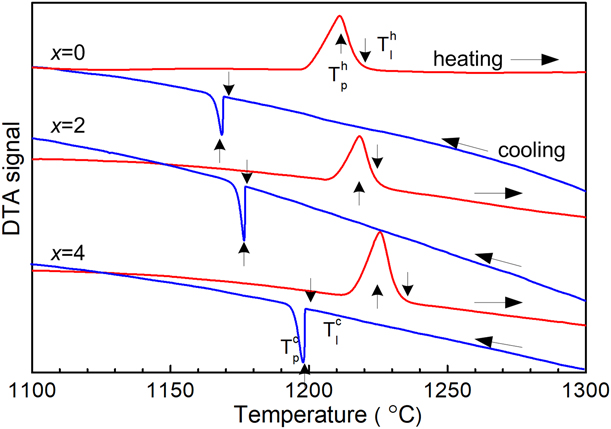
Figure 5 shows the DTA signal versus temperature (°C) plots during heating and cooling up to 1300 °C for ASI composites (x = 0, 2, and 4). The presence of melting peaks can be observed in all the traces during heating and solidification peaks during cooling. The liquidus (T l) and the peak temperatures (T p) are marked by arrows, as shown in Fig. 5.  $T_{\rm{l}}^{\rm{h}}$ was noted to increase gradually from 1218 °C (x = 0) to
 $T_l^h = 1225\;{\rm{^\circ C}}$ (x = 2) and
 $T_{\rm{l}}^{\rm{h}} = 1233\;{\rm{^\circ C}}$ (x = 4) with increase of Al content during heating cycle. Similarly,
 $T_{\rm{l}}^{\rm{c}}$ was noted to be 1169 °C (x = 0), 1177 °C (x = 2), and 1199 °C (x = 4) during cooling in DTA.
Plot showing DTA signal with temperature during heating and cooling at 20 K/min.

Bulk hardness and compression test
The measured bulk hardness (H) values of ACRs are higher (13–21%) than that of the reported values for ASI of identical alloy composition, as shown in Table II. The estimated length of the indentation diagonals typically for all the composites lies in the range of 280 and 305 µm. Hence, a large number of dendrites and sufficient area of nano-eutectic matrix were covered under the indentation impression allowing to measure the true hardness of the composite. The H values of the ACRs increase with reducing the diameter. However, the H value decreases with the increase of Al content in the alloy. As an example, the H of 5 mm Ø ACRs gradually decreases with addition of Al from 4.31 ± 0.05 GPa (x = 0) down to 4.10 ± 0.06 GPa (x = 3), then slightly increased to 4.15 ± 0.05 GPa in case of x = 4. Similar trend has also been observed in the case of 3 mm Ø ACRs. However, H gradually decreased from 4.55 ± 0.05 GPa (x = 0) to 4.30 ± 0.04 GPa (x = 4) upon Al addition in case of 2 mm Ø ACRs.
Yield stress (σy), ultimate compressive stress (σmax), plastic strain (εp), and bulk hardness at 20 kg load of (Ni0.92Zr0.08)100−xAlx (0 ≤ x ≤ 4 at.%) composites of 2 mm Ø, 3 mm Ø, and 5 mm Ø ACRs (standard deviation are shown after ± symbol).

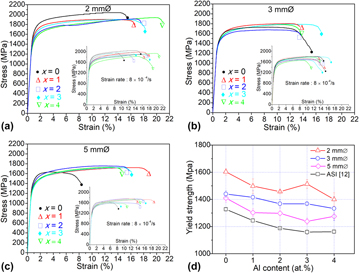
Figures 6(a)–6(d) show the engineering stress–strain curves under compression. All the composites show very high yield strength (σy = 1250–1600 MPa) with high plasticity (εp = 10–22%) prior to fracture (Table II). The σy values of ACRs are appreciably higher as compared to ASI composites [Reference Maity and Das12]. In general, both σy and εp values increase with reducing the rod diameter. Adequate numbers of specimens were tested to verify the reproducibility of the results, and a few stress–strain plots are shown in the insets of Figs. 6(a)–6(c). Strain hardening was noticed in all the composites exhibiting wide work-hardening region.
Plots of engineering stress–strain curves under compression measured at room temperature for ACRs of (a) 2 mm Ø, (b) 3 mm Ø, and (c) 5 mm Ø in (Ni0.92Zr0.08)100−xAlx (0 ≤ x ≤ 4) composites. Inset: a few sets of the stress–strain curves of the same composites showing reproducibility of the results. (d) Variation of yield strength of the composites with Al content for all the ACRs and ASIs.

Discussion
Effect of Al addition on the melting temperature
Al addition has increased the melting temperature from 1218 °C (x = 0) to 1225 °C (x = 2), which finally increased up to 1233 °C (x = 4) upon further addition of Al. It has been also observed that Al preferentially dissolves into γ-Ni and occupies some of the Ni-sites by forming a substitutional solid solution. Hence, the γ-Ni dendrites are stabilized upon Al addition, and the ternary Ni–Zr–(Al) hypo-eutectic alloy exhibits higher melting temperature than that of binary Ni–Zr hypo-eutectic alloy [Reference Ghosh23, Reference Miura, Unno, Yamazaki, Takizawa and Mohri24]. On the other hand, the bond dissociation energies for Ni–Ni, Ni–Al, and Ni–Zr pairs were reported to be 204 kJ/mol, 224.7 ± 4.8 kJ/mol, and 279.8 ± 0.1 kJ/mol, respectively [Reference Luo25]. Hence, increase of the melting temperature is expected upon Al addition in the present study. The liquidus temperature of the Ni–Zr–(Al) alloys is correlated with the bond distance between Ni–Ni, Ni–Al, and Ni–Zr pairs. Since the atomic distances in a pure Ni crystal increase upon Al addition, thus an increase of the average lattice parameter of γ-Ni(Al) solid solution phase has been observed as shown in Table I. The Ni–Al pair has higher bond energy than that of Ni–Ni pair; therefore, Al addition rises the liquidus temperature.
Cooling rate and growth velocity
The SDAS is one of the important parameters controlling the mechanical properties of any near eutectic alloys [Reference Bouchard and Kirkaldy26, Reference Osorio, Goulart, Santos, Neto and Garcia27]. The reduced value of SDAS in 3 mm Ø ACRs than that of 5 mm Ø, as evident in Fig. 4(b), can be explained using Kuttamis-Flemings and Feurer-Wunderlin models, in which SDAS is proportional to the cube root of solidification time [Reference Kurz and Fisher28]. The lower the solidification time for 3 mm Ø ACRs, the finer the SDASis. Therefore, solidification time depends on the rate of cooling, i.e., the rate at which latent heat of fusion at the solid/liquid interface is conducted away through the solid/mold interface. However, as per Jackson–Hunt model [Reference Jackson and Hunt29], solidification front velocity (v) and eutectic interlamellar spacing (λ) are correlated by the following equation, where K is the solidification constant:
 $$v \times {\lambda ^2} = {\bf{K}}\quad .$$
Assuming a cylindrical disk undergoing solidification from the outer surface, a relationship between the effective cooling rate  $\dot{T}$ at a given temperature and the solidification front velocity (v) can be established as follows [Reference Srivastava, Eckert, Löser, Dhindaw and Schultz30]:
 $$\dot{T} = {{\Delta {h_{\rm{f}}}} \over {{C_{\rm{p}}}}} \times {{2v} \over R}\quad ,$$
where ∆h f, C p, and R represent the latent heat of fusion, the specific heat capacity, and the radius of the cylindrical rod, respectively. Considering the above equations [Eqs. (1) and (2)], the estimated eutectic interlamellar spacing (λ) and cooling rate  $\dot{T}$ can be correlated as follows:
 $$\dot{T} = {{\Delta {h_{\rm{f}}}} \over {{C_{\rm{p}}}}} \times {{2{\bf{K}}} \over {R{\lambda ^2}}}\quad .$$
The solidification constant (K) for the Ni–Zr–(Al) system is considered as 100 × 10−12 cm3/s [Reference Caram and Milenkovic31, Reference Kaya, Boyuk, Cadirli and Marasli32]. The value of ∆h f/C p for the Ni–Zr–(Al) system is calculated to be 485 K by considering the quantities of Ni, Zr, and Al in the alloys and their respective values for ∆h f and C p (the C p values of the respective elements considered at eutectic temperature). The reported values of ∆h f for pure-Ni, pure-Zr, and pure-Al are 17.6 kJ/mol, 16.8 kJ/mol, and 10.7 kJ/mol, respectively [Reference Stull and Sinke33]. However, the reported C p values for the pure-Ni, pure-Zr, and pure-Al at 1170 °C are 613 J/(kg K), 328 J/(kg K), and 1177 J/(kg K), respectively [Reference Gaskell34, Reference Lee35].
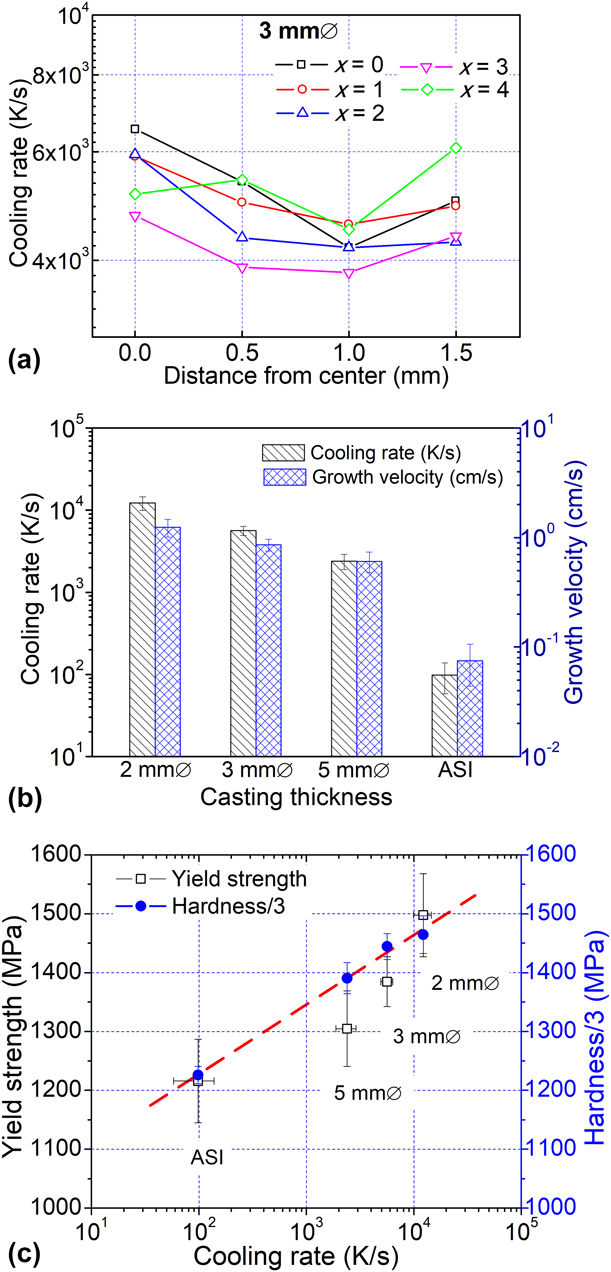
Figure 7(a) represents the estimated cooling rate along the cross-section from the center to the periphery in case of 3 mm Ø ACRs. The evolved cooling rates for all the composites (3 mm Ø) are derived from Eq. (3) and the values lie in the range of 4.2 × 10³ K/s–6.5 × 103 K/s, 4.6 × 10³ K/s–5.9 × 103 K/s, 4.2 × 10³ K/s–5.9 × 103 K/s, 3.8 × 10³ K/s–4.7 × 103 K/s, and 4.5 × 10³ K/s–6.1 × 103 K/s for x = 0, x = 1, x = 2, x = 3, and x = 4 composites, respectively. It can be noticed that the evolved cooling rate is two order of magnitude higher in case of 3 mm Ø ACRs than that of ASI (∼10–100 K/s). The overall variation of the growth velocities is 0.58–1.0 cm/s from the periphery toward the center in all the 3 mm Ø ACRs, which is predominantly on the higher side. The variation of the cooling rate and the growth velocity of the differently solidified samples are represented in Fig. 7(b). The cooling rate (at center) are calculated to vary in the range from 1.9 × 10³ to 3.1 × 10³ K/s for 5 mm Ø ACRs, 4.7 × 10³ to 6.5 × 10³ K/s for 3 mm Ø, and 1.0 × 10⁴ to 1.6 × 10⁴ K/s for 2 mm Ø ACRs in case of all the investigated composites.
Plots showing the variation of (a) cooling rate from center to periphery in 3 mm Ø ACRs, and the evolution of (b) average cooling rate and growth velocity in ACRs and ASI. (c) Plot showing a small scatter in yield strength and hardness that can be achieved in nano-eutectic composites upon solidification at wide range of cooling rates (10–104 K/s) by altering the casting thickness as well as the alloy composition.

Effect of casting thickness on the evolution of microstructure
All the alloys with varying Al content (0 ≤ x ≤ 4) were solidified into various casting thicknesses such as ACRs of 2–5 mm Ø and ASI of 15 mm thickness in order to alter the cooling rate. Two distinct phases, such as γ-Ni and Ni5Zr, are present in the microstructures of all the investigated ACRs and ASIs composites, where γ-Ni dendrites are embedded in a eutectic matrix comprising of alternate nanolamellae of γ-Ni and Ni5Zr. However, no new phase has been evolved due to either variation in the adopted cooling rate or the alloy composition. On the other hand, microstructure modification has been noticed in terms of vol% of the proeutectic phase, SDAS, λ, and their length scale. The vol% of γ-Ni dendrites has been increased in 5 mm Ø ACR than that of ASI and the ACRs of 2–3 mm Ø. It is intuitive that the growth velocity of the γ-Ni dendrite is higher than the eutectic phases at an intermediate cooling rate [Reference Kurz and Fisher28]. However, the vol% of γ-Ni dendrites increases upon Al addition in all the ACRs as Al dissolves preferentially in the γ-Ni phase.
The effect of casting thickness on the eutectic microstructure length scale is more dominant in x = 0 than that of Al containing composites, as shown in Figs. 4(b)–4(d). The λ values of x = 0 composites are reduced about 4.1, 5.5, and 6.2 times in 5 mm Ø, 3 mm Ø, and 2 mm Ø ACRs, respectively, than that of reported for ASI composite. In addition, the respective reductions of λ for x = 3 composites are 2.4, 2.5, and 3.2 times than that of ASI, as shown in Fig. 3(d). However, SDAS values were appeared to be 1.3 (x = 2) to 2.3 (x = 4) times finer in 3 mm Ø ACR and 1.1 (x = 0) to 1.75 (x = 4) times finer in 5 mm Ø ACRs than that of ASI. Since the driving force for nucleation is enhanced with the increase of the cooling rate and more numbers of nuclei of γ-Ni dendrites formed followed by the appearance of the individual eutectic phases in the residual melt [Reference Porter, Easterling and Sherif36]. Furthermore, the diffusion-controlled growth of these nanolamellar phase becomes more restricted upon faster cooling in ACRs than ASI. Hence, very fine microstructure with reduced SDAS and λ values appears in the differently solidified ACRs. However, the variation of λ values from the center to the periphery was estimated to lie within 25% along the cross-section of 3 mm Ø ACRs, as shown in Fig. 4(d). The slight increase value of λ around the center indicates that solidification may be initiated around the periphery and at the center. The release of the latent heat increases the melt temperature, thus reduces the effective undercooling as well as nucleation rate resulting a slightly coarser lamellar spacing.
Another important aspect was to estimate the extent of supersaturation in these nanolamellar phases upon solidification at cooing rate in the range of 10–104 K/s. No noticeable change of the lattice parameter of both γ-Ni and Ni5Zr has been observed in case of all the ACRs for identical alloy composition. There is less possibility of Al atoms to replace some Ni/Zr sites in fcc Ni5Zr phase due to its ordered structure. However, Al atoms definitely replaced some of the Ni sites in γ-Ni phase up to 6.6 at.% as per Hume-Rothery rules at temperature above ∼1170 °C. Nevertheless, the solid solubility of Al in Ni is nearly about ∼4 at.% at room temperature [Reference Zhou, Wang, Chen, Liu and Napolitano37, Reference Bratberg, Mao, Kjellqvist, Engström, Mason and Chen38]. Therefore, a high degree of supersaturation does exist in the investigated alloys. It is believed that formation of substitutional solid solution phase is favored due to the fcc crystal structure of Ni and Al with 14% difference in the atomic radii (Ni = 125 pm; Al = 143 pm) [Reference Callister and Rethwisch39], even though these alloys were solidified at a higher cooling rate up to 104 K/s. Hence, the extent of supersaturation in fcc γ-Ni(Al, Zr) phase remains same in all the investigated alloys, which were solidified at a wide range of cooling rates (10–104 K/s) resulting no change in the lattice parameter.
Effect of microstructural parameters on the strength and plasticity
The H, σy, and εp of the ACRs are altered due to the variation of the microstructural parameters. The σy and H values should increase according to the Hall–Petch equation: σy = σo + kd −1/2, due to the refinement of SDAS and λ. The increment in H values by evolving finer microstructure is about 14%, 18%, and 20% in 5 mm Ø, 3 mm Ø, and 2 mm Ø ACRs, respectively, than that of reported ASI [Reference Maity and Das12]. The σy values are obtained in a range of 1250–1600 MPa with εp = 10–22% in all the ACRs. The σy values are estimated to about 8%, 14%, and 23% higher for 5 mm Ø, 3 mm Ø, and 2 mm Ø ACRs, respectively, compared to ASI composites. The improvement in εp value with reducing the rod diameter may be attributed due to the evolution of defect-free microstructure in smaller diameter rods. The addition of Al reduces the hardness of the γ-Ni dendritic phases and increases the vol% of the γ-Ni phase, thus enhances the plasticity in the Al containing composites [Reference Maity and Das12]. However, the decrease of hardness of the γ-Ni phase upon addition of Al is balanced by the refinement of the eutectic lamellar spacing. Therefore, a narrow variation in the yield strength as well as hardness values has been achieved in case of ACRs and ASIs solidified at wide range of cooling rates (10–104 K/s), as shown in Fig. 7(c).
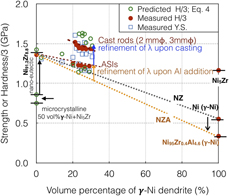
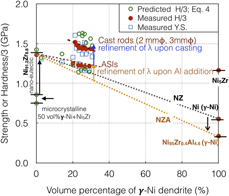
The synergistic effect of the eutectic lamellae thickness and the dendrite vol% on strength of the composites has been shown schematically in Fig. 8. The change of hardness of the individual constituent phases in the composite with Al addition was taken into consideration in order to correlate the vol% of the constituent phases and the eutectic length scale on the strength of the composites. Thus, the single-phase polycrystalline of pure-Ni (γ-Ni), Ni95Zr0.4Al4.6 (γ-Ni), and Ni5Zr were prepared and the bulk hardness (H) of these samples was measured to be 1.62 GPa, 1.01 GPa, and 3.43 GPa, respectively [Reference Maity and Das12]. However, the bulk hardness value of Ni91.2Zr8.8 ingot with ultrafine lamellar eutectic without any trace of γ-Ni dendrites is reported as 4.188 GPa [Reference Maity and Das12]. The measured H/3 values of all the above-mentioned metals/alloys are plotted along the Y-axis in Fig. 8 to obtain a generalized graph to predict H C/3 of nano-eutectic composites as per the following equation:
 $${H_{\rm{C}}} = {H_{\gamma {\rm{ ‐ Ni}}}}{V_{\rm{d}}} + {V_{\rm{m}}}\left( {{H_{\gamma {\rm{ ‐ Ni}}}}f_{\gamma {\rm{ ‐ Ni}}}^{{\rm{eu}}} + {H_{{\rm{N}}{{\rm{i}}_{\rm{5}}}{\rm{Zr}}}}f_{{\rm{N}}{{\rm{i}}_{\rm{5}}}{\rm{Zr}}}^{{\rm{eu}}} + {{{K_{\rm{m}}}} \over {\sqrt {{\lambda _{\rm{e}}}} }}} \right)\quad ,$$
where H γ-Ni and  ${H_{{\rm{N}}{{\rm{i}}_{\rm{5}}}{\rm{Zr}}}}$ are the hardness of the microcrystalline γ-Ni and Ni5Zr, respectively. The V d and V m are the vol% of γ-Ni dendrite and lamellar eutectic matrix, respectively. However,
 $f_{\gamma {\rm{ ‐ Ni}}}^{{\rm{eu}}}$ and
 $f_{{\rm{N}}{{\rm{i}}_{\rm{5}}}{\rm{Zr}}}^{{\rm{eu}}}$ are the volume fraction of γ-Ni and Ni5Zr in the eutectic matrix, which is 0.5 as estimated. λe is the average lamellae thickness and K m is the Hall–Petch like constant of the matrix, which has been taken as 0.88 MPa m1/2.
Variation of the yield strength (σy), measured hardness/3 (H/3), and the predicted hardness/3 (H C/3) according to Eq. (4) with the vol% of γ-Ni dendrite in differently solidified ingots and rods.

The bulk hardness of Ni91.2Zr8.8 ASI with fully eutectic microstructure is higher (H = 4.188 GPa) than the predicted hardness of a mixture of microcrystalline γ-Ni + Ni5Zr (H C = 2.525 GPa) as the λe of Ni91.2Zr8.8 ASI is 270 nm. The hardness (H C) of the ACRs with different vol% of dendrite, Al content, and λe, has been calculated according to Eq. (4). The σy, H/3, and H C/3 for all the ACRs and ASI have been plotted in Fig. 8. It can be noticed that the predicted H C and measured H are in the same order in ACRs. The H C and H values of the ACRs are lying at much higher value that the ASI, which also lies above the NZA and NZ line. The higher H C and H values of the ASI than the NZA line is due to the refinement of the λe upon Al addition. Whereas, the improvement of the strength/hardness in ACRs is originated due to the refined lamellar spacing that evolved upon high cooling rate and presence of high fraction of lamellar interface, which impede the dislocation movement. The small difference between the H C and H values for a given specimen is linked with the reduced dislocation density in the fine lamellar phases and the alteration of K m with the grain size [Reference Glezer, Kozlov, Koneva, Popova and Kurzina40].
Conclusions
The following conclusions have been drawn from the present investigation:
(1) All the different ACR and ASI composites show the presence of micrometer size γ-Ni phase embedded in a nano-eutectic (γ-Ni + Ni5Zr) matrix. Alteration of cooling rate in the range of 10–104 K/s does not influence on the evolved phases, lattice parameter, and supersaturation. However, Al addition increases the vol% of the proeutectic γ-Ni dendrites from 21 ± 1 vol% (x = 0) up to 31 ± 1 vol% (x = 4) in differently solidified composites.
(2) The microstructure length scale in terms of SDAS and λ has been refined in smaller casting thickness (2 mm Ø) and higher Al content (x = 4). The SDAS has been varied between 2.39 ± 0.36 μm and 6.00 ± 0.9 μm. However, λe has been varied in the range of 40 ± 3 nm and 275 ± 5 nm. However, fluctuation of λe along the cross-section from center to the periphery has been measured to be 11–25%.
(3) The variation of σy lies in the range of 1327 ± 10 MPa (ASI) and 1604 ± 23 MPa (2 mm Ø) for x = 0, whereas 1162 ± 10 MPa (ASI) and 1400 ± 49 (2 mm Ø) MPa for x = 4. Even though a wide range of alloy compositions (0 ≤ x ≤ 4) have been solidified at a wide range of cooling rates (10–104 K/s), but the variation in yield strength and hardness by 21% has been measured in all the Ni–Zr–(Al) nano-eutectic composites.
Methodology
Alloy preparation
ASIs of (Ni0.92Zr0.08)100−xAlx (0 ≤ x ≤ 4 at.%) were prepared by co-melting of pure Ni, Zr, and Al (99.99 wt%) by arc melting under Ar atmosphere. Initially Ni92Zr8 binary alloy was prepared which was then co-melted with appropriate quantity of Al depending on nominal composition. These alloys were remelted several times for proper mixing of the constituent elements and homogenization. The ACRs of 2 mm, 3mm and 5 mm diameter (Ø) were prepared by Cu-mold casting using the in-situ suction casting facility of the arc-melter. All the ingots and rods were cut using electro-discharge machining (EDM) as per the requirements for structural, microstructural characterizations, and evaluation of the mechanical properties.
Microstructural characterization
Philips PANalytical PW3373 (Almelo, Netherlands) XRD unit with Cu Kα radiation was used to determine the phases. The specimens were mechanically polished and colloidal-silica suspension was used for the final stage of polishing for succeeding characterizations. A high-resolution field emission scanning electron microscope (FESEM; SUPRA 40 Carl-Zeiss SMT AG, Oberkochen, Germany) with in situ energy dispersive X-ray spectrometer (EDS) was used for microstructural characterization. The interlamellar spacing (λ) was estimated as  $\lambda = {\lambda _{\gamma {\rm{ ‐ Ni}}}} + {\lambda _{{\rm{N}}{{\rm{i}}_{\rm{5}}}{\rm{Zr}}}}$, where λγ-Ni and
 ${\lambda _{{\rm{N}}{{\rm{i}}_{\rm{5}}}{\rm{Zr}}}}$ are the lamellae thicknesses of γ-Ni and Ni5Zr lamellae. Minimum 10 different images around a zone of interest have been analyzed for evaluating λ. Similarly, the SDAS has been estimated by measuring the length of a primary dendrite arm (L) and the number of the adjacent secondary arms (N) along the longitudinal section around the center of the ACRs, as per the following equation: SDAS = L/(N − 1). Minimum 20 numbers of primary dendrites have been chosen for each ACR. The volume percentage (vol%) of the phases has been estimated by evaluating more than 10 numbers of optical micrographs taken at 500× magnification using an optical microscope (Leica Microsystems, DM2500M, Wetzlar, Germany) with Leica MW image analysis software.
DTA
The melting event of the ASIs was studied using Pyris Diamond TG-DTA analyzer (PerkinElmer Instruments, Shelton, Connecticut). Specimens of 10 mg were polished to prepare flat surfaces. These specimens were heated up to 1300 °C from room temperature at a heating rate of 20 °C/min and were subsequently cooled down to room temperature under flowing Ar-atmosphere.
Bulk hardness and compression test
The Vickers bulk hardness of the differently solidified specimens was measured using a Leco LV-700 hardness tester (Leco Corporation, St. Joseph, Michigan) at a load of 20 kg with 15 s dwell time. The diagonal length of the indentation impression varies in the range of 280–305 μm, which covers all the constituent phases in the microstructure to compute the composite hardness. Since the rods of different diameters have experienced different cooling rates, the bulk hardness was measured near the center of the cross-section and was compared. Minimum 10 indentations were made for each specimen to get repetitive values of hardness of the composites.
The compression test of the differently solidified specimens was carried out using H50KS (TINIUS Olsen, Horsham, Pennsylvania) testing machine under uniaxial compressive loading at an initial strain rate  $\left( {\dot{\varepsilon }} \right)$ of 8 × 10⁻⁴/s at room temperature. The top and bottom surfaces of the cylindrical specimens were polished to prepare flat and parallel surface with an aspect ratio of height:diameter of 2:1.
Acknowledgments
The authors thank M. Das, S. Maity, and R. Kundu at the CRF at IIT Kharagpur for technical assistance. The financial support provided by Naval Research Board (NRB/4003/PG/357), Government of India, and SRIC (SGIRG), IIT Kharagpur are gratefully acknowledged.