INTRODUCTION
In recent years, considerable effort has been made in the dating of lime mortars by optically stimulated luminescence (OSL). However, only a few studies have been developed on earthen mortars (Feathers et al. Reference Feathers, Johnson and Kembel2008; Sanjurjo-Sánchez Reference Sanjurjo-Sánchez2016; Panzeri et al. Reference Panzeri, Cantù, Martini and Sibilia2017; Sánchez-Pardo et al. Reference Sanchez-Pardo, Blanco-Rotea and Sanjurjo-Sanchez2017b, Reference Sanchez-Pardo, Blanco-Rotea, Sanjurjo-Sanchez and González-García2018, Reference Sanchez-Pardo, Blanco-Rotea, Sanjurjo-Sanchez and Barrientos-Rodríguez2019). These mortars are composed of siliciclastic material from soils, sediments or regoliths. Raw materials are applied either directly or mixed, in joints or as a wall filler, frequent in some areas such as NW Spain, as observed from mortars of historical buildings which have been dated in recent years (Sánchez-Pardo et al. Reference Sanchez-Pardo, Blanco-Rotea and Sanjurjo-Sanchez2017b, Reference Sanchez-Pardo, Blanco-Rotea, Sanjurjo-Sanchez and González-García2018; Sanjurjo-Sánchez et al. Reference Sanjurjo-Sánchez, Blanco-Rotea and Sanchez Pardo2019).
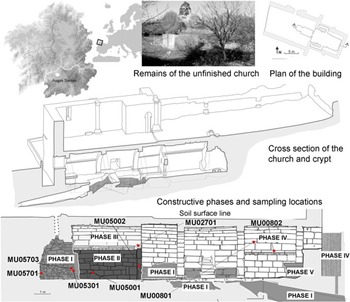
In this paper, we present the results using OSL dating of mortar of a special, unique building in Galicia (NW Spain). This is the crypt of the Basílica da Ascensión, Allariz, Ourense (Figure 1). This building is considered as the first known Christian building in the Roman province of Gallaecia. An archaeological study of the building enabled the identification of various construction phases due to its remodelling in various historical periods (Table 1). It was originally identified as a sauna from the Iron Age, having been modified in different moments of history and resulting in the current crypt (Blanco-Rotea et al. Reference Blanco-Rotea, García Rodríguez, Mato-Fresán and Sanjurjo-Sánchez2015). The aim of this paper is to use archaeological stratigraphy and chronology to compare it with the ages obtained from the dating of quartz mortar of each construction phrase identified in the crypt. This is necessary to know if multigrain OSL dating is suitable for dating earthen mortars.
Map with location of the studied building (upper left), general view of the unfinished Basilica (upper center) and plan of the crypt (upper right); longitudinal 3D section of the crypt (center), and location of the identified phases and samples studied in the cross section of the crypt.

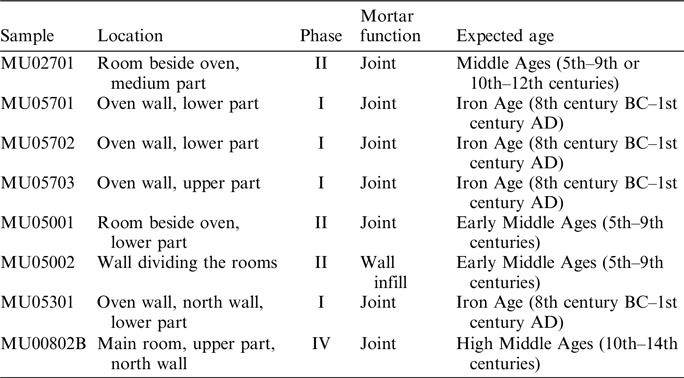
Location of samples, constructive phases, mortar function and expected archaeological ages.

The Crypt
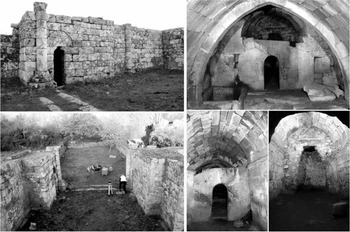
The crypt is built with granite masonry of local origin, using earthen mortars on the joints (Figures 1 and 2) and as a filling inside the walls. Around the crypt, there are many soils and colluvial sediments as well as many granite outcrops. The crypt is located at the bottom of a small depression below the current ground level. Above the crypt is the Basílica da Ascensión. The construction of this basilica began in the 13th and 14th centuries, but it was not finished, and only part of the north and south walls and the roofless apse remain (Figures 1 and 2). The constructive evolution of the crypt has been the subject of a documentation study, a stratigraphic analysis, and a volumetric analysis (Blanco-Rotea et al. Reference Blanco-Rotea, Mañana-Borrazás, Mato-Fresán and Rodríguez-Costas2009, Reference Blanco-Rotea, García Rodríguez, Mato-Fresán and Sanjurjo-Sánchez2015), which has allowed us to identify six construction phases. Phase I (Table 1 and Figures 1 and 2) corresponds to a circular structure covered by a false vault at the west end, identified as an old Iron Age sauna (García Quintela and Santos-Estévez Reference García Quintela and Santos Estévez2015). These types of structures used to be decorated with a large slab of rock called “pedra formosa”. This slab is displaced and reused in phase II, dated before the 9th century (Table 1). In this phase, the sauna is transformed into a building with masonry walls and the slab is used to close it. The ceiling of this phase would have been made of wood, but it has since disappeared. In phase III, during the 12th century, a vault is built on the walls. In phase IV, during the 13th and 14th centuries, a new room was added in the east sector, and the building is buried, which is converted into a crypt (Figures 1 and 2, Table 1). Phase V includes small transformations in the exterior walls and pavement during the Modern Age and phase VI corresponds to the 20th century whereby some mortars are grouted with Portland cement. Since almost all the mortars studied are joint mortars, during some construction phase, some of them may have possibly been replaced, so we cannot rule out that mortar of one particular phase actually corresponds to grouting material in a later time after construction.
Pictures of the existing north walls of the Basilica (upper left) constructed in the Late Middle Ages; north and south walls (lower left); view of the part of the crypt that corresponds to the Phase II (upper right), and older parts with the rock slab called pedra Formosa (first picture, lower right) and Iron Age sauna (second picture, lower right) of the Phase I.

MATERIAL AND METHODS
Sampling
OSL mortar dating requires that samples be taken and preserved in their entirety until they reach the laboratory. Dark sampling is preferable, as a key condition for OSL dating is to have samples which were not exposed to light during the sampling process. Thus, in the laboratory it is only necessary to remove the external part of the mortar exposed to light. In the crypt, this could be done since there is no natural light. Since the joints of the granite blocks were very narrow, sampling had to be done by hand with the help of a spatula. Cubic samples of approximately 5 × 5 × 5 cm were taken and transported in individual bags into boxes. Although the earthen mortars are fragile, the clay content and moisture helped keep them consistent until they reached the laboratory. All mortars were joint, except one that corresponded to the interior wall filling (Table 1).
Dating by Luminescence
The samples were taken in the Luminescence Laboratory of the University of A Coruña, where, under subdued red light, the outer part was removed (0.3–0.5 cm), extracting the inner part to obtain quartz. For this, the sample was dried and sieved and the 500–300 μm, 300–250 μm, 250–180 μm, 180–90 μm, 90–63 μm and 63–11 μm grain sizes were obtained. The procedures used for quartz extraction are specified elsewhere (Viveen et al. Reference Viveen, Sanjurjo-Sanchez, Goy-Diz, Veldkamp and Schoorl2014). No quartz grains were obtained for sample MU05702.
For the luminescence measurements, small multigrain aliquots (2 mm in diameter) were prepared, mounted on stainless steel discs. The measurements were taken in a Riso DA-15 automated TL/OSL reader equipped with blue light emitting diodes (LEDs) (470 ± 30 nm) for stimulation and a 9235QA photomultiplier. A Hoya U-340 filter was placed between the photomultiplier and the samples. To irradiate the samples, beta doses were used, using a 90Sr/90Y source which provided a dose rate of 0.120 ± 0.003 Gy s–1. To estimate the equivalent doses (D e), the single-aliquot regenerative dose (SAR) protocol was used and recovery tests were carried out (Murray and Wintle Reference Murray and Wintle2000, Reference Murray and Wintle2003).
Bulk samples were analyzed by X-ray fluorescence spectroscopy and mass spectrometry with inductive coupling plasma (ICP-MS) to assess the concentration of K, U and Th. To estimate the annual dose (D r), the alpha dose was ignored, and the beta dose was corrected and estimated from the concentration in U, Th and K (Brennan Reference Brennan2003) within the mortar. Secular equilibrium is assumed in the U and Th decay chains. Guerin et al. (Reference Guerin, Mercier and Adamiec2011)’s conversion factors were used. The gamma and cosmic doses were estimated by means of three different methods: (i) Al2O3:C TLD / OSLDs were placed, at each sampled point, (ii) the gamma radiation was measured with a GV Instrument, GRS-2000 gamma-ray spectrometer and (iii) a geometrical model was used as proposed by Feathers et al. (Reference Feathers, Johnson and Kembel2008), based on the content in radioisotopes of the samples and the rock from the masonry. In the latter case, the cosmic dose was estimated and added following Prescott and Hutton (Reference Prescott and Hutton1994), although in buildings, it is difficult to estimate this dose accurately (Sanjurjo-Sánchez et al. Reference Sanjurjo-Sánchez, Gómez-Heras, Fort, Álvarez de Buergo, Izquierdo and Bru2016).
RESULTS
Dose Rate
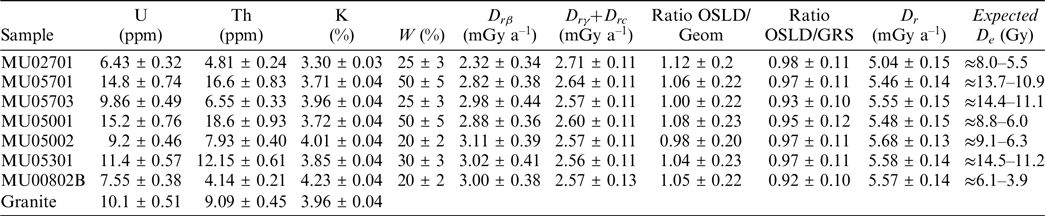
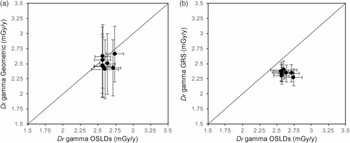
The concentration of U, Th and K is highly variable in the mortar samples (Table 2). The studied mortars are porous and in some cases the porosity exceeds 50%. The crypt is close to the water ground level and the humidity is high throughout the year. So, humidity values were estimated at between 20 and 50%. The beta dose rates obtained range between ≍2.3 and ≍3.1 mGy yr–1. To estimate gamma and cosmic D r, we compared the results obtained by OSLDs, GRS and a geometric model to which the cosmic dose was added. The D r obtained by OSLDs and the geometric model coincide very well but there seems to be a systematic underestimation (around <10%) when the GRS data is compared to the results of using the geometric model (Table 2 and Figure 3). This slight underestimation of the GRS could probably be due to the fact that the GRS measurements were made on the surface of the sampled joints, and not inside, given that their thickness was not sufficient to introduce the probe. However, the differences are not significant for the three methods used, if we consider a ratio of 0.9 and 1.1 between the three estimates (Table 2). The agreement between the OSLDs and the geometric model can be attributed to the fact that the dated structures are constructed from blocks of the same type of granite, with a homogeneous gamma dose. Data from OSLDs was eventually used to assess the D rs. As a result, the total D r values obtained are high, namely between 6.23 ± 0.12 and 5.04 ± 0.15 mGy yr–1 (Table 2).
Results of the concentration of U, Th and K in the samples, estimated water content (W), beta dose rate (D rβ) and gamma+cosmic (D rγ+D rc) dose rates, total dose rate (D r) and expected D es. The ratios or the estimates of the gamma+cosmic dose rate with the different used methods are also included. The Dose rates and expected D es were estimated for a grain size of 300–500 μm. Note: OSLDs (OSL dosimeters), Geom (geometry estimate), GRS (in situ gamma ray spectrometry).

Comparison of the external Drs obtained by the three different methods used: (a) OSLDs vs. geometric model; (b) OSLDs vs. GRS.

Equivalent Doses and Ages
Prior to the estimation of the D e, bleaching tests were carried out on all the samples. Several aliquots of each sample were exposed to blue LEDs in the Riso DA-15 for 40 seconds and a second identical exposure after a 10,000-s. These aliquots were irradiated with 5 Gy and then subjected to exposure under blue LEDs for times of 0.5 s, 1 s, 10 s and 100 s. It was observed that the intensity of the natural signal was reduced by 80% after 1 s of exposure and by 90% after 1.5–2 s of exposure in all samples.
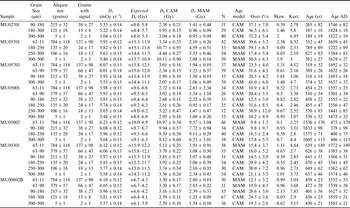
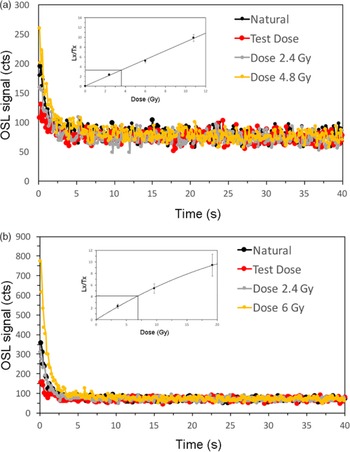
The D e was estimated in several grain sizes per sample. Multigrain aliquots of 2 mm diameter were mounted and the number of grains per aliquot was estimated from Heer et al. (Reference Heer, Adamiec and Moska2012) considering a packing ratio of 65% and a 15% error margin in the estimate of the number of grains (Table 3). The proportion of grains which contributes to the OSL signal in multigrain aliquots in both sediments and mortars is variable, but usually ranges from 5% to 30% of the grains (Jacobs and Roberts Reference Jacobs and Roberts2007; Duller Reference Duller2008 Medialdea et al. Reference Medialdea, Thomsen, Murray and Benito2014; Urbanova et al. Reference Urbanová, Hourcade, Ney and Guibert2015; Arnold et al. Reference Arnold, Duval, Demuro, Spooner, Santonja and Perez-Gonzalez2016; Urbanova and Guibert Reference Urbanová and Guibert2017). This range has been taken to estimate the number of quartz grains that can contribute to the OSL signal in each grain size. Thus, for aliquots of a grain size less than 180 μm, the number of grains of each aliquot is 215 ± 32 or greater, with the estimated number of grains contributing to the signal of 38 ± 27 grains or more, depending on the considered grain size (Table 3). However, for aliquots of a grain size of 300–500 μm, the number of grains will be 5 ± 1, with the estimated number of grains contributing to the 2 ± 1 signal. Therefore, we can consider that grain sizes >300 μm work as pseudo-single grains (Arnold et al. Reference Arnold, Demuro and Navazo Ruiz2012), which allows us to compare D e obtained from these pseudo-single grains with multigrain aliquots of different sizes represented by the other grain sizes. Figure 4 shows the OSL decrease curve for samples MU05001 and MU05301 in grain size 300–500 μm. It also shows the dose response curve of the OSL signal normalized with the dose test. These curves are representative of almost all samples, which have a very similar behavior.
Results obtained for OSL ages obtained for each grain size, with the assessed equivalent doses and expected ones. Note: Over.: overdispersion; Skew: Skewness; Kurt.: Kurtosis. The aliquot size was estimated from Heer et al. (Reference Heer, Adamiec and Moska2012) and the grains with signal is a theoretical estimation considering that between 5 and 30% of grains of each aliquot provide OSL signal. The column “Age model” provides the age model used to assess the age of the mortar. The reference year for the AD ages is 2011.

OSL decay curves and dose-response growth curves (inset) of samples (a) MU05001, and (b) MU05301. They were obtained from small aliquots of grain size 300–500 m, containing 51 grains.

The distributions of D es obtained were generally symmetrical and with low dispersion. the central age model (CAM) and the minimum age model (MAM) proposed by Galbraith et al. (Reference Galbraith, Roberts, Laslett, Yoshida and Olley1999) were used to estimate the D es and the ages (Table 3). The average overdispersion values of the observed CAM were variable between different grain sizes of the same sample and samples, ranging between 9.8 ± 1.5 and 50.3 ± 6.3%. The ages obtained with both models were compared with the expected D es (Table 3). Expected ages (Table 1) considered the construction phases, the chronology obtained in the archaeological and historical study, and the assessed D rs.
The D e and age of each sample was estimated for various grain sizes. In most samples and grain sizes, the ages obtained provide coincident ages. Only in samples MU05703, MU05002 and MU05301, did the grain size of 11–63 µm provide a different age with the CAM to the other grain sizes (Table 3). However, the use of the MAM in this fine grain (11–63 µm) size provided an age coinciding with the CAM in the coarser grain sizes. In sample MU08002B, the finest grain sizes (11–63, 63–90 and 90–180 μm) also provide the same age via the MAM as coarser grain sizes (180–300 and 300–350 μm) using the CAM. Sample MU05701 is the sole exception since each grain size provides a different age. This seems to indicate a tendency that the bleaching of the signal is smaller in the finer grain sizes, at least for some of the samples studied. Thus, we can consider that the results obtained from coarser grains are more confident and almost all allow assess the age with the CAM model.
When comparing the D es and ages obtained with those expected, two trends are also observed. Except for sample MU05002 and MU05301, all samples have lower D es and more recent ages than expected. However, the ages obtained for most grain sizes of each sample coincide among them. That is, most grain sizes provide a same age for a same sample, and the ages of some of the dated mortars also coincide.
DISCUSSION
Dose Rates and Expected Equivalent Doses
As can be seen in Table 2, the concentration of U and Th in the mortars is highly variable, despite the fact that in all of them they are similar-looking earthen mortars. Even if we consider the mortars of the same construction phase, significant differences are seen in the concentration of radioisotopes. The analysis of the granite blocks used for the construction of the crypt shows an intermediate U and Th concentration compared to the range of mortar concentrations. However, the concentration of K is similar in all samples. Around the crypt, there are many agricultural soils and colluvial sediments, so they are the likely source of raw materials for the mortars. These soils and sediments are located on granite which is rich in potassium feldspar. This explains the similar concentration of K in mortars and granite. However, there are clear differences in the U/Th ratio of mortars, and there is no correlation seen between the U/Th ratio for each construction phase. This seems to indicate that the preparation of the mortars was done by mixing different grain sizes or raw materials, which also explains the large porosity differences (between 20 and 50%).
Apart from the differences between mortars, the concentration of radioisotopes in these and in the rock is very high. This is very common in granitoid rocks of the Northwest of the Iberian Peninsula (Sanjurjo-Sánchez and Barrientos Reference Sanjurjo-Sánchez and Barrientos2018), which have high concentrations of U compared to the average values considered for these rocks (Boyle Reference Boyle1982; Gascoyne Reference Gascoyne, Ivanovich and Harmon1992). Consequently, the rates of terrestrial gamma radiation and radon concentration in the air are also high in this area of Spain (MARNA 2000; CSN 2017). This explains the high D rs obtained, despite the fact that they are very porous mortars and practically saturated in water due to the high humidity which exists in the crypt. The high dose rates imply that the expected D es are also high, between 14.5 and 3.9 Gy (Tables 2 and 3), for mortars whose expected age ranges from more than 2000 years to approximately 600 years.
A priori, a greater D r and D e, implies higher natural OSL signals and with a higher signal/background ratio, which implies a lower estimated expected error in the D e. On the other hand, the high concentration of radioisotopes implies a greater presence of minerals which emit beta radiation, which will hypothetically reduce the possible effects of beta microdosimetry on the distribution of the D es obtained (Mayya et al. Reference Mayya, Morthekai, Murari Madhav and Singhvi2006). In lime mortars, the effects of beta microdosimetry in D e may be significant because the concentration of U, Th and K in the binder and the aggregate is different. This may make it necessary to estimate this microdosimetry by means of Beta-autoradiography or Scanning Electron Microscopy and consider its effect on the dispersion of D es obtained (Urbanova et al. Reference Urbanová, Hourcade, Ney and Guibert2015; Urbanova and Guibert Reference Urbanová and Guibert2017). However, in earthen mortars, the expected beta microdosimetry heterogeneity will be lower, as they are less heterogeneous, and will be even lower when the concentration of radioisotopes is higher (Mayya et al. Reference Mayya, Morthekai, Murari Madhav and Singhvi2006).
Finally, the lower the historical D es, the greater the probability that any incomplete bleaching of the quartz signal in the mortar will lead to an overestimation of the D e and age. Although there is no agreement on at what D e or age the partial bleaching of a sample’s quartz is reduced to have an insignificant effect, it is well known that, with higher D es the effect of partial bleaching is reduced, as observed in young sediments (Madsen and Murray Reference Madsen and Murray2009). A high D r implies a high historical D e. If there are few incompletely bleached quartz grains or the level of bleaching is high in most of them, it is more unlikely to obtain an overestimation of the D e and the age of each sample. In this case, there will also be less expected dispersion of the aliquots and the distribution will tend to be symmetrical. This fact reduces the risk of overestimating the age using multigrain aliquots, although, previously published studies of OSL dating of mortars indicate that the use of single-grain provides a better result than multigrain aliquots due to incomplete bleaching of the signal in many grains (Urbanova et al. Reference Urbanová, Hourcade, Ney and Guibert2015; Guibert et al. Reference Guibert, Christophe, Urbanová, Blain and Guérin2017; Panzeri et al. Reference Panzeri, Cantù, Martini and Sibilia2017; Urbanova and Guibert Reference Urbanová and Guibert2017). It must be pointed out that, in most of these studies, the estimated D rs usually range from 1 to 2.5 mGy/a for Roman to medieval or younger mortars. This means that expected D es will range from ;< 1 to 5 Gy. In this study, the average D es range from ≍2 Gy for the younger sample to ≍11 Gy for the oldest one. A high D r was also assessed for mortars successfully dated by quartz multigrain aliquots (Stella et al. Reference Stella, Fontana, Gueli and Troja2013, Reference Stella, Almeida, Basilio, Pasquale, Dinis, Almeida and Gueli2018), including some previous case studies in NW Spain (Sanchez-Pardo et al. Reference Sánchez-Pardo, Blanco-Rotea and Sanjurjo-Sánchez2017a, Reference Sanchez-Pardo, Blanco-Rotea, Sanjurjo-Sanchez and González-García2018, Reference Sanchez-Pardo, Blanco-Rotea, Sanjurjo-Sanchez and Barrientos-Rodríguez2019).
Equivalent Doses and Ages
Using several grain sizes to obtain several D es> and ages for each sample gives the advantage that one can check if the D e is larger in one grain size than in another for the same sample. Assuming that the mortars have been prepared by mixing raw materials (see previous section) one grain size may well have been bleached to a greater extent than another during the mixing process. A priori, it can be expected that smaller grain sizes can be bleached to a lesser extent because they tend to aggregate more than larger grain sizes. This is observed for the 11–63-μm grain sizes of three samples and the <180-μm grain size of another one. In two samples (MU02701 and MU05001) no differences between grain sizes are observed and only one sample (MU05701) shows significant differences in the D es obtained for different grains sizes through the CAM and MAM (Table 3).
It is noteworthy that when the age is estimated by means of the MAM for the fine grain (11–63 μm) the age obtained is the same as that estimated for the other grain sizes (>63 μm) by means of the CAM in some samples (MU05703, MU05002, MU05301). Thus, the MAM seems to provide reliable ages with multigrain aliquots for some fine grains affected by partial bleaching. In the sample MU00802B, the age obtained with the CAM for grain sizes >180 μm (11–63, 63–90 and 90–180 μm) is different from that obtained for the two coarser grain sizes (180–300 and 300–500 μm). However, the age obtained by means of the MAM of the grain sizes < 180 μm slightly overestimates the age obtained by means of the CAM for the grain sizes >180 μm (Table 3). This overestimation can be attributed to incomplete bleaching of the signal in smaller grain sizes. In all these cases, we see that for the same sample, the symmetry and kurtosis coefficients of those fine grain sizes affected by partial bleaching are greater than in other grain sizes, except in the sample MU05002. A correlation between skewness and partial bleaching have been previously reported in sediments (Wallinga Reference Wallinga2002).
To interpret these results, one must also take into account that, in the multigrain aliquots used, the number of grains (of which they are composed) is very different in the fine grain aliquots than in the of coarse grain aliquots, where the number of grains is far lower. In all samples, except in MU05701, the coarser grain sizes (> 180 μm) seem to provide a consistent and not overestimated age, probably due to the fact that their bleaching was complete and the multigrain aliquots used in these are composed of few grains (between ≍135 ± 20 and ≍5 ± 1), as the number of grains contributing to the OSL signal is low (between ≍24 ± 17 and 2 ± 1). No significant correlation is seen between the overdispersion of the CAM mean and the age obtained for each grain size. This is possibly due to the fact that the number of grains (and grains which contribute to the signal) is different for each grain size, so it is difficult to establish a correlation between this parameter and the partial bleaching of the signal. However, the overdispersion of half of the samples for grain size 300–500 µm is low (<20%), except for younger samples (MU02701, MU05701 and MU05703).
Archaeological Interpretation of the Results
The D es obtained through the CAM are significantly far lower than expected. As a consequence, the ages obtained are also lower than expected for all samples except MU05002 and MU05301. However, in almost all samples the ages obtained for the different grain sizes are consistent with each other, except for sample MU05701 (Table 3) and for grain size 90–180 of sample MU00802B which slightly overestimates the age of the other grain sizes. Despite this result, there are several issues that indicate that the ages obtained are reliable for all samples except MU05701. On the one hand, when using multigrain aliquots there is a risk of overestimating the ages of the mortars, but the ages obtained are younger than expected. On the other hand, the deviations observed between the expected ages and those obtained are not systematic, that is, they are different for almost all samples. As an example, the expected age for the sample MU02701 was 5th to 9th century whereas that obtained is 18th–19th century, while the expected age for MU05703 was from the 7th century BC to the 1st century AD, and that obtained is from the 17th century. Therefore, a deviation caused by the estimation of some parameter such as D r is not observed (either D r beta or D r gamma).
There is also an archaeological argument that supports the reliability of the ages. Except the MU05002 wall infill mortar that matches the expected age, all samples correspond to surface joint mortars. These mortars tend to erode and are often replaced. In this case, they would have been replaced with new earthen mortars at different times. This is consistent with the differences observed in the radioisotope content and porosity of the mortars for the same construction phase. Archaeological studies suggest that in the crypt and its surroundings there is evidence of continued occupation and use throughout history (García Quintela Reference García Quintela2014; Blanco-Rotea et al. Reference Blanco-Rotea, García Rodríguez, Mato-Fresán and Sanjurjo-Sánchez2015), which is consistent with the ages obtained in this study. The ages obtained for the sample MU05001 and MU00802B are coincident with one another (16th century) while that obtained for MU05703 is slightly more recent (17th century) and coincides with the most recent ages obtained for the sample MU05701. This implies that at that in these periods, mortars were replaced. In any case, the age of sample MU05002 demonstrates that this is one of the oldest early medieval buildings in NW Spain.
CONCLUSIONS
In this study, seven mortar samples from the Crypt of the Basilica da Ascensión (northwestern Spain) have been successfully dated from multigrain quartz aliquots composed of several grain sizes, using the archaeological chronology established for the different construction phases of the building as reference ages.
The gamma and cosmic D r has been estimated using three methods that have provided matching results. This has allowed reliable D rs to be obtained which have been used to calculate the estimated D es according to archaeological chronology. The D es of various grain sizes have been estimated for each sample, obtaining younger ages than expected except for two samples. However, for most samples the D es and ages obtained for the different grain sizes coarser than <63 µm coincide. Since the aliquots of the different grain sizes contained a very variable number of grains, this seems to indicate the absence of partial bleaching of the signal. It is only in the finest grain size of some samples where we see a slight overestimation of the D e and age observed, as compared to the other grain sizes, which can be attributed to partial bleaching. This seems to indicate that coarser grain sizes probably underwent better bleaching during mortar preparation.
Although the ages obtained are significantly younger than expected (except in two samples), it can be seen that the ages are consistent with the archaeological data, since there is evidence of occupation and use of the crypt in a continuous manner until the 20th century. This age can be explained by the repair of joint mortars in different historical periods (between the 16th and 19th centuries). Using several quartz grain sizes for OSL dating of mortars means that the D es and ages obtained with each size for the same sample can be compared so that the possible effect of partial bleaching in the resulting ages can be observed.
ACKNOWLEDGMENTS
The authors thank the “Consolidation of a line of research in Landscape Architecture and Change (LARCH) focused on Historical Archaeology, Landscape Archaeology and Architectural Archaeology” postdoctoral project financed with a grant to support the postdoctoral training stage of the Galician I+D+i System (Mode B, Call 2019) obtained by Rebeca Blanco-Rotea. The Research Unit “Syncrisis” of the Santiago de Compostela University (Spain) received support from the Xunta de Galicia programme “Consolidación y estructuración de unidades de investigación competitivas: Grupos de referencia competitiva” (ED431C 2018/01) and Redes de investigación (R2017/008). The University Institute of Geology of the University of A Coruña (Spain) received support from the Xunta de Galicia from the program “Consolidación y estructuración de unidades de investigación competitivas: Grupos de potencial de crecimiento” (GPC2015/024) and Redes de investigación (R2017/008).