The study of optical surface waves has been an active and growing field of research for many decades, and one which has benefitted greatly from recent advances in nanopatterning and -structuring. These advances have allowed for the demonstration of nanoscale, sub-diffraction optical structures, and devices based on the strong optical confinement achievable with tightly bound surface waves. The vast majority of these works have focused on surface plasmons, polariton excitations consisting of charge density oscillations coupled to propagating or localized electromagnetic modes—sometimes referred to as “particle plasmons”[ Reference Chern, Liu and Chang 1 , Reference Koller, Hohenester, Hohenau, Ditlbacher, Reil, Galler, Aussenegg, Leitner, Trügler and Krenn 2 ] or “Mie plasmons”[ Reference Derom, Vincent, Bouhelier and Francs 3 – Reference Foteinopoulou, Vigneron and Vandenbem 5 ]—at the interface between a conductor and dielectric.[ Reference Heitmann and Raether 6 – Reference Zia, Schuller, Chandran and Brongersma 9 ] Such excitations form the basis of the field of plasmonics, and have been utilized to demonstrate a wide range of novel optical and optoelectronic devices.[ Reference Weeber, Lacroute and Dereux 10 – Reference Noginov, Zhu, Belgrave, Bakker, Shalaev, Narimanov, Stout, Herz, Suteewong and Wiesner 14 ] Typically, the field of plasmonics has utilized noble metals (particularly Au and Ag) as their plasmonic materials. For such traditional plasmonic materials, strong subwavelength confinement occurs when the real part of the permittivity is negative, and of the order of the surrounding dielectric's (positive) permittivity; for Au and Ag, this occurs in the visible to near-IR wavelength ranges.[ Reference Johnson and Christy 15 ] At longer wavelengths, traditional plasmonic materials begin to behave more like perfect electrical conductors, precluding much of the subwavelength confinement associated with these metals’ plasmonic behavior.[ Reference Law, Podolskiy and Wasserman 16 ]
Thus, for longer wavelength optoelectronics, there has been a growing interest in a class of “engineered” plasmonic materials, whose optical properties (permittivity) can be optimized for the operational wavelength of interest. These materials include conducting oxides and nitrides,[ Reference Naik, Kim and Boltasseva 17 – Reference Naik, Schroeder, Ni, Kildishev, Sands and Boltasseva 19 ] silicides,[ Reference Cleary, Peale, Shelton, Boreman, Smith, Ishigami, Soref, Drehman and Buchwald 20 ] and germanides[ Reference Cleary, Streyer, Nader, Vangala, Avrutsky, Claflin, Hendrickson, Wasserman, Peale, Buchwald and Soref 21 ] in the near-IR to mid-IR (1–5 µm) and doped semiconductors such as Si,[ Reference Ginn, Jarecki, Shaner and Davids 22 – Reference Rosenberg, Surya, Liu, Streyer, Law, Suzanne Leslie, Bhargava and Wasserman 25 ] InAs,[ Reference Law, Yu and Wasserman 26 ] InSb,[ Reference Law, Liu and Wasserman 27 ] and InAsSb[ Reference Ntsame Guilengui, Cerutti, Rodriguez, Tournié and Taliercio 28 ] for mid-IR to far-IR (>4 µm) wavelengths. Very recent results have identified another oxide, cadmium oxide, as a promising tunable and low-loss plasmonic material in the mid-IR (3–6 µm).[ Reference Sachet, Shelton, Harris, Gaddy, Irving, Curtarolo, Donovan, Hopkins, Sharma, Sharma, Ihlefeld, Franzen and Maria 29 ] These materials not only provide the designer with the ability to tailor the plasmonic materials’ optical properties, but in the case of doped semiconductors, also offer the potential for single-crystal, wavelength flexible plasmonic materials which can be seamlessly integrated into electronic or optoelectronic materials in a single growth. Ultimately, it is the free-carrier response of both traditional plasmonic materials and the new class of engineered plasmonic materials, most often described using the straightforward Drude model, which results in the negative real permittivity that allows these materials to support both propagating surface plasmon polaritons (SPPs) and localized surface plasmons (LSPs). From a macroscopic point of view, Maxwell's Equations care little where a material's negative permittivity comes from. Thus any material having negative permittivity (and reasonably low losses) can support such surface modes, which has led to interest in materials capable of supporting both propagating and localized surface phonon polaritons (SPhPs and LSPh's, respectively). Unlike their plasmonic brethren, these phononic surface modes are polariton excitations of lattice vibrations (phonons) and electromagnetic waves, which, like the closely related plasmonic modes, exist at the interface of the phononic material (dielectrics with polar lattices) and a dielectric in a wavelength range where the phononic material has negative real permittivity. This wavelength range occurs in the material's Reststrahlen band, corresponding to energies between the longitudinal and transverse optical (LO and TO, respectively) phonons, and can result in the same subdiffraction confinement observed in SPP and LSP modes, often with lower losses.[ Reference Khurgin 30 ] The Reststrahlen bands of most semiconductors, save for those composed of more lightweight atomic constituents, will fall in the far-IR range of the electromagnetic spectrum. Further exploration of optical processes in semiconductor Reststrahlen bands presents an opportunity for development of novel sources, detectors, and materials in the far-IR region, which has not seen the same advance in optical infrastructure available in the mid-IR and shorter wavelength regions.[ Reference Feng, Streyer, Zhong, Hoffman and Wasserman 31 ] Due, in large part, to the wide availability of mid-IR optical components, much of the work investigating surface phonons has used materials of lighter atomic mass—most notably silicon carbide (SiC),[ Reference Caldwell, Lindsay, Giannini, Vurgaftman, Reinecke, Maier and Glembocki 32 ] and very recently—hexagonal boron nitride (hBN).[ Reference Jacob 33 ] SiC is a highly polar material with strong, high-frequency phonon resonances in the mid-IR (~10–12 µm), and has been shown to support both propagating[ Reference Greffet, Carminati, Joulain, Mulet, Mainguy and Chen 34 – Reference Neuner, Korobkin, Fietz, Carole, Ferro and Shvets 37 ] and localized phononic modes.[ Reference Wang, Li, Hauer, Chigrin and Taubner 38 , Reference Caldwell, Glembocki, Francescato, Sharac, Giannini, Bezares, Long, Owrutsky, Vurgaftman, Tischler, Wheeler, Bassim, Shirey, Kasica and Maier 39 ] Recent work has investigated the mid-IR phononic modes of the polar van der Waals crystal, hBN, which is particularly noteworthy, as this material exhibits both low losses and natural, dual-type hyperbolic responses. Recent work investigating hBN polaritons has demonstrated strongly confined modes propagating over relatively long distances,[ Reference Dai, Fei, Ma, Rodin, Wagner, McLeod, Liu, Gannett, Regan, Watanabe, Taniguchi, Thiemens, Dominguez, Neto, Zettl, Keilmann, Jarillo-Herrero, Fogler and Basov 40 ] as well as highly confined three-dimensional modes.[ Reference Caldwell, Kretinin, Chen, Giannini, Fogler, Francescato, Ellis, Tischler, Woods, Giles, Hong, Watanabe, Taniguchi, Maier and Novoselov 41 ]
The above work has focused on the mid-IR wavelength range, where there already exists a relative wealth of optical components. In an effort to leverage these exciting results for the development of the far-IR optical infrastructure, there has been recent interest in investigating similar surface modes in III-nitride and III–V semiconductors, which offer a path toward integration of phononic surface modes with optoelectronic structures,[
Reference Soref, Qiang and Zhou
42
] as well as a potential mechanism for developing sub-diffraction optical elements at far-IR wavelengths, and, more fundamentally, offering a mechanism for linking lattice vibrations resonances to free-space light. Recent work has shown LSPh's on GaN[
Reference Feng, Streyer, Islam, Verma, Jena, Wasserman and Hoffman
43
] (
 $\lambda \sim 15\,{\rm \mu m}$
) and SPhPs on GaP[
Reference Streyer, Law, Rosenberg, Roberts, Podolskiy, Hoffman and Wasserman
44
] (
 $\lambda \sim 25\,{\rm \mu m}$
) and GaAs[
Reference Vassant, Marquier, Greffet, Pardo and Pelouard
45
,
Reference Vassant, Pardo, Bouchon, Hadar, Marquier, Greffet and Pelouard
46
] (
 $\lambda \sim 35\,{\rm \mu m}$
). Unfortunately, the majority of materials supporting surface phonon modes have nowhere near the wavelength flexibility of their plasmonic counterparts. The negative permittivity range of these materials is typically quite narrow, extending only from near the LO phonon energy to the TO phonon (the semiconductor's Reststrahlen band), though near the TO phonon energy extremely large losses dominate the optical response of the materials. In this work, we demonstrate that by combining the control of optical parameters offered by doping and the fixed optical response of phonon resonances, we are able to engineer materials which support hybrid phononic/plasmonic surface modes, effectively extending the range of negative permittivity associated with a semiconductor's Reststrahlen band. In particular, this work demonstrates coupling of hybrid surface modes at or near the LO phonon energy, which is one of two epsilon near zero (ENZ) points in the Reststrahlen band of undoped semiconductors, where these undoped materials cannot support surface modes. The lightly doped material shifts the corresponding ENZ point to higher energy[
Reference Olson and Lynch
47
]—permitting surface modes near the LO phonon energy and suggesting the opportunity for further work that may enable free space out-coupling of vibrational lattice modes.[
Reference Gu, Tani, Sakai and Yang
48
–
Reference Dekorsy, Auer, Waschke, Bakker, Roskos, Kurz, Wagner and Grosse
51
] It should be noted that merely shifting the Reststrahlen band to a different wavelength range can be accomplished by choosing different semiconductors or their alloys. However, regardless of the intrinsic material chosen, surface polaritons cannot be sustained near the LO phonon energy without some additional modification of the material's permittivity—such as light doping.
Many other works have investigated hybrid bulk plasmon/phonon modes in semiconductors[ Reference Singwi and Tosi 52 , Reference Kim and Spitzer 53 ]—some specifically in GaAs.[ Reference Kukharskii 54 – Reference Vallée, Ganikhanov and Bogani 56 ] Additionally, many recent works have observed hybrid surface plasmon/phonon modes at heterostructure interfaces[ Reference Hwang, Sensarma and Das Sarma 57 – Reference Brar, Jang, Sherrott, Kim, Lopez, Kim, Choi and Atwater 61 ] with plasmonic modes supported in one material and phononic modes supported in the other. However, few works have considered hybrid surface modes supported in the same material. We grow moderately doped layers of GaAs above semi-insulating (SI) GaAs, and pattern this material into one-dimensional (1D) grating structures capable of supporting both propagating and localized hybrid phonon/plasmon modes. We demonstrate coupling to these hybrid surface excitations and show that by controlling the doping of our epitaxially grown GaAs, we are able to support hybrid surface modes outside the traditional Reststrahlen band of GaAs.
In this work, we investigate three samples. Sample A is a wafer of SI-GaAs, while samples B and C have 2 µm of lightly (n B = 6 × 1017 cm−3) and highly (n C = 3.8 × 1018 cm−3) doped GaAs, respectively, grown on SI-GaAs substrates. At the far-IR wavelengths of interest (30–40 µm), sample A will only support phonon polaritons, while the surface modes of the sample C will largely be plasmonic. Sample B will support hybrid modes, as the negative permittivity due to free-carrier and lattice effects will be of the same order. Our samples are characterized by far-IR Fourier transform infrared (FTIR) polarization- and angle-dependent reflection spectroscopy in a Bruker v80v FTIR using a Mylar beamsplitter and far-IR DTGS detector. Two reflection accessories were used to measure the sample reflection within the FTIR's vacuum sample chamber, mitigating atmospheric absorption signatures in our spectra. The first, a Pike Technologies 10spec reflection accessory allows for fixed 10° incident angle reflection and is used to measure reflection from the as-grown samples (from which we are able to extract the layer permittivity), as well as to measure reflection from 1D-patterned samples as a function of sample rotation about the surface normal. The second is a Pike Technologies VeeMAX III, which allows for variable angle reflectance from 30° to 80° incidence angles. Our materials and patterned samples are modeled using rigorous coupled wave analysis (RCWA).[ Reference Moharam and Gaylord 62 – 64 ] We model the permittivity of our materials using a combination of the Drude model (for the free-carrier effects) and a dual Lorentz oscillator model for the phonon response,[ Reference Moore and Holm 65 ] such that:
 $$\eqalign{\varepsilon (\omega ) & = {\varepsilon _{{\rm Drude}}}(\omega ) + {\varepsilon _{{\rm phon}{\rm.}}} (\omega ) \cr & = - \displaystyle{{{\varepsilon _\infty} \omega _{\rm p}^2} \over {\omega (\omega + i\gamma )}} + \displaystyle{{({\varepsilon _0} - {\varepsilon _\infty} )\omega _{TO}^2} \over {\omega _{{\rm TO}}^2 - {\omega ^2} + 2i\omega {{\rm \Gamma} _{{\rm ph}}}}} \cr & \quad + \displaystyle{{({\varepsilon _\infty} - {\varepsilon _{{\rm uv}}})\omega _{{\rm vis}}^2} \over {\omega _{{\rm vis}}^2 - {\omega ^2} + 2i\omega {{\rm \Gamma} _{{\rm vis}}}}} + {\varepsilon _{{\rm uv}}},}$$
 $$\omega _{\rm p}^2 = \displaystyle{{{e^2}n} \over {{m^*}{\varepsilon _{\rm o}}{\varepsilon _\infty}}}, \; \quad \sqrt {\displaystyle{{\varepsilon (\infty )} \over {\varepsilon (0)}}} = \displaystyle{{{\omega _{{\rm TO}}}} \over {{\omega _{{\rm LO}}}}}.$$
Here, ε uv, ε ∞, and ε 0 are, respectively, the high- and low-frequency and static contributions to the background permittivity of the semiconductor; ω TO and ω LO the transverse and LO phonon frequencies [related by the Lyddane–Sachs–Teller relation in Eq. (1b)], γ and Γph the plasmon and phonon scattering rates, and plasma frequency ω p, which depends on the free-carrier density n and effective mass m*, and which we define as the frequency at which the free-carrier contribution to the permittivity negates the high-frequency background permittivity as in Eq. (1b). The second high-frequency oscillator, centered at ω vis and dampened by Γvis, is an approximation of the near-IR and visible contributions to the permittivity. The parameters used to model each sample's permittivity are listed in Table I.
Parameters for each sample used in the permittivity model as described in Eq. (1).

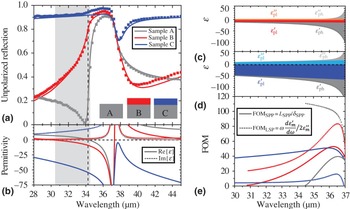
Figure 1 shows the experimental (squares) and modeled (lines) reflection at 10° incidence angle from the unpatterned samples studied in this work. The layered systems are modeled using RCWA with the material permittivity given by the expressions in Eq. (1), with our modeled reflectivity matching the experimental data closely across the wavelength range of interest. The extracted permittivity for the lightly doped epilayer sample (B), shown in Fig. 1(b), clearly demonstrates that we are able to extend our region of negative permittivity well past the LO phonon energy (marked with the vertical dashed line), giving the opportunity to engineer hybrid surface modes outside the Reststrahlen band. The additional spectral range in which we are able to support surface waves is shaded in Fig. 1. Of course, the heavily doped sample can support surface waves across a much greater portion of the far-IR, but these waves are predominantly plasmonic, and have little polarization resulting from the lattice. This is shown in Figs. 1(c) and 1(d) where we plot the real and imaginary contribution to the material permittivity from lattice vibrations (ε
ph′ and
 $\varepsilon _{{\rm ph}}^{\prime \prime}$
, respectively) and free carriers (ε
pl′ and
 $\varepsilon _{{\rm pl}}^{\prime \prime}$
, respectively). As can be seen from these plots, at the edge of the GaAs Reststrahlen band (λ ≈ 34 μm), the permittivity of the highly doped GaAs (sample C) is dominated by the free-carrier response, while for the lightly doped sample B, lattice vibrations and free carriers contribute equally to the permittivity.
(a) Reflection spectra of unpatterned samples A (gray, SI GaAs wafer), B (red, 2 µm Si:GaAs n B = 6 × 1017cm−3), and C (blue, 2 µm Si:GaAs n C = 3.8 × 1018 cm−3). (b) Extracted real (solid) and imaginary (dashed) components of the permittivity of samples A (gray), B (red), and C (blue). Inset in (a) shows the structure of unpatterned samples studied. Stacked area plots show the contributions to the real and imaginary permittivity in (c) sample B and (d) sample C from free carriers and lattice vibrations. (e) Calculated FOM for LSP(h)'s (dotted) and SP(h)P's (solid) as a function of wavelength for each of the three samples (A-gray, B-red, and C-blue).

In addition, we calculate figures of merit (FOM) for SP(h)P and LSP(h) modes supported on the materials in samples A, B, and C, using the expressions:
 $${\rm FO}{{\rm M}_{{\rm SPP}}} = {L_{{\rm SPP}}}/{\delta _{{\rm SPP}}}\,\,{\rm and}\,\,{\rm FO}{{\rm M}_{{\rm LSP}}} = \omega \displaystyle{{d\varepsilon _{\rm m}^{\prime}} \over {d\omega}} /2\varepsilon _{\rm m}^{\prime \prime}, $$
where L
SPP and δ
SPP are the propagation length and penetration depth of the SP(h)P mode and εm′ and
 $\varepsilon _{\rm m}^{\prime \prime}$
are the real and imaginary components of the “metal” permittivity.[
Reference Berini
66
,
Reference Wang and Shen
67
] The results of these calculations are shown in Fig. 1(e), demonstrating that the doped GaAs offers a larger wavelength range supporting both localized and propagating modes. If we define this wavelength range by W = Δω
RB/ω
TO, where Δω
RB is the spectral width of the ε < 0 region, we see that the narrow range of the undoped sample A
 $({W_{\rm A}}\sim 0.0825)$
is more than doubled by the light doping of sample B
 $({W_{\rm B}}\sim 0.205)$
. While the FOMSPP for all three materials are similar, the FOMLSP is significantly degraded for the highly doped GaAs (sample C), a result of the additional material losses coming from free carriers. The highly doped sample can hardly be considered to support hybrid plasmonic/phononic modes, as the dominant response is largely plasmonic. Such highly doped semiconductors have been the subject of much recent work,[
Reference Ginn, Jarecki, Shaner and Davids
22
–
Reference Ntsame Guilengui, Cerutti, Rodriguez, Tournié and Taliercio
28
] but because we are interested here in characterizing hybrid phononic/plasmonic modes, we will, for the remainder of the manuscript, focus on samples A and B.
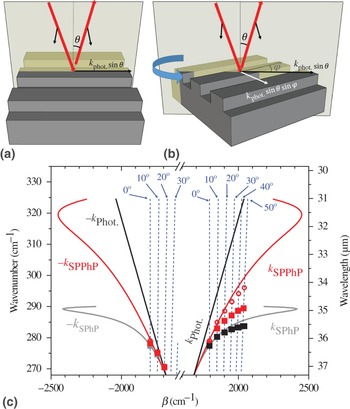
Our samples were patterned with 1D gratings in order to investigate both propagating and localized hybrid plasmon/phonon modes. The gratings add to the photon momenta in the grating direction and allow coupling to the hybrid surface modes supported on the semiconductor surface; without the gratings, direct coupling of free-space photons to the surface modes is not possible due to a momentum mismatch. Coupling to propagating SPhP modes and hybrid surface plasmon/phonon polariton (SPPhP) modes are demonstrated on samples A (intrinsic GaAs) and B (lightly doped). Samples are etched with a 1.4 µm deep, 35 µm period grating with 18 µm wide grating ridges. In this experiment, as is shown in Fig. 2, the sample is placed in the measurement chamber such that the grating lines are parallel to the plane of incidence of the incident radiation (incident with θ = 10°), which is TE polarized (the electric field is parallel to the sample surface). The sample is then rotated around the sample normal by an angle φ, changing the component of the incident photons’ momentum in the direction of the SPPhP propagation. Doing so allows us to map out a reasonable portion of the dispersion curve for the surface modes supported by our material.
Schematic representation of the experimental setup for determination of surface mode dispersion. In (a), the incident photon has no momentum in the grating direction, while in (b) the incident photon has a momentum component given by k ph.x = k o sin θ sin φ, where θ = 10°, fixed by our experimental apparatus, and φ varies from 0° to 50°. (c) Calculated dispersion of semi-infinite phononic/air (gray) and hybrid (phononic/plasmonic)/air (red) interfaces. The black line shows the dispersion of the free-space photon, while the dashed blue lines show the sum of the grating momentum and incident photon momentum in the grating direction (k ph.x + 2π/Λ), where Λ is the grating period. Coupling to the grating, as calculated by RCWA, is shown for the undoped sample A (black squares), the doped epilayer of sample B (red squares), and a hypothetical sample of infinite thickness, doped to the same concentrations as sample B (red circles).

Figure 2 shows the calculated dispersion curves for both our undoped (gray) and doped (red) GaAs, calculated assuming GaAs and air occupying the half spaces z < 0, z > 0, respectively. The red and black squares correspond to coupling energies/wavevectors as calculated using RCWA simulations of our actual structures. The divergence of the RCWA data from analytical calculations are a result of the finite thickness of the doped layer used in the RCWA, as can be seen by the red circles in Fig. 2, which show coupling energies/wavevectors for infinitely thick lightly doped GaAs. Even with the finite thickness (~λ 0/15) of the doped GaAs, a clear shift of the dispersion curve of the SPPhP is predicted, when compared with the SPhP, effectively extending the GaAs Reststrahlen band with the now hybrid plasmonic/phononic modes.
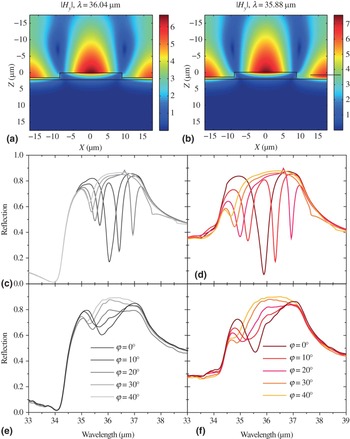
Figure 3 shows the experimental and RCWA simulated TE-polarized reflection spectra for both the doped and undoped samples studied in this work. Though the observed experimental reflection dips are not quite as strong as those predicted in RCWA, most likely a result of fabrication-related variation in sample geometry or the finite angular spread of the incident light in our experimental apparatus, which can broaden the narrow (~4 cm−1) coupling features, a clear signature of coupling to surface modes is experimentally observed, along with the splitting of the reflection dips as the sample is rotated about the surface normal.
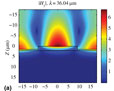
Magnetic field |H y | plots at λ ~ 36 µm and λ = 35.9 µm, corresponding to the normal incidence coupling wavelengths for the (a) undoped and (b) doped samples A and B, respectively. TE-polarized (c, d) RCWA-simulated and (e, f) experimental reflection from (c, e) undoped SI GaAs (sample A) and (d, f) 2 µm Si:GaAs N D = 6 × 1017 cm−3 (sample B). Each sample is patterned with a 1D grating with period Λ = 35 µm, ridge width w = 18 µm, and ridge depth d = 1.4 µm.

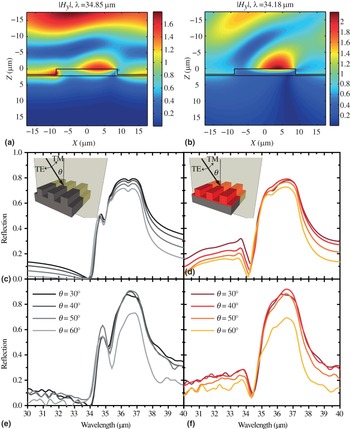
In addition to being able to support SPPhP modes, our samples also display evidence for coupling to localized surface excitations. Figure 4 shows the TM-polarized, angle-dependent reflectivity from 1D grating samples with grating pitch Λ = 35 μm and ridge width w = 18 μm and deep-etched ridge depth d = 1.8 μm fabricated from sample A (undoped SI wafer) and sample B (2 µm Si:GaAs N
D = 6 × 1017cm−3). Strong dips in reflection are seen for samples A and B at
 $\lambda \sim 34.8\,$
and
 $\lambda \sim 34.2\,{\rm \mu m}$
, respectively. These features show no significant change with incidence angle (in stark contrast to the modes observed in Figs. 2 and 3), and can thus be attributed to localized excitations supported on the patterned ridges. In the case of the doped sample (B), the resonance results from a hybrid phonon/plasmon excitation, at or near the GaAs LO phonon energy, where undoped GaAs cannot support either localized or propagating surface phonon modes. RCWA simulations support our experimental data, with field profiles on resonance showing the strong field confinement achievable with our patterned surfaces, on resonance. In particular, the hybrid plasmonic/phononic sample shows a stronger resonance, as the substrate, at resonance, provides a low-loss, low-index material, while the undoped sample substrate has the same material properties as the ridge, weakening the simulated dip as well as the spatial localization of the mode. Our RCWA simulations agree well with our observed experimental data, with the exception of the stronger dips observed on the experimental reflection [Fig. 4(e)], which may be the result of additional localization resulting from variations in the ridge width along each ridge, coming from fabrication-related imperfections.
Magnetic field |H y| at λ ~ 34.8 µm and λ ~ 34.2 µm, for the (a) undoped and (b) doped sample, respectively, with light incident at 50° from normal. TM-polarized (c, d) RCWA-simulated and (e, f) experimental reflection from (c, e) undoped SI GaAs wafer and (d, f) 2 µm Si:GaAs N D = 6 × 1017cm−3 sample. Each sample is patterned with a 1D grating with period Λ = 35 µm and ridge width w = 18 µm and deep-etched ridge depth d = 1.8 µm. Insets in (c) and (d) show the experimental configuration.

In summary, we demonstrate coupling to far-IR surface modes on GaAs materials. While the spectral range for coupling to pure surface phonon modes is limited to the range between the GaAs LO and TO phonon energies, we show that by lightly doping the GaAs, we are able to extend the spectral range in which coupling to both propagating and localized surface modes is allowed. Unlike heavily doped semiconductor materials, the surface modes supported on our lightly doped samples have equal contributions to permittivity from both free carriers and lattice vibrations, so that such modes can be characterized as hybrid plasmonic/phononic modes. We experimentally demonstrate coupling to both propagating and localized modes, and show good agreement between our experimental data and our simulated results. We show that the localized and propagating hybrid phonon/plasmon modes can be supported at higher energies than their purely phononic counterparts, demonstrating resonances aligned with the GaAs LO phonon energy, which cannot be achieved in a purely phononic material. The results presented offer a mechanism for extending the Reststrahlen bands of semiconductor materials and potentially providing a bridge between LO phonons and free space photons at the same energy.
Acknowledgments
The authors would like to acknowledge funding from the National Science Foundation, Awards #ECCS 14-20952 (DW and WS) and #ECCS 12-20176 (AH and KF) and from the Illinois Drive Postdoctoral Fellowship (YZ). The authors gratefully acknowledge useful advice and discussion with V. Podolskiy and C. Roberts (UMass Lowell) regarding RCWA simulations.