1 Introduction
Pension reform in Latin America entailed migrating from pay-as-you-go systems to defined contribution regimes based on individual accounts, where private entities manage and invest retirement funds. Reforms thus allowed the substitution of regimes associated with administrative inefficiencies, unequal benefits, evasion, increasing fiscal pressures, and threats posed by population trends, for more efficient, fair, and fully funded systems.Footnote 1
Pension systems' insolvency coincided with an important trend towards privatization, market liberalization, and the development of domestic capital markets in the region. Empirical evidence leaves no doubt of the macroeconomic success of these reforms. Pension reform contributed to a decline in fiscal deficits, the increase of domestic savings, and the development of financial markets.Footnote 2 Nonetheless, defined contribution schemes have brought forth concerns on the microeconomic front, specifically on the fees charged by pension fund managers, their marketing expenses, and overall on competition issues.Footnote 3
Defined contribution systems are based on the interaction between the demand for the management of pension resources and its supply. The worker (the consumer in this market) is asked to choose a pension fund administrator that manages his funds. Consumers are thus required to be active, well informed, and to constantly assess the management of such funds; that is, it is assumed that the demand in this market shows a high degree of price elasticity.Footnote 4
Previous research has revealed that individual accounts schemes are characterized by a low elasticity of demand, which implies that workers barely react to relevant price parameters. It has been observed that the selection of pension fund manager is primarily associated with the size of their sales force; that is, instead of relying on price changes to attract consumers, pension fund administrators resort to compete in the number of sales agents to enroll a higher number of clients.Footnote 5 This study provides evidence that the lack of involvement of the consumer and the active partaking of salesmen in the switching process among pension funds in Mexico has not promoted market discipline that would result in benefits for the consumer in terms of higher returns, lower fees, and better service.
In markets of complex goods or services, such as pension fund management, the consumer shows an imperfect grasp of the product, and is, therefore, not able to distinguish its features and attributes to make the right choice. Hence, ‘noisy’ evaluations of the product by the consumer allow firms, even in industries with a large number of players, to reach equilibrium prices with mark-ups. This undermines the power of competition to impose market discipline. This study demonstrates that the existence of ‘noise’ in the Mexican Pension Fund Manager industry does not allow workers to adequately evaluate the features and attributes of the product or service they obtain when choosing a pension fund administrator. Thus, once consumers are not able to accurately interpret market signals, they tend to show some degree of ‘confusion’. This allows pension administrators to establish prices above those that would be observed in a market without ‘noise’.
The article is organized as follows: the next section presents an application of the theoretical framework developed by Gabaix and Laibson (Reference Gabaix and Laibson2004), which shows that in markets with ‘noise’, in which consumers are ‘confused’, a larger number of firms might not reduce mark-ups significantly. Using the statistical distribution of the industry's ‘noise’, the model allows for the estimation of the mark-up. The theoretical framework lets us put forward the hypothesis that the pension fund manager industry in Mexico is characterized by consumers that are subject to some degree of ‘confusion’. Hence, using information of the observed pension account transfers between AFOREsFootnote 6 during 2006, we estimate the ‘noise’ to which consumers are exposed, and then proceed to determine its statistical distribution, the industry mark-up, and the way in which the mark-up is affected by the number of firms in the industry. In addition, the relative importance of consumer ‘confusion’ in the AFORE choice is quantified and the industry's ‘noise’ is estimated. Section 3 explores the choice of pension fund manager in Mexico. Demand sensitivity is analyzed as well as the role played by sales agents and other variables in the switching process among administrators. The last section offers a set of concluding remarks. The relevance for consumers of actively participating in the system and of having the proper information in order to choose the best product is underscored. A system in which the information required to choose a pension fund manager is simple, straightforward, and thus less confusing, should result in a more competitive and efficient market.
2 Consumer's ‘confusion’ and ‘noise’
2.1 Theoretical framework
This section presents a theoretical framework which shows that the existence of ‘noise’ in the AFORE industry does not allow workers to correctly assess the characteristics of a specific good or service. Hence, given that consumers are not able to interpret the market's signals correctly, they show some ‘confusion’ in their choice of AFORE. Contrary to what happens in markets where ‘noise’ is not present and competition ‘protects’ the consumer, the existence of ‘confusion’, even in highly competitive markets, allows suppliers to charge prices above their marginal cost. The analysis is based on Gabaix and Laibson (Reference Gabaix and Laibson2004), which shows that in markets where consumers make product assessments affected by ‘noise’, the disciplinary effect of competition is diminished; that is, since suppliers benefit from the complexity and the ‘noise’ associated with the product they sell, a higher number of suppliers has a weak effect on the industry's mark-up.Footnote 7 Within this framework, we use an application from Gabaix and Laibson (Reference Gabaix and Laibson2004) and analyze the choice of AFORE when consumers are ‘confused’.Footnote 8
The modelFootnote 9
Consumers
Consumers in this model are those workers that must choose an AFORE from a total of N possibilities. For consumer a, the service provided by AFORE i has complexity σi, value v i, and price p i. However, workers cannot observe directly σi, v i, or p i. Consumer a is only able to observe a utility signal U ia from the services offered by each AFORE without being able to determine its individual components.
Thus, the utility function is described as
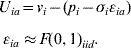
The term, σiεia is constituted by two variables: σI, which characterizes the complexity of each AFORE's service; and, εia, which models the ‘noise’ faced by consumer a when choosing AFORE i.Footnote 10 Since the worker can only observe a utility signal U ia for the service offered by an AFORE and is not able to unravel the constituent parts of the utility function, we assume that the worker chooses the AFORE with the highest signal value.
Firms
Each AFORE selects a price structure, p i, and the level of complexity, σI, for the service provided. Similarly, we assume that the complexity of the service directly influences its intrinsic valuation. Hence, valuation will be a function of the referred complexity, v i=v(σi). Moreover, the chosen σi, directly influences the ‘noise’ perceived by workers. Within the context of the AFORE market, we analyze the optimal choice of prices and service complexity through profit, πi, maximization. From (2), AFOREs choose p i and σi

where c is the marginal production cost and D(p i, σi) the demand function for an AFORE. Given that workers choose the service of AFORE i if that firm offers the highest value signal U ia, then D(p i, σi) is equal to the probability that a consumer selects the service that offers the highest utility signal. Thus, workers will only demand AFORE i services if U ia is strictly greater than the utility provided by any other AFORE.
In order to solve (2), we define a new variable, x i, which captures the valuation surplus a worker earns from choosing AFORE i as opposed to n – 1 competitors.Footnote 11 Using this change of variable, we express prices as

Substituting prices in (2), we obtain the new maximization problem

Once the maximization problem has been formulated, AFOREs will obtain the mark-up, p – c, and the complexity of the service they provide, σi. To obtain these results, it is necessary to find the first-order conditions with respect to x i and σiFootnote 12


Once the first-order conditions are obtained, we solve the equilibrium assuming that each AFORE charges the same price and expresses the demand as a function of the maximum ‘noise’ value generated by any other AFORE different to AFORE i.Footnote 13 Mark-up and service complexity are derived and the following expressions are obtainedFootnote 14
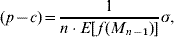

From (7) we observe that the mark-up is inversely proportional to the number of AFOREs in the industry and to the expected value of any density function evaluated at M n−1. However, the mark-up is directly proportional to the complexity imposed by the AFOREs in the market, σ. From (8), as market ‘noise’ increases, workers' benefits decrease. These results, shown in Gabaix and Laibson (Reference Gabaix and Laibson2004), generalize those obtained by Perloff and Salop (Reference Perloff and Salop1985) who derived the mark-up, p – c, but not the value of complexity, σ*.
Equations (7) and (8) show that to evaluate the mark-up and the complexity of the product it is possible to use different ‘noise’ distributions. Hence, mark-up results may vary according to the selected distribution.Footnote 15 In the following section, we identify the ‘noise’ distribution.
2.2 ‘Confusion’ and ‘noise’ in worker's ‘sub-optimal’ choice of pension fund manager, and statistical analysis of possible ‘noise’ distributions
The objective of this section is to characterize the AFORE industry's ‘noise’ distribution function, which will help us to estimate the magnitude of mark-ups. Equilibrium mark-ups are proportional to ‘noise’, thus higher ‘noise’ levels lead to higher ‘confusion’ and hence favor the presence of mark-ups. Once the ‘noise’ distribution is determined, it is possible to analyze the way in which the number of AFOREs in the market affects the industry mark-up.
‘Confusion’ and ‘noise’ in worker's ‘sub-optimal’ choice of pension fund manager
In order to derive the ‘noise’ distribution in the Pension Fund Manager industry, we proceed to define the ‘noise’ to which consumers are exposed in the market as the difference in the pension account balance that each worker would have obtained in a specific period of time had he chosen the ‘optimal’ AFORE according to his own idiosyncratic features, and that of the account balance that he would obtain as a result of having chosen the AFORE to which he transferred his resources in 2006. Hence, we define the ‘Optimal’ AFORE as the pension fund manager that complies with the following characteristics

where FEE AFit is the fee charged by AFORE i, and r AFit is the return paid by pension fund manager i. Therefore, according to our definition, the ‘Optimal AFORE’ is the one that shows the lower fee and the highest return in a given period for a specific worker.Footnote 16
This definition allows us to compute an estimate of the maximum percentage loss in a worker's pension balance when choosing an AFORE ‘sub-optimally’;Footnote 17 that is, we proceed to compare the pension balance a worker would receive at retirement if he decided to stay in the AFORE he chose when switching in 2006 with the amount he would receive had he transferred to the ‘optimal’ AFORE according to his individual characteristics. These characteristics include age, years in the system, balance in the worker's accounts, frequency of contributions, and wage. In addition, the observed returns and the prevailing fee structures of both the ‘optimal’ and the receiving AFOREs were considered.Footnote 18
For the comparison, we estimate the loss for each worker (WL), defined as the difference between his optimal balance (B*) and the observed balance (B°). This difference quantifies the effect of a ‘sub-optimal’ decision in monetary terms at a given moment of time, for each worker.Footnote 19 Accordingly

Hence, the exercise compares, for each of the 3.8 million account switches that took place in 2006, the balance of each worker's account at retirement in the AFORE he switched to, against the balance he would receive had he chosen the ‘optimal’ fund manager.
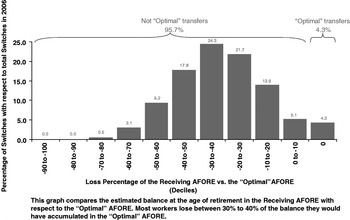
Figure 1 shows that 95.7% of the account shifts that took place during 2006 were not ‘optimal’, since the fund manager selected by the workers will bring about a lower pension than the one they would get had they chosen the ‘optimal’ AFORE.
Loss from not switching to the ‘optimal’ AFORE workers' estimated balance at the age of retirement receiving AFORE vs. ‘optimal’ AFORE (percentage)

The analysis shows for example, that 24.3% of the workers will record a 30–40% loss in their balance at retirement, compared to the balance they would receive had they selected the ‘optimal’ fund manager. Likewise, the balance in the individual accounts at retirement will be 40–50% lower for 17.8% of the workers, when compared to the balance they would obtain had they opted for the ‘optimal’ choice when selecting AFORE in 2006.Footnote 20 Even if this exercise rests on the extreme assumption that the AFOREs fee structure and observed returns remain constant for the whole period considered, the analysis shows that pension account transfers have not been the result of informed decisions, and that transfers respond to factors other than those that maximize the pension balance.
Statistical analysis of the ‘noise’ distribution
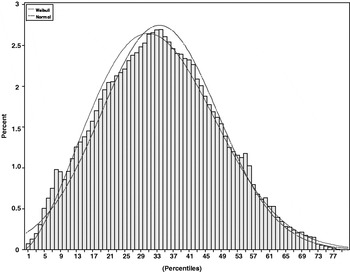
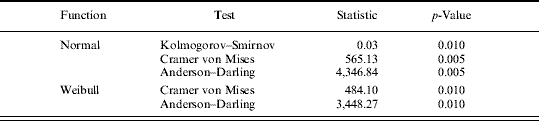
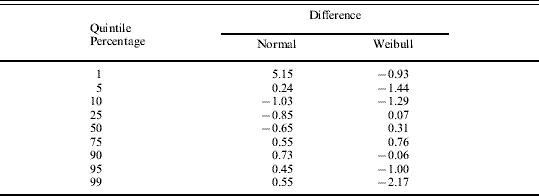
Figure 2 shows the ‘noise distribution’ derived from the pension balance loss that workers would have recorded as a result of not choosing their AFORE ‘optimally’. With the purpose of fitting the ‘noise’ relative frequency histogram and to determine its distribution, several goodness-of-fit tests were performed for the gamma, log-normal, normal and Weibull functions.Footnote 21
‘Noise distribution’ percentage loss in pension balances at retirement age due to ‘sub-optimal’ choice of AFORE fitted by the normal and Weibull distributions

The results show that the null hypothesis is rejected for the four functions.Footnote 22 However, the empirical fit of both the normal and Weibull distributions to the ‘noise’ distribution is almost perfect. Moreover, considering the fit by quintiles, we see that the differences between the observed and estimated functions are minimal for both the normal and Weibull distributions.Footnote 23
2.3 Mark-up estimation in the AFORE industry
Taking into consideration the previous statistical analysis, this section studies the cases in which the industry's ‘noise’ is normal and Weibull distributed. An exercise that shows the way in which the industry mark-up varies as the number of competitors increases is presented. The analysis allows comparing, according to the selected ‘noise’ distribution, the speed at which price converges to marginal cost when the number of suppliers in the industry increases.Footnote 24 Both distributions have medium fatness tails but, when compared, the Weibull distribution shows thinner tails than the normal distribution. This implies that the mark-up estimated using the normal distribution will converge to zero at a lower rate than when the Weibull distribution is used. However, both distributions imply that competition has only a slight effect on the industry's mark-up.
To estimate variations in mark-ups, we use the following functions

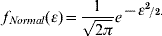
In order to obtain the mark-ups, a density function denoted by f(A n) is required, as shown in equations (A23) and (A24) in AppendixI. Since any function can be used, we propose h(t) such that

We define A n asFootnote 25
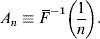
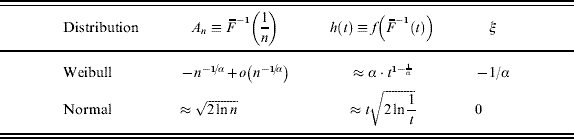
The estimates for each of these equations and an index ξ, that measures the tails' fatness of the distribution are computed by Gabaix and Laibson (Reference Gabaix and Laibson2004) and shown in the Table 1.
Weibull and normal distributions and associated estimations
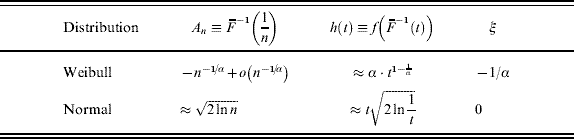
Once the expressions for each distribution are estimated, the mark-up's closed form equation for the AFORE industry is obtained. Based on Gabaix and Laibson (Reference Gabaix and Laibson2004), the results are as follows.
For α⩾1, the Weibull is expressed as

and the normal as
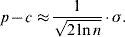
The distributions imply that if there is ‘noise’ in the market, there will be an industry's mark-up. Nevertheless, the ‘noise’ distribution actually considered will determine the speed at which the price converges to the marginal cost as the number of firms in the industry increases. Thus, if the ‘noise’ is distributed as a normal, the mark-up, p – c, is proportional to  .Footnote 26 This implies that more AFOREs will force the mark-up down, albeit at a very slow rate.
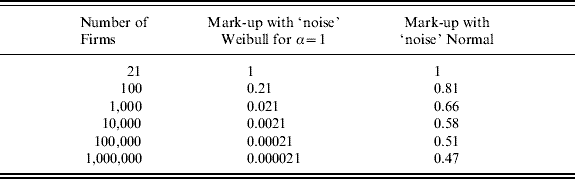
To prove the above we performed an exercise with 21 AFOREs (the existing number of AFOREs in December 2006) and normalized the mark-up in n=21 to 1. This allowed us to estimate the mark-up as the number of competitors increases in multiples of ten. The exercise described in Table 2 shows that even in a highly competitive industry, for instance, an industry with 1,000,000 AFOREs, there would still be a 47% mark-up, as opposed to the prevailing mark-up when there are 21 AFOREs in the market. However, if the ‘noise’ is distributed as a Weibull, then the industry's mark-up will decrease faster as the number of firms increases.Footnote 27
Mark-up according to the number of AFOREsFootnote *
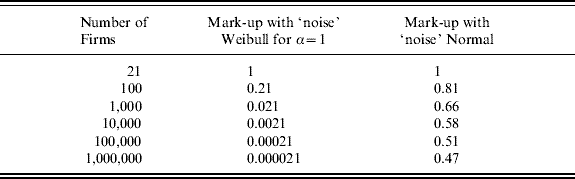
Note: * This exercise, far from showing the true mark-up in Mexico's AFORE industry, gives only an idea of the way mark-ups would decrease as the number of participants increase. It is important to highlight that given the ‘noise’ distribution; new participants in the industry might only have a marginal impact on the mark-up.
However, as pointed out in the previous section, the normal distribution shows a better fit by quintiles to the observed ‘noise’ distribution than the Weibull distribution. This means that, even if the number of AFOREs increases, the convergence of price to marginal cost will be very slow.Footnote 28 Thus, a policy aimed at increasing the number of AFOREs will not necessarily bring prices down. Policy efforts should thus mainly focus on reducing the prevailing ‘noise’ in the industry.
2.4 Measurement of ‘noise’ and consumer ‘confusion’
‘Random educational treatments’, such as the ones implemented by Duflo and Sáez (Reference Duflo and Sáez2003) and Choi et al. (Reference Choi, Gabaix, Laibson and Madrian2004) can be used to estimate the consumer's ‘confusion’ and the industry's ‘noise’. The methodology of these studies entails dividing a random sample of people into two groups (treatment and control): people in the treatment group receive information that allows them to take an ‘informed decision’ regarding an action they must take. On the other hand, the control group takes the action without receiving the referred information. We will assume that people in the treatment group become financially sophisticated as a result of the educational input they receive prior to being asked to make a decision. Hence, their choice will be an informed decision. On the other hand, individuals in the control group, who lack information, will be considered naive and would therefore be exposed to ‘noise’ in their assessments as well as in their final decision. Thus, both sophisticated and naives have the same underlying objective function, but face different sets of information at the time they are asked to decide.
According to Gabaix and Laibson (Reference Gabaix and Laibson2004), it is possible to determine the existence of ‘confusion’ in an industry by comparing the market shares of sophisticates and naives. Hence, both groups' market shares can be used as demand vector indicators, where:
(D iS)i=1….n is the Sophisticates demand and represents the share of assets in fund i.
(D iN)i=1….n is the Naives demand and represents the share of assets in fund i.
The existence of ‘confusion’ by the naives can be determined by comparing the demand vectors and measuring their correlation.Footnote 29 In the case of perfect correlation between the sophisticates' and the naives' demand vectors, both types of consumers would follow the same consumption pattern, thus the existence of ‘confusion’ by the naives could be ruled out. On the contrary, if there is no correlation whatsoever among the vectors, one would infer total ‘confusion’ by the naives, since these consumers are exposed to ‘noise’, which hinders their ability to choose the way sophisticates do. Consequently, the level of correlation among both vectors allows us to determine the level of ‘confusion’ in the industry.
2.5 Econometric framework to measure ‘confusion's’ relative importance
The estimation is based on the utility function defined in Section 2.1 in equation (1). In the model, consumers are those workers who choose a Pension Fund Manager from a total of N possibilities. Each manager provides a service with complexity σi, value v i, and price p i. In the utility function, the term σiεia characterizes the complexity of each AFORE's service, σi characterizes the complexity, and εia models the ‘noise’ faced by a consumer when choosing an AFORE.
For the exercise, σiεia captures whether the group is naive or sophisticated. In our case, σT2 models sophisticated idiosyncratic preferences, while σN2εNa models both idiosyncratic preferences and ‘noise’ presence. Thus, considering that the utility functions are separable and additive, according to McFadden (Reference McFadden, Manski. and McFadden1981), once a set of probabilistic choice is defined as a demand system, it can be portrayed in a conventional econometric model if the demand structure and the error distribution have been specified. In our case, given that the workers have several pension fund managers to choose from and we have found the error distribution, we can propose an econometric framework.Footnote 30
For the sophisticated group, the utility function depends only on the idiosyncratic preferences, while for the naive group, since it is not able to observe the true utility, but rather utility signals that are affected by the presence of ‘noise’, its utility function depends on the idiosyncratic preferences of the consumer and on the ‘noise’ that obstructs the proper assessment of the good. In case there is no ‘noise’, then there will be no ‘confusion’ and the utility function of the naive will be equal to that of the sophisticated.
For a sophisticated or naive consumer, the choice of a good or a service, in this case an AFORE, will take place when the probability of the utility that is derived from the consumption of a good, for example i, is higher than the maximum utility that other goods, for example j, could generateFootnote 31

where τ applies to both type of consumers, sophisticates and naives.Footnote 32 Hence, with the aim to measure the extent of ‘confusion’ in the market, the following regression, that considers the sophisticated consumers market share in the determination of the naive consumers market share, can be estimatedFootnote 33

where α is the constant and r i the error term.
Assuming that all goods have small market shares in the limit and that variance is bounded by a constant value, the resulting β coefficient will simply express the relationship of the dispersion of naive, σN, and sophisticated workers, σT. Thus, the resulting coefficient is
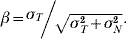
Since we assume that naive workers turn into sophisticates as they acquire more information and they gradually understand the way the market reacts, we expect dispersion to decline, hence, β coefficient is smaller than 1. We can proxy the general level of ‘noise’ in the market by
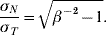
The ‘noise’ is a ratio that characterizes the way each type of worker, naive or sophisticated, chooses an AFORE, respectively. As the dispersion is reduced, β2 increases and the ratio between σN and σT tends to zero. When ‘noise’ is not present, both types of workers choose in the same way and market shares of AFOREs tend to change.
2.6 Empirical approach
The identification of Sophisticated and Naive consumers for a specific good or service is not an easy task. As mentioned previously, some authors have resorted to field experiments and the use of random educational treatments.Footnote 34 In order to verify the existence of consumer ‘confusion’ when workers select a pension fund manager, an analysis using observed information on the choice of AFORE in 2006 is presented in the next section.
Presence of ‘confusion’: correlation between sophisticates and naives in account switches during 2006
Using information on the totality of account transfers during 2006, the market share for each AFORE was obtained. We assume that this vector represents the demand of naive workers. This assumption is based on the fact that the choice of the ‘optimal’ AFORE for each individual is not easy and that the number of account transfers in the year was such that rarely could those switches result from an informed decision. However, we use information showed previously in Section 2.2, where the ‘optimal’ choice of AFORE for each worker, according to his specific circumstances, was considered. With this information, a new market share vector is obtained. Given that for this exercise workers have clear and precise information regarding their own situation, we assume their decision represents the ‘optimal’ choice.Footnote 35 Thus, the resulting vector corresponds to the demand of the sophisticated consumers. Consequently, we have two demands, one for sophisticated consumers and another for naives. Given that consumers differ only in their financial sophistication and thus in their ability to maximize preferences, the condition that the objective function of all workers has the same distribution is satisfied.
In order to determine the existence of worker's ‘confusion’ in the choice of AFORE, the correlation among both vectors is estimated. Sophisticated consumers make ‘optimal’ choices, while ‘confused’ workers are expected to choose in an environment affected by ‘noise’. Therefore, in the case of perfect correlation between sophisticated and naive demand vectors (ρ=1), we would conclude that no ‘confusion’ is present and that the AFORE selection is ‘optimal’. Conversely, if the correlation among the two vectors is zero (ρ=0), there is perfect ‘confusion’ and the ‘noise’ tends to infinitum. The observed correlation between the naive and sophisticated consumers is 0.60, which can be interpreted as evidence of 40% ‘confusion’ in the market.
Quantification of ‘noise’
According to Section 2.5, in order to quantify the ‘noise’ through an econometric framework, we estimated regression (18). Considering the market conditions in the AFORE industry and the estimated correlation coefficient, we expect a β coefficient lower than 1, which implies the existence of general ‘noise’. As β gets closer to 1, ‘confusion’ tends to disappear, and the choices of ‘confused’ workers become similar to the ‘optimal’ choices of the sophisticates. The results are

The value of β is used to obtain the level of general ‘noise’ in the market. Using (20), the general ‘noise’ is equal to  .
Since sophisticated consumers are able to choose an AFORE without the influence of ‘noise’, while naive consumers are not, the ratio σN/σT measures the error of naive consumers in the choice of AFORE. This allows us to obtain an estimate of ‘noise’ and confirms the hypothesis that naive consumers are ‘confused’ by the presence of ‘noise’, which hinders their ability to properly assess and ‘optimally’ choose a pension fund manager. In order to have additional information that could confirm the presence of ‘confusion’, we proceeded to carry out surveys as suggested by Duflo and Sáez (Reference Duflo and Sáez2003) and Choi et al. (Reference Choi, Gabaix, Laibson and Madrian2004).
Presence of ‘confusion’: the survey
Surveyed individuals were provided with an information set and asked to choose an AFORE out of a total of 21 pension managers. Two information sets were designed. One half of the sampled population had access to information set #1 and the other half of the population received information set #2. Both information sets presented vast information on each AFORE, such as fees, returns, administered assets, number of accounts managed, number of account switches, services provided, other financial indicators, as well as the main headlines used in the AFOREs' advertisement; that is, both information sets attempted to represent the whole universe of available information to which consumers are exposed when selecting their pension fund manager. Information set #2 differed from information set #1 in only one aspect. The information in set #2 was preceded by a brochure that underscored the relevance of fees and returns in the AFORE selection process; that is, information set #2 aimed to instruct and guide consumers to focus on the most relevant information to make a better choice. Hence, the purpose of this exercise is to assess whether assisting consumers to unravel the available information on what is more important for their AFORE choice helps them to select more wisely. Consumers that had access to the referred brochure were thus classified as financially sophisticated, and hence it would be expected that they are more able to make the proper choices. The survey also included a questionnaire that aimed for the identification of personal characteristics of the surveyed population. Information on the specific attributes of the surveyed individuals was also used to differentiate sophisticates from naives.Footnote 36
We recognize that methodologically, the approach used could exert biases in workers' choices, though this was not completely the case, as the empirical results have shown.Footnote 37 Whilst the results are satisfactory from a policy oriented perspective, an alternative in conducting the survey could be the implementation of a different sample's design.Footnote 38
Results
For our exercise, two vectors with the AFOREs market shares resulting from the two information sets were generated. Hence, the two vectors can be interpreted as the AFORE demand of the control and treatment group consumers.
The resulting market share vectors, both for naive and sophisticated workers, have a 0.99 correlation, which would seem to suggest that there is no ‘confusion’ in the AFORE choice. The relatively high correlation among the two vectors can be understood as evidence that indicates that once individuals take a few moments to analyze the information presented, they are able to choose ‘optimally’ even when no additional explanations are presented.Footnote 39 It might also be the case that the information sets are not identifying correctly the treatment and control groups; that is, workers might not be as different in the two groups as they may appear and their distributions could be closely related. Furthermore, this could also be an outcome of the small differences in the information sets.
A new sample could be done according to different economic sectors, in which the level of education and the type of job in each sector could help control both for naive and sophisticated consumers. Such an exercise would let us assess the choice of both groups without an ex-ante classification. In order to carry out the experiment, we would need an instrument to help us identify our parameter of interest. Such an instrument could be a random policy that can contribute to identifying exogenously both groups. As of March 2008, changes in legislation – which could be considered as such instrument – were enacted. However, given the brief period of time the legislation has been in place, it is difficult to expect that results would change considerably.
In any case, the analysis suggests that the proper choice of a pension fund manager only requires consumers to pay some attention to the relevant variables, and that choosing adequately is not a difficult task whenever they can access simple and straightforward information.
3 The choice of pension fund manager in Mexico: a theoretical approach
3.1 The choice of AFORE in Mexico: demand inelasticity and switching among fund managers
Several studies analyze demand inelasticity in individual capitalization pension systems. Since Chile was the first country to implement this system in 1981, it is not surprising that most of these studies analyze this case.Footnote 40 In general, these studies point out that the demand for Private Pension Fund Managers (AFP) is barely responsive to changes in variables such as price or return, or to the quality of services provided. Berstein and Cabrita (Reference Berstein and Cabrita2006) use individual data to analyze AFP's demand to estimate the probability that a worker elects another pension fund manager. Results confirm the significance of AFP sales agents and indicate that, despite the fact that price and return demand elasticity is relatively low, it increases considerably when associated with sales agent involvement.Footnote 41
There are few studies concerning AFORE demand inelasticity in Mexico. Meléndez (Reference Meléndez2004) estimates AFORE demand functions and finds that neither fees nor returns explain affiliation and that the latter depends mainly on variables related to commercial activity and promotion. Armenta (Reference Armenta2007) analyzes the determinants of losing workers to another AFORE and finds that between 2000 and 2006 AFORE demand is somewhat sensitive to changes in the flow fee, and is less affected by changes in the asset fee.Footnote 42 Moreover, the findings reveal that the probability of switching among AFOREs responds to sales agents' partaking.
In a competitive environment with perfect information, the transfer of workers' accounts among AFORES should exert discipline on the market; that is, given price, return, and service differences among AFOREs, one would expect that consumers exercise their right to move their resources to pension funds that offer a better combination of these three variables. Nonetheless, the demand inelasticity that characterizes these systems, and the consumers' inability to differentiate between products, have caused the direction and volume of switches among pension fund managers to respond mainly to their marketing strategy and sales force.Footnote 43 Thus, fund managers have increased their market share through a greater number of sales agents and significant marketing and promotion expenses. In order to determine the model that best explains and fits the dynamics of transfers in Mexico, several models were considered.Footnote 44
Using Ordinary Least Squares (OLS) a panel with monthly aggregated data from January 1999 to December 2006 was generated. We analyze the relationship between the number of account switches by AFORE and variables used previously by other authors.Footnote 45 Several econometric models were designed including variables such as: asset and flow fees, returns, equivalent fee ranking, marketing expenditure, the number of sales agents, regulatory changes, market share, and the fact that some AFOREs might belong to a financial or insurance group. For almost every variable in the model, descriptive patterns changed from September 2002 to December 2006, after main amendments to regulation were implemented to favor mobility among fund managers. A Chow Test verified the presence of structural change, prompting division of the sample into two periods: from January 1999 to September 2002; and from October 2002 to December 2006.Footnote 46
For the first period, flow and asset fees are considered, while for the second period a ranking index is introduced.Footnote 47 Furthermore, since belonging to a financial or insurance group could bring technical expertise to the design of retirement plans or portfolios or generate economies of scale and, thus provide additional means to attract consumers, dummy variables to capture this effect are introduced. Being part of a financial group could help AFOREs assign resources efficiently and determine the size of the sales force and marketing budget. Thus, our analysis allows us to evaluate and compare the effectiveness of marketing expenditure in both periods of study, which becomes significant only from 1999 to 2002. Dummy variables that capture AFORE's size and the main regulatory changes that led to additional flexibility in the switching process, are also included.Footnote 48
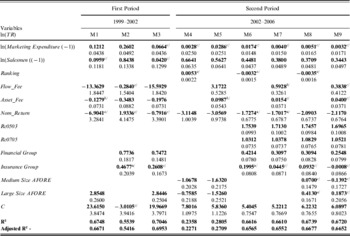
A group of regressions is presented in the Regression Analysis (Table 3), from simpler to more complex models, in order to verify the robustness of each variable and to avoid the omission of relevant variables. Several models are estimated for each period. For January 1999 to September 2002, regressions identify the relationship between the number of transfers received by the AFOREs and important features of the industry; that is, during the first years of the new pension system, marketing expenditure was an important determinant of the industry's behavior. At this point, attributes such as size and participation within a financial group or insurance company were also relevant to shape the market. During this period, marketing expenditure is significant at 1% in models M1 and M2, while for M3, it is not. For models M1 and M2 an increase of 10% in marketing expenditures will increase transfers by around 1.2% and 2.6%, respectively, this variable being crucial in explaining transfers between AFOREs. As for sales agents, its significance level varies depending on whether the model controls for the size of the AFORE and the inclusion of other explanatory variables. At this point, sales agents are not a key variable in explaining transfers, being significant only in M2. According to this model, a 10% increase in sales agents will increase transfers in 8%.
Regression analysis

Where:
ln(Marketing Expenditure(−1))=Total weighted expenditure in marketing.
ln(Salesmen (−1))=Natural logarithm of the number of sales agents in the receiving AFORE lagged one period.
Ranking=Ranking of the Equivalent Commission over balance during 1 year.
Nom_Return=Nominal return.
Rc0503=May 2003 Regulatory Change.
Rc 0604=June 2004 Regulatory Change.
Rc 0705=July 2005 Regulatory Change.
C=Constant.
a/ Significant at 5%.
b/ Significant at 10%.
c/ It is not significant.
Standard errors are below the coefficients.
Source: CONSAR.
For the first period analyzed, account transfers respond somewhat to changes in prices, particularly to the asset fee, while the flow fee is important in M1 and M3, but not in M2. On the other hand, nominal returns are not significant in M2 and M3, and when they are significant in M1, its sign is not the expected one. This may be due either to the lack of information of workers during the selection of AFORE or to some misunderstanding of the information provided. The size of the AFORE is significant when considered. In these cases, it captures some of the effect of sales agents.
Finally, results confirm that an AFORE that is part of a financial group might have an extra advantage in gaining workers. Additionally, in the first period of analysis, AFOREs belonging to financial groups had an advantage in attracting workers, while this benefit is not present in the case for those related to insurance companies.
In sum, marketing expenditure, the number of sales agents, or size of the AFORE and being part of a financial group, play an important role in explaining switches during the first period. The effect of prices in explaining switches is not clear cut. Asset fees are statistically significant most of the time and flow fees are significant to a lesser extent. Offered returns by pension fund managers are not relevant in the analysis.
For the second period analyzed, October 2002 to December 2006, the models are expanded to control for changes in regulation that provided more flexibility to the switching process. It is thus possible to confirm the importance of changes in regulation, as well as the effect of sales agents on the escalation of switches after October 2002.
On January 2005, regulation allowed workers to transfer their accounts among pension funds before completing a year in an AFORE, as long as the account was transferred to a pension fund that had a lower one-year equivalent fee.Footnote 49 As a result, a worker could transfer his account several times in a year, provided that he moved his funds to an AFORE with a lower equivalent fee. Hence, it is expected that the AFORE's ranking in the comparative equivalent fee table became an important element determining the direction of switches. Thus, a variable that captures the AFORE ranking in the equivalent fee table was also included. An important difference in the results of the two time periods considered is the relevance of marketing expenditure. During the first period, in which the industry was shaping itself, this variable was fundamental in determining switches, whilst, in the second period, it is not significant at all. In contrast, the number of sales agents appears to be highly significant in every model, despite the variables considered.
Aside from M4, all models included for the second period in Table 3 show consistent signs for prices: the position of the AFORE according to the equivalent fee table is statistically significant at 5%. This means that controlling for changes in regulation and AFOREs' financial characteristics helps prices capture the effect on workers' transfer; that is, a decrease in fees and, hence an improvement in the equivalent fee ranking table, implies a decrease in yielded transfers, as shown in models M6 and M8.
When prices are disaggregated and evaluated separately, as in models M5, M7, and M9, results are less significant than those of models M1, M2, and M3. In contrast to the first period, the asset and flow fees lose their relevance in explaining switches among pension fund managers, and their coefficients are lower than the ones obtained for the number of sales agents, which in this period – once regulation was amended to stimulate transfers – becomes the key determinant of transfers. The results confirm the importance of sales agents in the switching process and the fact that an adverse position in the fee table limits the ability of AFOREs to attract affiliates.
As in the first period, nominal returns seem to have no effect on switches. Returns are significant but the sign is not the expected. In both periods, it is hard to find a clear long-term expected return difference: only M1, M6, and M7 appear to show clear relations between rates of return and transfers. In sum, while fees have immediate impact and are observable, returns are subject to some uncertainty.
During the second period, regulatory changes were a catalyst for switches, specifically, those that took place between May 2003 and July 2005. Furthermore, belonging to a financial group continues to be important in determining switches, while being part of an insurance group loses all its relevance. The size of the AFORE remains significant, implying that a larger share of the market, and hence its presence as a financial service provider contributes to attract more accounts. Finally, models M8 and M9, which include most of the variables, explain switches of 66.7 and 66.5%, respectively. In general, switches among pension fund managers are explained mainly by sales agents' activity, AFORE size, and whether they belong or not to a financial group.
4 Concluding remarks
Defined contribution pension systems in Latin America were conceived from a macroeconomic perspective aimed at facing the challenges associated with the pay-as-you-go systems. The empirical evidence of the reformed pension schemes is unambiguous in terms of their macroeconomic success. Nevertheless, defined contribution systems have raised concerns on the microeconomic front, particularly on competition issues. Individual account pension schemes have the implicit assumption of active and informed consumers. Well-informed consumers tend to respond swiftly to price variations or to changes in the quality of service. Hence, under the assumption of informed workers, pension fund managers that do not provide a proper service or charge a fee that exceeds that of the rest, will simply witness their customers opting out to another competitor. However, empirical evidence seems to suggest that individual accounts systems are characterized by marked demand inelasticity. This implies that the worker's choice of pension fund administrator does not respond to relevant price parameters. Evidence for Mexico indicates that account transfers among pension administrators barely respond to price or return considerations, and that pension fund switching has not served as a market disciplining tool that would result in lower fees and higher returns for the consumer.
The article shows that in markets with ‘noise’, such as the pension fund manager industry in Mexico, an ample number of competitors may not significantly reduce mark-ups. Utilizing the statistical distribution of the industry's ‘noise’, the theoretical framework allows for the estimation of the mark-up. The model also indicates that as the number of pension fund managers increases, the mark-up diminishes at a very slow rate. This implies that more participants in the industry will hardly affect prices.
The above allows us to conclude that the regulator's effort should mainly be addressed to the reduction of the industry's ‘noise’; that is, policies that aim towards a transparent system, in which the information is simple and readily available for the consumer to facilitate his decision-making process, represent significant steps in the elimination of ‘noise’ and ‘confusion’. A market without ‘noise’, in which the worker becomes an active and well-informed consumer, will result in a more efficient and competitive system.
Appendix 1: The modelFootnote 50
Consumers
Consumers in this model are those workers that must choose an AFORE from a total of N possibilities. For consumer a, the service provided by AFORE i has complexity σi, value v i, and price p i. However, workers cannot observe directly σi, v i, or p i. Consumer a is only able to observe a utility signal U ia from the services offered by each AFORE without being able to determine its individual components. Thus, the utility function is described as
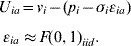
The term, σiεia is constituted by two variables. σi, characterizes the complexity of each AFORE's service and, εia, models the ‘noise’ faced by consumer a when choosing the service of AFORE i. Likewise, we assume εia with zero mean, unitary variance, f density function and an F cumulative distribution function that it is identically and independently distributed.
Firms
Firms in this model are those AFOREs that maximize profits by choosing optimally both prices and service complexity

where c is the marginal production cost and D(p i, σi) the demand function for an AFORE. Given that workers choose the service of AFORE i if that particular firm offers the highest value signal U ia, then D(p i, σi) is equal to the probability that a consumer selects the good that offers the highest utility signal.
Thus, workers will only demand AFORE i services if U ia is strictly greater than the utility provided by any other AFORE, for example, AFORE j
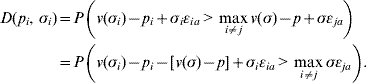
In order to solve (A2) and (A3), we define a new variable, x i, which captures the valuation surplus a worker earns from choosing AFORE i as opposed to n−1 competitors


Substituting prices into (A2) we obtain the new maximization problem

To simplify notation and further calculations, we suppress the consumer's specific subscript, a. Thus, U i=U ia and εi=εia. Hence, the new demand function, D(x i, σi), will be a function of x.
Once the maximization problem has been formulated, AFOREs will obtain the mark-up, p – c, and the complexity of the service they provide, σi. To obtain these results, we derive the first-order conditions with respect to x i and σiFootnote 51


In order to obtain the equilibrium, we assume that all AFOREs charge the same price in the industry. Thus, in a certain way, we are solving the model a la Bertrand.Footnote 52
From (A3) we solve for D(x i, σi)

Next, we define the maximum ‘noise’ value generated by any other AFORE than AFORE i as

Then, if we substitute (A10) in (A9), we obtain

We evaluate (A11) in  =1−F(.), where F(.) is the cumulative distribution function and express it as a statistical expectation

This formulation emphasizes the property that the demand for AFORE i services is driven by the right-hand tail properties of  .
To derive the properties of the Bertrand Symmetric Equilibrium, we evaluate the demand, D(x i, σi), and the partial derivatives at the points (x i, σi)=(0, σ), that is where workers should not obtain any surplus and the service complexity is constant for all AFOREs


Once the partial derivatives have been obtained and evaluated, we recall demand is the probability of achieving the maximum surplus

If we evaluate at the points (x i, σi)=(0, σ) we have that

From (A16) we observe that D(0, σ) is the probability of receiving the highest gain in value, U i, given that the worker chose AFORE i services with respect to those provided by the other n−1 competitors; that is, the probability of selecting the AFORE that offers the highest surplus is 1/n, which is the demand's value.
Given these results, we substitute (A13) and (A16) in the mark-up's first-order conditions (F.O.C.s) to obtain
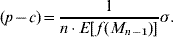
And, we also substitute (A13) and (A14) in the complexity's F.O.C.s

This suggests that we can evaluate this probability at the distribution function and define A n≡−1(1/n). Now, we can be sure that A n is close to M n−1.
We know that (M n−1) is 1/n, so we can rewrite this expression as (M n−1)=u/n for a random variable u close to 1. Thus, to analyze u’s behavior around a neighborhood close to 1 and characterize the value of M n−1 we use a first-order Taylor's expansion.
Therefore, expanding M n−1=−1(u/n) around 1, we obtain the following

Substituting A n≡−1(1/n) in (A19) we obtain
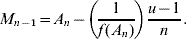
From (A20), we find that M n−1 has the same dispersion as (1/f(A n))⋅(u−1/n), which implies that any variation in M n−1 will be proportional to 1/[n⋅f(A n)]. Thus, considering that firms establish their mark-ups proportional to M n−1 dispersion, we can conclude that they are proportional to 1/[n⋅f(A n)].
If we use this factor, we can express the mark-up (A17) and the service complexity (A18) in a simpler way
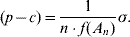

We can now solve the mark-up (A21) and the service complexity (A22) for the normal, gumbel, exponential and log-normal distributions.
For any other type of distribution, it is necessary to adjust each equation by the constant Γ(2+ξ)Footnote 53 and use the following equationsFootnote 54


A n, Γ(z), and ξ, allow us to estimate (A23) and (A24) and thus the mark-up that exists in the AFORE industry for any kind of ‘noise’ distribution.
Appendix 2: Survey methodology
The challenge of a survey is to strike a delicate balance between low cost, feasibility, and adequate representation of the population. The first step consists in selecting the population to be surveyed. In the case of Mexico, there are 38.9 million accounts registered in the National Retirement System.Footnote 55 However, many of these accounts are the result of the allotment process among pension fund managers that takes place when workers do not select an AFORE, and thus the assigned accounts do not actually represent a decision-making process by the consumer. Moreover, not all the existing accounts receive recurring contributions, i.e. not all the accounts can be classified as active.Footnote 56 According to the Retirement System Data Base, only 55% of the accounts in the system belong to workers that, at some point, picked a specific pension fund manager (affiliated workers to a specific AFORE), and, out of these, only 62.5% of the accounts are active. Ideally, this should be the population to be targeted and surveyed. This is because, well-informed consumers, that chose an AFORE and that recurrently contribute to their accounts, are supposedly more in touch with the system and hence pay more attention to their pension account. Nonetheless, the difficulty of carrying out a random survey in all the country, made us opt to conduct the survey in Mexico City. In any case, 14.4% of the accounts in the system have addresses in this city.
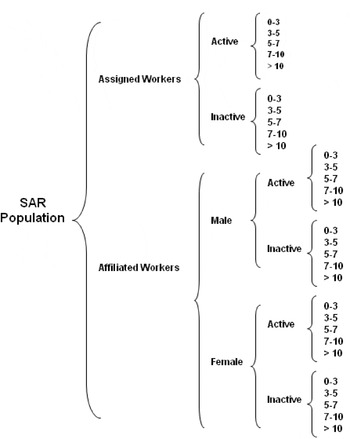
In order to determine the sample size for the survey, a detailed analysis of the main features of the workers in the Savings for Retirement System (SAR) database was carried out. First, the database was divided into affiliated and assigned workers. Second, the resulting groups were divided by gender. Third, both gender sub-samples were divided according to workers contributory features (active or inactive workers) and, finally, each of the resulting sub-samples was divided into five income groups.Footnote 57 The following diagram depicts the main characteristics of the distribution used to determine the sample size and to design the questionnaire that identifies specific attributes of the surveyed individuals.Footnote 58
SAR workers distribution

Several formulas were considered to determine the size of the sample. The formulas differ depending on the parameter to be estimated (population mean and standard deviation or population's specific features) and on the use of an anticipated rate of response of the survey. The formula selected is designed for dichotomic events, and considers criterion proportions that take into account the total number of workers in the population.
Additionally, if a random sample is to be drawn from the population, the sample proportion p would be the fraction of the elements in the sample that possess the attribute of interest. That is

where y i is any population characteristic (affiliation, gender, level of activity, age, or income group) and n is the sample size. In addition, p’s variance is defined as
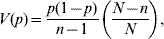
where N refers to the total population.
The probability that the selected random variable falls within a confidence interval of the distribution is equal to a risk value, α, hence we have

Now, after standardizing and doing several calculations, the solution for the size of the sample, n, isFootnote 59
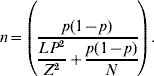
And, after adjusting for the anticipated survey's rate of response, RR, the formula becomes
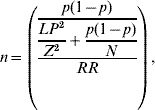
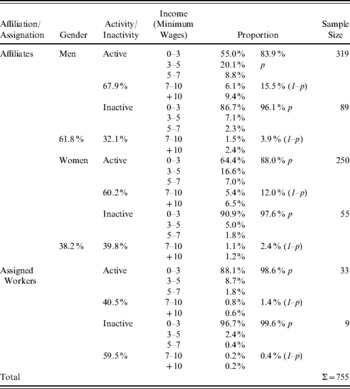
where Z is the value obtained according to a desired confidence level, LP is the desired level of precision, p is the estimated proportion of an attribute that is present in the population (the selected random variable), N is the population size, and RR is the estimated rate of response of the survey, i.e. this number compensates for the non-response of surveyed individuals. The sample size considers the attributes shown in Table A1, which stem from the 38.9 million accounts in the Savings for Retirement System database.
Savings for retirement system database characteristics and sample size derivation

In order to use the formula, only 2 proportions are required (the characteristic p, and 1−p), so for each group (affiliate or assigned/gender/activity or inactivity) workers with income from 0 to 7 minimum wages were aggregated to determine p, while those with more than 7 minimum wages were aggregated in a second group (1–p). With a 95% confidence level, and a 65% expected rate of response of the surveyed individuals, the number of surveys that would be required adding all the subgroups sample sizes, amounts to a total of 755.
The next step to conduct the survey was to randomly select the locations within Mexico City where the study would be applied. Using Mexico City's zip code information, 21 sets, consisting of ten neighborhoods each, were randomly picked by a computer. The survey was applied in one of these groups of neighborhoods (selected also randomly). This method allowed the inclusion of hundreds of persons from different zones of Mexico City, including high, middle, and low income participants. As previously mentioned, the survey included general information and advertisements used by the AFOREs, although half of them also incorporated the additional brochure which underlined the most relevant information to consider when choosing a pension fund manager.




 dt is the Gamma distribution and ξ is the index that describes the distribution tail fatness. See Gabaix and Laibson (