Implications
This study showed that when high-fat diet-fed mice were killed in a fed state, their expression of genes related to obesity and their plasma biochemical profiles differed significantly from mice killed in a fasted state. Also, differences in the timing of sample collection have greatly affected these results. Therefore, it is important to standardize the procedures of sample collection. This is to avoid ‘untrue’ discrepancies in the data obtained, thus resulted in wrong prediction or conclusion on certain biological and physiological status.
Introduction
Prolonged fasting causes a shift in the use of carbohydrate and fat as the whole-body fuel to mainly fat. The dramatic changes in metabolism occur primarily in the liver. Fasting promotes the release of fatty acids from adipose tissues. Fatty acids are taken up by the liver and are oxidized in the mitochondria (Kersten et al., Reference Kersten, Seydoux, Peters, Gonzalez, Desvergne and Wahli1999). Peroxisome proliferator-activated receptor (PPAR)-α, a ligand-activated transcription factor, is a key regulator of genes for mitochondrial and peroxisomal fatty acid oxidation as well as for ketogenesis (Cheon et al., Reference Cheon, Nara, Band, Beever, Wallig and Nakamura2005). Acyl-CoA oxidase (ACOX), a PPAR-α target gene, is required for fatty acid β-oxidation in liver peroxisomes (Tugwood et al., Reference Tugwood, Issemann, Anderson, Bundell, McPheat and Green1992). Suppressed PPAR-α expression poses a risk of developing obesity. Besides fasting, high-fat diet is another physiological factor that may affect the PPAR-α-dependent signaling pathway (Patsouris et al., Reference Patsouris, Reddy, Muller and Kersten2006). Other pre-analytical and biological variables that have been found to influence lipid measurements include the length of fasting period, the posture of an individual and blood sampling time (Sundvall et al., Reference Sundvall, Laatikainen, Hakala, Leiviska and Alfthan2008).
High-fat diet feeding in animal is a widely used method to identify PPAR-α agonist. But, physiological and biological variables that may affect the observations are seldom being considered. This may lead to inaccurate interpretation of the results and the adoption of inappropriate treatment. Therefore, the objective of this study was to investigate the effect of fasting and sampling time on the expression of PPAR-α, ACOX and selected lipogenic genes in high-fat diet-fed mice. Plasma levels of glucose, triglycerides (TGL), total cholesterol (T-CH), non-esterified fatty acids (NEFAs) and ketone bodies such as acetoacetate (AcAc) and hydroxybutyrate (OHBA) were also measured.
Material and methods
Animals
Male C57BL/6 mice (Japan SLC, Shizuoka, Japan) were housed five per cage in a temperature-controlled room (23 ± 1°C), and allowed free access to water and a standard diet (D12450B; Research Diets Inc., NJ, USA) for 10 days before treatments. Mice were 12 weeks of age at the beginning of the experiment. Animal experiments were approved by the University of Shizuoka Animal Usage Ethics Committee. Mice were divided into two groups: controls (C, n = 15), which were continuously fed with the standard diet and mice given a high-fat diet (H, n = 15). The high-fat diet contained 45 kcal percentage fat (D12451; Research Diets Inc., NJ, USA). Body weight and food intake were recorded twice a week for a period of 5 weeks.
Before dissection on the fifth week, each group of mice was further divided into three subgroups (n = 5 each): non-fasted (nC and nH) and a 15-h fasted (fC and fH) groups, which were killed at 0900 h; and a 15-h fasted group, killed at 1700 h (eC and eH). Blood was collected from the vena cava into capiject tubes (Terumo Medical Corp., Somerset, NJ, USA) and centrifuged at 3000 r.p.m. for 10 min to separate out the plasma, which was stored at −80°C. Liver tissues of approximately 30 mg were transferred into a 1 ml of RNAlater ® solution (Ambion Inc., Austin, TX, USA).
Plasma biochemical analysis
Selected plasma biochemical indices, including glucose, NEFAs, TGL, T-CH, AcAc, and OHBA were determined using an automated analyzer (TBA-120FR, Toshiba Corp., Tokyo, Japan).
Reverse transcriptase-polymerase chain reaction (RT-PCR) analysis
Liver tissues of 15 mg were homogenized with a digital-handheld homogenizer. The medium used for homogenization and the subsequent procedures for total RNA extraction were as described in the RNA tissue kit SII (Fujifilm Corp., Tokyo, Japan). The concentration of the extracted RNA was estimated from optical densities set at 260 and 280 nm (Amersham, Biochrom Ltd., Cambridge, England, UK).
Complementary DNA (cDNA) was synthesized from 300 ng of total RNA according to the protocol by Applied Biosystems (ABI, Foster City, CA, USA). The synthesized cDNA was PCR amplified using the 2× TaqMan®Gene Expression Master Mix and various set of primers obtained from ABI. All transcripts were amplified in an ABI 7500 machine followed the recommendations of the manufacturer. The value of amplification was normalized against glyceraldehyde 3-phosphate dehydrogenase, which acted as an internal control of each sample.
Statistical analysis
All data, except that of food intake, are presented as mean ± s.d. Differences between the control and the high-fat diet-treated mice were determined by the Student’s t-test. For the plasma biochemical analysis, comparisons were also made among controls by using ANOVA, followed by a post hoc Tukey–Kramer Multiple Comparisons test. Differences were considered significant when P was <0.05.
Results
High-fat diet feeding increased food intake and body weight of fasted fH and eH mice by 22% and 35% (v. fC and eC, respectively) at the end of the 5-week treatment. However, non-fasted nH mice which have consumed similar calories of food, as compared to fH and eH, have identical body weight when compared with nC (Figure 1).
Effects of fasting and sampling time on body weight gain (a) and food intake (b) of mice fed with a standard (C) or high-fat (H) diet. Values are mean ± s.d. ***P < 0.001 between fC and fH, and between eC and eH mice, as determined by the Student’s t-test.

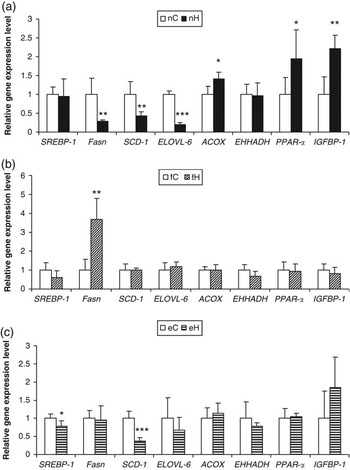
In nH mice, PPAR-α, ACOX and insulin-like growth factor-binding protein (IGFBP)-1 levels were 1.4- to 2.2-fold higher than the control. However, expression of lipogenic genes such as fatty acid synthase (Fasn), stearoyl CoA-desaturase (SCD)-1 and elongation of very long-chain fatty acids (ELOVL)-6 were lowered by 71%, 58% and 80%, respectively (nH v. nC) (Figure 2a). Except for Fasn, there was no significant difference between fH and fC in the expression of all the other genes. Fasn in fH mice was markedly upregulated (+3.7-fold v. fC). eC and eH mice have comparable levels of Fasn. Meanwhile, although SCD-1 expression was not significantly different between fH and fC, its level of expression was significantly reduced when liver samples were collected in the evening. In eH mice, the expression of transcription receptor sterol regulatory-binding protein (SREBP)-1 and SCD-1 were decreased by 21% and 63%, respectively.
Liver gene expression of the control mice (C) and mice treated with a high-fat diet (H) when they were killed under these conditions: (a) early phase of the light cycle in a non-fasted state; (b) early phase of the light cycle after a 15-h fasting; and (c) late phase of the light cycle after a 15-h fasting. Values are mean ± s.d. *P < 0.05; **P < 0.01; ***P < 0.001, as analyzed using the Student’s t-test. SREBP-1 = sterol regulatory binding protein-1; Fasn = fatty acid synthase; SCD-1 = stearoyl CoA-desaturase-1; ELOVL-6 = elongation of very long chain fatty acids-6; ACOX = acyl-CoA oxidase; EHHADH = enoyl-CoA hydratase; PPAR-α = peroxisome proliferator-activated receptor-α; IGFBP-1 = insulin-like growth factor-binding protein-1.

As shown in Table 1, the 5-week treatment with high-fat diet has significantly increased plasma glucose level of the fasted fH mice (+15% v. fC). There was no similar observation for the fasted eH mice, because its control exhibited a glucose level that was 21% higher than fC. The glucose level of eC was also comparable to nC mice. Plasma NEFAs of eC mice was 1.5- to 3.8-fold higher than fC and nC mice. However, it was only nH mice that have profoundly higher NEFAs than its control (+31% v. nC). Plasma TGL of fC mice was 34% to 54% higher than nC and eC mice. Nonetheless, there was no significant difference between the control and the high-fat diet-fed mice for TGL measurement. Despite an increase in TGL, T-CH of fC mice was identical to nC and eC mice. Somehow, T-CH levels of fH and eH mice were significantly elevated when compared to controls (+18% and +10%, respectively). Plasma AcAc and OHBA of both the fC and fH mice were distinctly higher than all the other mice.
Plasma biochemical indices of the different groups of mice

NEFAs = non-esterified fatty acids; TGL = triglycerides; T-CH = total cholesterol; AcAc = acetoacetate; OHBA = hydroxybutyrate.
Different superscript letters (a, b, c) indicate significant differences at P < 0.05, as calculated by ANOVA and post hoc test.
*P < 0.05; **P < 0.01; ***P < 0.001, as calculated by the Student’s t-test.
Discussion
High-fat diet feeding is a commonly used method to induce obesity. Despite that, it is not known that before dissection, continuous food intake can mask the effect of high-fat diet on inducing body weight gain. Mice without fasting, nC and nH, not only failed to show differences in body weight gain at the end of the 5-week treatment, their liver gene expression and plasma biochemical profiles differed significantly from those of the fasted mice.
In mice treated with a high-fat diet, genes responsible for fatty acid catabolism and ketone body synthesis are upregulated, whereas downregulation is found for genes involved in lipogenesis and cholesterol production (Kim et al., Reference Kim, Sohn, Ahn, Lee and Lee2004). Besides that, when C57BL/6 mice fed with a high-fat–high-sucrose diet are killed in a non-fasted state in an early phase of the light cycle, PPAR-α and ACOX expressions are significantly upregulated (Matsuzaka et al., Reference Matsuzaka, Shimano, Yahagi, Kato, Atsumi, Yamamoto, Inoue, Ishikawa, Okada, Ishigaki, Iwasaki, Iwasaki, Karasawa, Kumadaki, Matsui, Sekiya, Ohashi, Hasty, Nakagawa, Takahashi, Suzuki, Yatoh, Sone, Toyoshima, Osuga and Yamada2007). These observations concurred with our data of non-fasted mice (Figure 2a). It is suggested that the inductions of PPAR-α and ACOX are likely to be an adaptive response. On the other hand, IGFBP-1 is known to be negatively related with hypertension, high-density lipoprotein cholesterol, body mass index, waist-to-hip ratio, insulin, proinsulin and TGL levels. Low circulating IGFBP-1 concentration is correlated with impaired glucose tolerance (Heald et al., Reference Heald, Siddals, Fraser, Taylor, Kaushal, Morris, Young, White and Gibson2002). With regard to the properties of PPAR-α, it was logical to see that the expression of IGFBP-1 associated well with that of the PPAR-α in nH mice.
Liver gene expression profiles of the fasted mice (Figure 2b) were completely different from those observed for the non-fasted mice. This was especially interesting for Fasn. Even in the fasted mice per se (Figures 2b and 2c), different sampling time has greatly affected their gene expression levels. The pattern of Fasn, SCD-1, and ELOVL-6 expressions appeared to be contrasting between liver samples collected in the early and late phases of the light cycle. eH mice showed lower lipogenic gene levels than fH mice. The differences were likely to be due to changes in hormonal levels that follow the circadian system. As shown by Cano et al. (Reference Cano, Jimenez-Ortega, Larrad, Toso, Cardinali and Esquifino2008), plasma corticosterone level of the high-fat diet-fed rat fluctuates throughout the 24-h period, and is lower from 1700 to 2100 hours than in the early light cycle.
Because pineal melatonin increases significantly from 1700 to 2100 hours (Cano et al., Reference Cano, Jimenez-Ortega, Larrad, Toso, Cardinali and Esquifino2008), it is conceivable that melatonin is also involved in regulating lipogenic gene expression, although the exact mechanism is not clear. The significantly decreased SCD-1 expression, as well as low levels of Fasn and ELOVL-6 in eH, but not in fH mice, may occur as a result of elevated melatonin, because melatonin prevents hepatosteatosis (Hu et al., Reference Hu, Yin, Jiang, Huang and Shen2009). It is interesting to point out that the expression pattern of SCD-1 and ELOVL-6, as observed in eH, was very similar to that of the nH mice. Comparison made between the present findings with that reported by Hu et al. (Reference Hu, Yin, Jiang, Huang and Shen2009), which indicate that melatonin has no effect on hepatic expression of lipogenic genes, suggested further that the discrepancies are due to differences in the sampling time.
Data obtained for plasma glucose level have probably the greatest impact on metabolic syndrome-related studies, as glucose is a commonly measured parameter. It is generally known that plasma glucose level is lower in a fasted than in a non-fasted state. The differences between these two are valid for samples collected either in the early (shown in this study) or in the late phase of the light cycle (Nakai et al., Reference Nakai, Hashida, Kadota, Minami, Shimizu, Matsumoto, Kato and Abe2008). However, we may not be aware that even if fasting samples are collected from all subjects, different sampling time significantly affects the readings (fC v. eC). This can explain the distinctive differences found between fC and fH, but not between eC and eH mice.
NEFAs are increased in the liver during fasting (Song et al., Reference Song, Nara and Nakamura2002). The released fatty acids may act as endogenous ligands for PPAR-α (Cheon et al., Reference Cheon, Nara, Band, Beever, Wallig and Nakamura2005). In this study, plasma NEFAs of both the fasted fC and eC mice were significantly higher than nC mice. The control levels of PPAR-α and ACOX were not compared since the values have been normalized. However, induction of β-oxidation can be seen by referring to the plasma ketone bodies. As expected, OHBA was distinctly elevated in fC and eC mice, whereas AcAc was significantly increased in fC mice. Meanwhile, fH mice have lower levels of ketone bodies when compared to fC. With Fasn expression being distinctly upregulated, these results implied that high-fat diet feeding suppresses β-oxidation. On the other hand, NEFAs were significantly higher in nH than in nC mice. The increased NEFAs corresponded well with the high expressions of PPAR-α and ACOX.
In human, serum TGL reaches a minimum level after a 7 to 8 h of fasting, where the later the sample is collected (between 1100 and 1800 hours) would mean the longer the fasting period (Sundvall et al., Reference Sundvall, Laatikainen, Hakala, Leiviska and Alfthan2008). Therefore, it was reasonable to suggest that the significantly decreased TGL in eC mice, the lowest among the three study groups, was due mainly to the late sampling time. Besides that, it is reported that TGL increases rapidly postprandial before being lipolyzed by lipoprotein lipase. Hence, a 9- to 12-h fasting is recommended in order to obtain a sample that represents the metabolic steady state (Stein and Myers, Reference Stein and Myers1995). A very long fast will cause the serum TGL to increase transiently (Zech et al., Reference Zech, Grundy, Steinberg and Berman1979), and this could be the reason of high TGL in fC mice. With the same fasting period being introduced to both eC and fC, current findings suggested that TGL is very much affected by circadian rhythm. eH mice, which showed low TGL, have also shown a reduction in lipogenic gene expression, especially the SCD-1.
It is common that both fasting and non-fasting samples are collected for T-CH measurement (Sundvall et al., Reference Sundvall, Laatikainen, Hakala, Leiviska and Alfthan2008), which suggest that food has no effect on plasma T-CH level. However, this may only be true in mice given a normal diet. In this study, T-CH level of all the controls (nC v. fC v. eC) were comparable, whereas significant increase in T-CH was shown in fasted fH and eH mice. Non-fasted nC and nH mice showed identical T-CH levels. These results also suggested that plasma T-CH level is not affected by circadian rhythm. Elevated T-CH in fH mice was accompanied by enhanced Fasn expression and decreased β-oxidation. Although eH mice exhibited high T-CH levels, differences between eC and eH in the plasma AcAc and OHBA were not statistically significant.
Conclusion
We knew that apart from plasma biochemical indices, gene expression, either in the liver or adipose tissues, has always been used to provide insight for mechanisms that lead to obesity or diabetes. However, as shown above, fasting plasma collected in the early light cycle is needed for plasma biochemical analysis, but non-fasting samples may be more suitable when liver gene expression is studied. Of course, these data cannot fully represent the situation in human, especially the turnover of TGL and T-CH levels, but a diet-induced obese model does indeed reproduce human obesity better than genetically developed obese animal models (Aoki et al., Reference Aoki, Honda, Kishida, Kitano, Arai, Tanaka, Yokota, Nakagawa, Asakura, Nakai and Mae2007). In conclusion, because gene expression is affected by fasting and sampling time, physiological and biological variables need to be considered during the interpretation of experimental data.
Acknowledgements
This study was carried out in the University of Shizuoka, Shizuoka, Japan and was supported by the Global COE Program from the Ministry of Education, Sciences, Sports and Culture of Japan. I thank Prof. Kayoko Shimoi for helpful advice and Mr Akio Kobayashi from the Japan Tobacco for conducting the plasma biochemical analysis.