INTRODUCTION
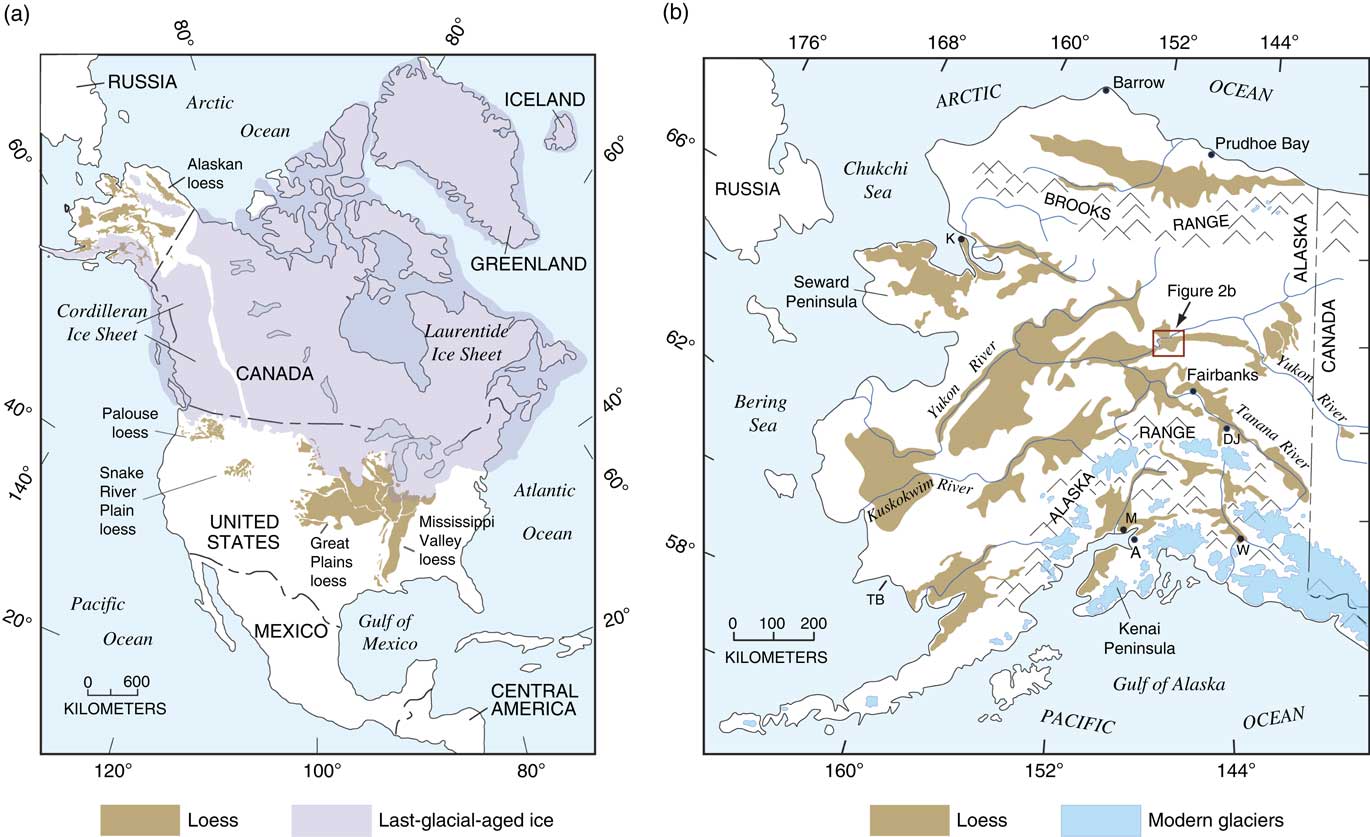
Loess is one of the most widespread Quaternary deposits of North America (Fig. 1a). It is commonly the uppermost surficial deposit in much of the central part of North America, particularly in the Great Plains and greater Mississippi River valley regions. In addition, loess is extensive over much of Alaska and adjacent parts of Yukon Territory in Canada (Fig. 1b). In some parts of central Alaska, loess can be several tens of meters thick and, based on a combined volcanic ash and paleomagnetic record, may date back as far as ~3 Ma (Westgate et al., Reference Westgate, Stemper and Péwé1990).
(a) Map showing the distribution of loess (brown) in North America, from Bettis et al. (Reference Bettis, Muhs, Roberts and Wintle2003) and sources therein; extent of last-glacial-aged ice (purple) is from Kaufman et al. (Reference Kaufman, Manley, Ager, Axford, Balascio, Begét and Brigham-Grette2004) for Alaska and Dyke et al. (Reference Dyke, Andrews, Clark, England, Miller, Shaw and Veillette2002) for all other areas. (b) Map showing the distribution of loess deposits (brown) in Alaska, compiled from Hopkins (Reference Hopkins1963) and Sainsbury (Reference Sainsbury1972) for the Seward Peninsula; Williams (Reference Williams1962), Foster et al. (Reference Foster, Laird, Keith, Cushing and Menzie1983), and Weber et al. (Reference Weber, Wheeler, Rinehart and Light1997) for areas along the Yukon River; and Péwé (Reference Péwé1975a) for all other parts of the region. Most mapping from these sources has been field checked by the authors. Also shown is the present extent of glaciers (blue) in the region, taken from Péwé (Reference Péwé1975a) and Brown et al. (Reference Brown, Ferrians, Heginbottom and Melnikov1997). The red box in panel b outlines the study area. Abbreviations for other localities: A, Anchorage; DJ, Delta Junction; K, Kotzebue; M, Matanuska Valley area; TB, Togiak Bay; W, Wrangell–St. Elias National Park. (For interpretation of the references to color in this figure legend, the reader is referred to the web version of this article.)

In the glaciated portion of central North America, by far the most extensive and thickest loess unit of the Quaternary is Peoria Silt, dating to the last glacial period, here considered to be ~30 ka to ~15 ka (all ages herein are in thousands of calibrated years), based on loess chronologies in Grimley et al. (Reference Grimley, Follmer and McKay1998), Bettis et al. (Reference Bettis, Muhs, Roberts and Wintle2003), Muhs et al. (Reference Muhs, Bettis, Roberts, Harlan, Paces and Reynolds2013a), and Pigati et al. (Reference Pigati, McGeehin, Muhs, Grimley and Nekola2015). This age range of loess accumulation correlates with the latest portion of Marine Oxygen Isotope Stage (MIS) 3 and most of MIS 2, based on the time scale given in Martinson et al. (Reference Martinson, Pisias, Hays, Imbrie, Moore and Shackleton1987). Peoria Silt ranges in thickness from less than a meter to up to a few tens of meters. Along the eastern side of the Missouri River in western Iowa, for example, glaciogenic Peoria Silt is ~40 m thick (Muhs and Bettis, Reference Muhs and Bettis2000). Farther west, and south of the Platte River system in Nebraska, (mostly) nonglaciogenic Peoria Silt is as much as ~47 m thick (Muhs et al., Reference Muhs, Bettis, Aleinikoff, McGeehin, Beann, Skipp, Marshall, Roberts, Johnson and Benton2008b). At almost every locality where it is found, Peoria Silt is significantly thicker than the next-oldest loesses (Roxana Silt or Gilman Canyon Formation, ~70–60 ka [MIS 4]; and Loveland Silt, ~160–140 ka [MIS 6]). Based on thickness and particle-size trends, paleowinds in the North American midcontinent during the time of Peoria Silt accumulation were dominantly from the west and/or northwest (Muhs and Bettis, Reference Muhs and Bettis2000).
In Alaska, much less is known about the possible occurrence of last-glacial loess accumulation and paleowinds during this time period. These are the two primary questions that are addressed in the present study. Péwé (Reference Péwé1975a, p. 37) stated that most loess in Alaska was deposited during the past two glacial periods, interpreted to mean those time periods that would correlate to MIS 6 (penultimate glacial period) and MIS 4, 3, and 2 (last glacial period, sensu lato), respectively. In contrast to central North America, however, loess deposits in Alaska that have been securely dated to the last glacial period are rare. Those that have been identified are only thin accumulations, for the most part. For example, on the Seward Peninsula (Fig. 1b), loess blankets a land surface with fossil tundra vegetation that is well dated to the last glacial period (Höfle and Ping, Reference Höfle and Ping1996; Höfle et al., Reference Höfle, Edwards, Hopkins and Mann2000), but the deposit is less than a meter thick. South of this locality, along Norton Sound (Fig. 1b), eolian silt dating to the last glacial period is found in a maar lake deposit (Muhs et al., Reference Muhs, Ager, Been, Bradbury and Dean2003a), but loess adjacent to this lake is thin. In the Fox Permafrost Tunnel near Fairbanks, silt that could be reworked loess is 6–7 m thick and is bracketed by radiocarbon ages of ~9.5 ka (above) and ~34 ka (below) and therefore could date to the last glacial period (Hamilton et al., Reference Hamilton, Craig and Sellmann1988). However, there are radiocarbon age inconsistencies in the section, and whether the silt is truly eolian is not certain. Not far from the Fox Permafrost Tunnel, at an upland site, loess is dated to between ~36 ka and ~12 ka but is less than a meter thick (Muhs et al., Reference Muhs, Ager, Bettis, McGeehin, Been, Begét, Pavich, Stafford and Stevens2003b). Elsewhere near Fairbanks, attempts to date loess have been frustrated by uncertain luminescence geochronology or a lack of materials suitable for radiocarbon analyses (Oches et al., Reference Oches, Banerjee, Solheid and Frechen1998; Berger, Reference Berger2003; Muhs et al., Reference Muhs, Ager, Bettis, McGeehin, Been, Begét, Pavich, Stafford and Stevens2003b). Recent identification of Dawson tephra deposits (~30 ka) in the upper part of loess deposits near Fairbanks permits an inference of as much as ~3 m of loess accumulation since the time of ash deposition (Jensen et al., Reference Jensen, Evans, Froese and Kravchinsky2016). It is not known, however, how much of this sediment is of last glacial age and how much is of Holocene age. In the Delta Junction area of central Alaska, loess has been dated only to the Holocene (Péwé, Reference Péwé1975a; Muhs et al., Reference Muhs, Ager, Bettis, McGeehin, Been, Begét, Pavich, Stafford and Stevens2003b). On the Kenai Peninsula of southern Alaska, Lethe tephra deposits dating to ~19 ka to ~15 ka are found below or in the lower part of loess, but as on the Seward Peninsula, this eolian silt is less than a meter thick (Reger et al., Reference Reger, Pinney, Burke and Wiltse1996). Elsewhere in southern Alaska, near Anchorage, loess of the Matanuska Valley all dates to the Holocene (Muhs et al., Reference Muhs, McGeehin, Beann and Fisher2004, Reference Muhs, Budahn, Skipp and McGeehin2016a), as does loess in Wrangell–St. Elias National Park, to the east (Muhs et al., Reference Muhs, Bettis, Roberts, Harlan, Paces and Reynolds2013a). Many of the youngest loess deposits in northern Alaska (north of the Brooks Range), in southwestern Alaska, and along much of the Yukon River (Fig. 1b), however, are either poorly dated or not dated at all.
In contrasting the thick last-glacial Peoria Silt deposits of the midcontinent with the meager record of last-glacial loess in Alaska, Muhs et al. (Reference Muhs, Ager, Bettis, McGeehin, Been, Begét, Pavich, Stafford and Stevens2003b) offered the hypothesis that the role of vegetation in trapping dust could be a significant factor in loess accumulation. Tsoar and Pye (Reference Tsoar and Pye1987) note that deposition of suspended dust (i.e., loess accumulation) occurs when (1) there is a reduction in wind velocity, (2) dust particles are washed out in rain, or (3) particles in suspension are trapped by roughness elements. Regarding mechanism 3, Tsoar and Pye (Reference Tsoar and Pye1987) point out that surface roughness heights increase dramatically with increasing vegetation height. Thus, roughness heights increase from bare sand to grassland (steppe or tundra vegetation) to forest. Indeed, roughness heights are more than an order of magnitude greater for forest compared with grass, and by analogy, herb tundra.
Set in this context, the lack of last-glacial loess in the stratigraphic record of central Alaska might be explained by a sparse, herb tundra vegetation with low dust-trapping capability at that time. The presence of a last-glacial-aged, herb tundra community is well documented for interior Alaska from many pollen and macrofossil studies (Ager and Brubaker, Reference Ager and Brubaker1985; Edwards and Brubaker, Reference Edwards and Brubaker1986; Anderson et al., Reference Anderson, Reanier and Brubaker1988; Anderson and Brubaker, Reference Anderson and Brubaker1994; Edwards and Barker, Reference Edwards and Barker1994; Edwards et al., Reference Edwards, Anderson, Brubaker, Ager, Andreev, Bigelow and Cwynar2000, Reference Edwards, Mock, Finney, Barber and Bartlein2001, Reference Edwards, Grosse, Jones and McDowell2016; Bigelow and Edwards, Reference Bigelow and Edwards2001; Ager, Reference Ager2003; Bigelow et al., Reference Bigelow, Brubaker, Edwards, Harrison, Prentice, Anderson and Andreev2003; Carlson and Finney, Reference Carlson and Finney2004; Tinner et al., Reference Tinner, Hu, Beer, Kaltenrieder, Scheurer and Krähenbühl2006). In adjacent Yukon Territory, evidence from plant macrofossils and pollen indicates that well-drained sites hosted a steppe-tundra vegetation at ~30 ka (Zazula et al., Reference Zazula, Froese, Westgate, La Farge and Mathewes2005) and a xeric steppe and/or steppe-tundra during the last glacial period (Zazula et al., Reference Zazula, Schweger, Beaudoin and McCourt2006). In contrast, in central North America, the presence of last-glacial-aged boreal forest (see reviews in Baker and Waln, Reference Baker and Waln1985; Wells and Stewart, Reference Wells and Stewart1987; Roberts et al., Reference Roberts, Muhs, Wintle, Duller and Bettis2003) likely enhanced the potential for loess accumulation and may offer part of the explanation for the extraordinary Peoria Silt thicknesses in the Great Plains and Mississippi River valley regions.
In a recent study, Jensen et al. (Reference Jensen, Evans, Froese and Kravchinsky2016) evaluated the hypothesis of vegetation control on the degree of loess accumulation outlined by Muhs et al. (Reference Muhs, Ager, Bettis, McGeehin, Been, Begét, Pavich, Stafford and Stevens2003b). Jensen et al. (Reference Jensen, Evans, Froese and Kravchinsky2016) point out that there is evidence for significant loess accumulation in central Alaska during earlier glacial periods (MIS 4 and MIS 6), presumably when an herb tundra vegetation also existed across Alaska. Furthermore, these investigators noted that in the middle Pleistocene and early Pleistocene, glaciations were much more extensive in Alaska than during the last glacial period (Kaufman et al., Reference Kaufman, Manley, Ager, Axford, Balascio, Begét and Brigham-Grette2004), which could have enhanced the supply of glaciogenic silt available for loess accumulation. The data in Jensen et al. (Reference Jensen, Evans, Froese and Kravchinsky2016) confirm that the geologic record of last-glacial loess accumulation at a well-studied site (Halfway House) in central Alaska is modest.
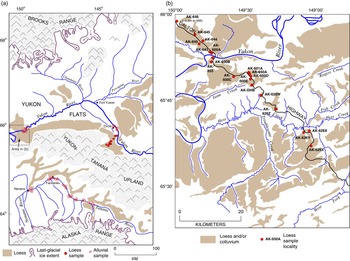
In the present study, we report new data on a loess body, south of the Yukon River in central Alaska (Figs. 1b and 2), that has not received much attention. Extensive loess has been mapped previously in this area (Williams, Reference Williams1962; Péwé, Reference Péwé1975a; Foster et al., Reference Foster, Laird, Keith, Cushing and Menzie1983; Weber et al., Reference Weber, Wheeler, Rinehart and Light1997), but not studied in detail. In this area, the Yukon River valley bottom (Fig. 2a) is referred to as “Yukon Flats.” The loess body studied here (Fig. 2b) is situated along the lowermost slopes of the Yukon-Tanana Upland that borders Yukon Flats, which we refer to as “Yukon-Tanana Upland loess.” We note, however, that this loess body is part of a larger, nearly contiguous loess body that continues across the Yukon Flats area (Fig. 2a).
(a) Map showing the distribution of loess in central Alaska, downvalley extent of ice during the last glacial period, major river systems, mountain ranges, and alluvial sample localities (open red dots) along the Tanana and Yukon Rivers (from Muhs and Budahn, Reference Muhs and Budahn2006). Loess distribution from Williams (Reference Williams1962), Péwé et al. (Reference Péwé, Wahrhaftig and Weber1966), Péwé (Reference Péwé1975a), Foster et al. (Reference Foster, Laird, Keith, Cushing and Menzie1983), and Weber et al. (Reference Weber, Wheeler, Rinehart and Light1997), with minor new mapping by Muhs et al. (Reference Muhs, Ager, Bettis, McGeehin, Been, Begét, Pavich, Stafford and Stevens2003b). Downvalley extent of last-glacial ice is redrawn in simplified form from Kaufman et al. (Reference Kaufman, Manley, Ager, Axford, Balascio, Begét and Brigham-Grette2004). (b) Map of loess, colluviated loess, and colluvium (brown shades) and major drainages in the study area near the Dalton Highway Yukon River crossing (see general location in panel a). Filled red dots show loess sections studied. Distribution of loess and colluvium slightly modified from Weber et al. (Reference Weber, Wheeler, Rinehart and Light1997) with minor new mapping by the authors. (For interpretation of the references to color in this figure legend, the reader is referred to the web version of this article.)

Along the Yukon River in central Alaska, the older part of the loess record has been studied in detail at only a couple of localities (Begét et al., Reference Begét, Edwards, Hopkins, Keskinen and Kukla1991; McDowell and Edwards, Reference McDowell and Edwards2001; Matheus et al., Reference Matheus, Begét, Mason and Gelvin-Reymiller2003; Reyes et al., Reference Reyes, Froese and Jensen2010a, Reference Reyes, Jensen, Zazula, Ager, Kuzmina, La Farge and Froese2010b, Reference Reyes, Zazula, Kuzmina, Ager and Froese2011; Jensen et al., Reference Jensen, Reyes, Froese and Stone2013). These studies focused on the early and middle Pleistocene record, and the question of last-glacial-aged loess was not addressed. Nevertheless, along the middle reaches of the Yukon River in Alaska, Froese et al. (Reference Froese, Smith and Clement2005) reported a number of localities where maximum-limiting ages of ~14–12 ka were obtained below several meters of eolian sand, and one locality yielded ages of ~11.2–10.5 ka in the middle of a section that exposes ~14 m of loess. Thus, the study of Froese et al. (Reference Froese, Smith and Clement2005) indicates that last-glacial-aged loess may exist in the region. Here, we report new stratigraphic, geochronological, mineralogical, sedimentologic, and geochemical data from loess exposed in the Yukon-Tanana Upland and Yukon Flats areas.
Investigation of the loess deposits in the Yukon-Tanana Upland and Yukon Flats areas allows us to test two hypotheses. One is that significant amounts of last-glacial-aged (MIS 2) loess may exist in central Alaska, which has implications for the proposal of Muhs et al. (Reference Muhs, Ager, Bettis, McGeehin, Been, Begét, Pavich, Stafford and Stevens2003b) that the type of dominant vegetation exerts a strong control on the amount of loess accumulation in this region. If this hypothesis is confirmed, then a second hypothesis to test is the reconstruction of last-glacial paleowinds from the northeast for interior Alaska, proposed by Hopkins (Reference Hopkins1982) and Lea and Waythomas (Reference Lea and Waythomas1990), based on locations of dune fields and orientations of dunes within those sand bodies. Testing of this hypothesis requires identification of the source or sources of loess in the study area.
METHODS
Soils, paleosols, and loess sediments were measured and described in the field using standard terminology as practiced in the United States (Birkeland, Reference Birkeland1999; Schoeneberger et al., Reference Schoeneberger, Wysocki and Benham2012). Materials collected for radiocarbon dating include land snails and plant macrofossils from peaty deposits within the loess. Land snails used for dating are all in the Succineidae family, which Pigati et al. (Reference Pigati, Rech and Nekola2010, Reference Pigati, McGeehin, Muhs and Bettis2013) have demonstrated yields reliable radiocarbon ages. Plant remains from peats found in loess were pretreated according to methods described by McGeehin et al. (Reference McGeehin, Burr, Jull, Reines, Gosse, Davis, Muhs and Southon2001). All radiocarbon ages were calibrated to calendar ages using the IntCal13 data set and CALIB 7.1 program (Stuiver and Reimer, Reference Stuiver and Reimer1993; Reimer et al., Reference Reimer, Bard, Bayliss, Beck, Blackwell, Bronk Ramsey and Grootes2013). Ages from this study are presented in thousands of calibrated years before present (yr BP; 0 yr BP=AD 1950; ka=thousands of calibrated 14C yr BP), and uncertainties are given at the 95% (2σ) confidence level (Table 1).
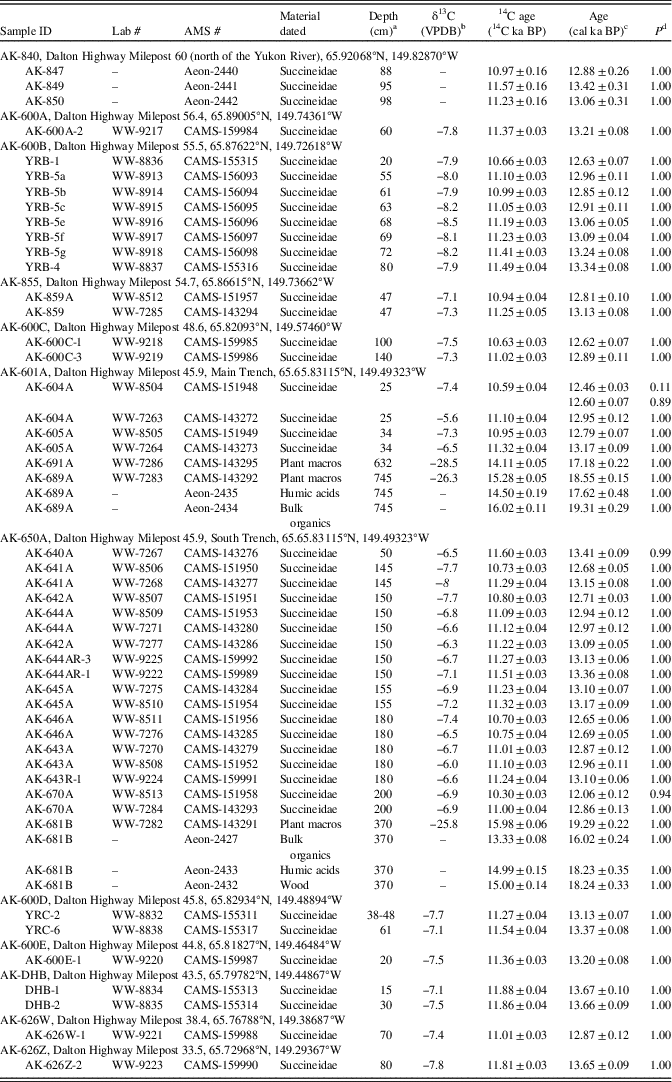
Summary of sample information and ages for Succineidae shells and plant remains at all sites.

Note: AMS, accelerator mass spectrometry; VPDB, Vienna Pee Dee belemnite.
a Depth from top of exposure.
b Some of the shell aliquots processed at the U.S. Geological Survey (denoted by the prefixes WW- and CAMS-) did not contain enough material for stable isotope analyses and were assigned δ13C values of −8‰ (shown in italics). δ13C values were not obtained for samples processed at Aeon Laboratories LLC (denoted by the prefix Aeon-).
c Calibrated ages were calculated using CALIB v. 7.1html, IntCal13.14 C data set; limit 50.0 calendar ka BP. Calibrated ages are reported as the midpoint of the calibrated range. Uncertainties are reported as the difference between the midpoint and either the upper or lower limit of the calibrated age range, whichever is greater. Multiple ages are reported when the probability of a calibrated age range exceeds 0.05.
d P is the probability of the calibrated age falling within the reported range as calculated by CALIB.
Tephra layers are sometimes found in Alaskan loess deposits, and two were found in an exposure in the present study. For tephra analyses, samples were sieved into multiple size fractions, and those with the most abundant glass were utilized for analysis. For the samples collected in this study, the size fraction used was 45–75 µm. Details on preparation methods can be found in Jensen et al. (Reference Jensen, Froese, Preece, Westgate and Stachel2008, Reference Jensen, Preece, Lamothe, Pearce, Froese, Westgate, Schaefer and Begét2011). Major-element geochemistry was determined on single glass shards with a JEOL 8900 superprobe at the University of Alberta microprobe laboratory using a 15 KeV voltage, 10 µm beam diameter, and 6 nA current. A sample of Lipari obsidian (ID 3506) and a sample of the Old Crow ash were run concurrently with all unknown samples to ensure proper calibration and allow accurate comparison between samples run at different times.
For particle-size analyses of loess, soils, and paleosols, samples were pretreated with hydrogen peroxide (30%) to remove organic matter, acetic acid to remove carbonates, and sodium hexametaphosphate to enhance dispersion. Sands (particles with diameters >53 μm) were separated from silts and clays by wet sieving; abundances of coarse silts (53–20 μm), fine silts (20–2 μm), and clays (<2 μm) were determined by settling and pipette analysis. Laboratory precision for pipette analysis was routinely monitored with each suite of sample runs by analysis of a well-characterized, internal loess standard.
For bulk mineralogy, samples were pulverized and analyzed as random mounts by X-ray diffractometry (XRD). For clay mineralogy, samples were first pretreated by removal of organic matter with hydrogen peroxide and removal of carbonates with acetic acid, followed by addition of a sodium hexametaphosphate dispersant. Clays were isolated by settling and suspension and then mounted on glass slides by suction, using the Millipore filter method. Clay slides were X-rayed three times: air dry, after glycolation, and after heating at 550°C for 1 hour. Methods for clay mineral identification follow Moore and Reynolds (Reference Moore and Reynolds1989).
Assessment of the abundance of dominant minerals and determination of the degree of chemical weathering in loess sections were conducted using both bulk mineralogy (semiquantitative, from XRD analyses described previously) and quantitatively using major element concentrations that proxy for the dominant minerals. These chemical proxies include CaO for calcite and dolomite, Na2O for plagioclase, and K2O for K-feldspar and mica. Assessment of the degree of chemical weathering was conducted by calculation of chemical weathering ratios, normalizing the major oxides in primary minerals to an insoluble element (Zr) in a resistant mineral (zircon). The resultant calculations are indexes of the degree of depletion of calcite and dolomite (CaO/ZrO2), plagioclase (Na2O/ZrO2), and mica and K-feldspar (K2O/ZrO2). For selected samples, estimates of calcite content using CaO abundances and XRD results were compared with measurements of CaCO3 content following gas evolution after dissolution with HCl (Dreimanis, Reference Dreimanis1962).
For assessment of possible loess sources, we use ratios of certain trace elements that were identified by Muhs and Budahn (Reference Muhs and Budahn2006) as distinctive for silts in the major river systems of the region. These include the following ratios, all of which utilize trace elements with a minimum degree of mobility in near-surface environments (Taylor and McLennan, Reference Taylor and McLennan1985; McLennan, Reference McLennan1989): Cr/Sc, Th/Ta, As/Sb, and Zr/Hf. We also use two sensitive indicators of rare earth element (REE) composition, Eu/Eu* and LaN/YbN, where the “N” subscript indicates the element is normalized, by convention, to chondrite values (see Muhs and Budahn [Reference Muhs and Budahn2006] for examples of how these values are used in provenance determinations). Finally, major and trace element ratios in the K-bearing minerals, mica and K-feldspar, also provide useful provenance indicators, at least in unaltered loess (Muhs et al., Reference Muhs, Lancaster and Skipp2016b). For these, we recognize that K and the trace elements that follow it (Ba, Rb, and Cs) can potentially be mobile in near-surface environments, but for deep loess, well below the land surface, there is likely very limited leaching of these elements from K-bearing minerals. For both loess and possible sources from river silts, abundances of major and trace elements were determined by instrumental neutron activation analysis, following methods in Budahn and Wandless (Reference Budahn and Wandless2002).
RESULTS
Stratigraphy and chronology
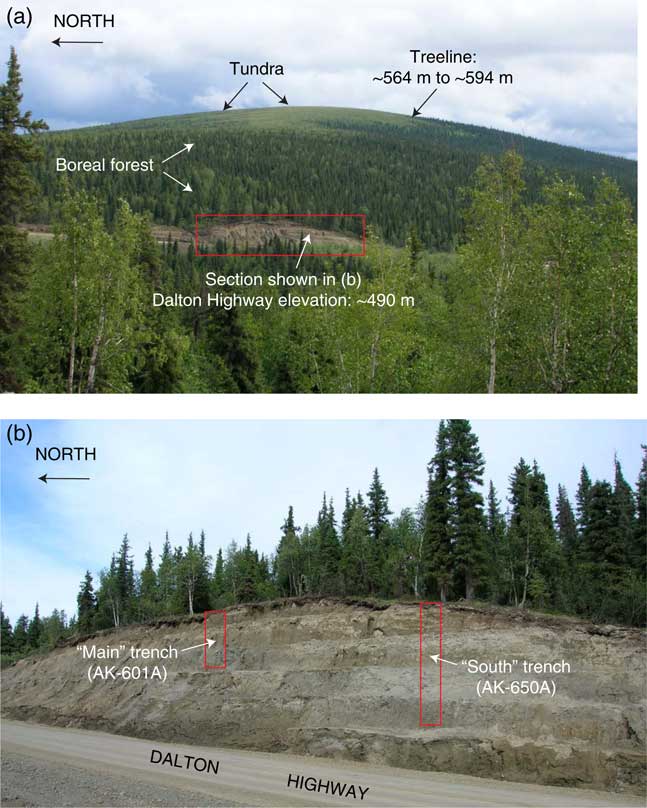
Loess was examined in natural exposures and road cuts along or near the Dalton Highway over a 60-km-long transect, from north of the Yukon River to the southeast (Fig. 2b). Along the Dalton Highway, loess is as much as 10 m or more thick immediately to the south of the Yukon River (locality AK-600B in Fig. 2b) and could be at least that thick several kilometers to the southeast, where bedrock was not reached in sections that expose ~9 m of loess. These minimum thicknesses are best exposed in our “Main Trench” and “South Trench,” excavations (Fig. 3) at localities AK-601A and AK-650A, respectively (Fig. 2b). To the southeast, at localities AK-600E and AK-DHB, bedrock is exposed within a few meters of the surface. Still farther southeast, we did not observe loess on the higher elevations of the Yukon-Tanana Upland (Fig. 2a). In reconnaissance field studies southwest of Circle (Fig. 2a), we observed as much as ~7 m of loess exposed in road cuts, but exposures typically show ~3 m of loess.
(color online) Photographs of road-cut exposure of loess along the Dalton Highway as it appeared in summer of 2006. (a) Distant view looking east, showing road cut exposure at ~490 m elevation and its relation to modern treeline. (b) Close-up view of road cut shown in panel a with locations of trenches excavated: “Main Trench” (AK-601A in Fig. 2b) and “South Trench” (AK-650A in Fig. 2b). Note that as of at least 2011, riprap has been placed over the road cut, and very little of the section is still exposed. Photographs by D.R. Muhs.

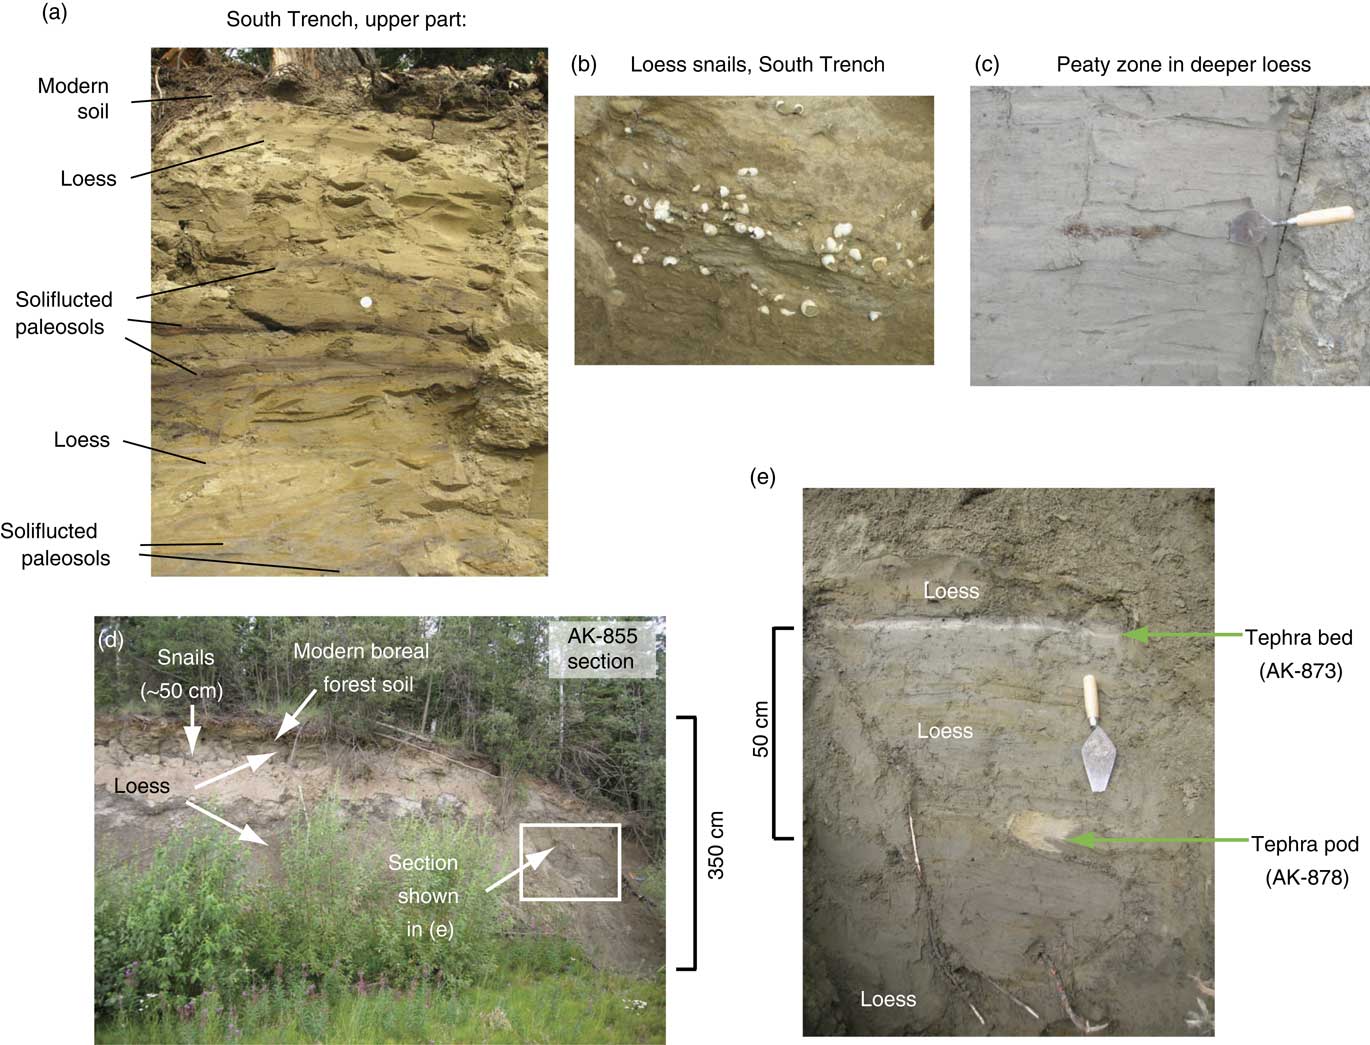
Loess in the Yukon-Tanana Upland usually exhibits little or no bedding and is a massive silt loam (Figs. 3 and 4). When dry, loess from this area is gray (2.5Y 5/1 or 2.5Y 6/1), light brownish gray (2.5Y 6/2), or light olive brown (2.5Y 5/3). Horizontal to subhorizontal oxidation streaks with brighter, redder colors, probably attributable to secondary Fe-oxides, are common, particularly in the upper parts of most sections. In some sections, wood fragments or charcoal, along with slightly darker sediment matrix colors (2.5Y 5/2 or 2.5Y 4/1), indicate the likely presence of paleosols, with higher organic matter content. This is particularly evident in the upper part of the South Trench. In this section, what we interpret to be soliflucted paleosols are present, along with horizontal to subhorizontal wood-rich zones 1–3 cm thick (Fig. 4a). Both above and below the paleosols and wood-rich zones in the South Trench excavation, there are land snails, commonly in clusters (Fig. 4b). The snails are all in the Succineidae family, and they may be Succinea strigata, based on a hypothesized identification of this species in loess of the region by Williams (Reference Williams1962). These land snails were found at almost all the sections studied and form an important basis for the chronology. Thin loess occurs above the snail clusters, and modern soils cap the sections. Peaty zones can are found deeper in both the Main Trench and South Trench exposures (Fig. 4c). Although tephra deposits are often observed in many Alaskan loess sections (see examples in Jensen et al., Reference Jensen, Reyes, Froese and Stone2013, Reference Jensen, Evans, Froese and Kravchinsky2016), we observed only one section that contains them, locality AK-855 (Fig. 4d and e). Here, tephra deposits are found at a depth of 175–178 cm (as a layer) and at 220–225 cm (as a pod).
(color online) Photographs showing loess and features within exposures. (a) Loess and paleosols, South Trench; silver circle in the middle of the exposure is a U.S. 25-cent piece with a diameter of 2.3 cm. (b) Land snail cluster, South Trench. (c) Typical peat-rich zone found in deeper parts of loess sections found in Main Trench and South Trench. (d) Long view of AK-855 section showing loess and modern soil; tephra deposits are barely visible in box at right. (e) Close-up view of loess, ash layer, and ash pod in panel d. Photographs by D.R. Muhs.

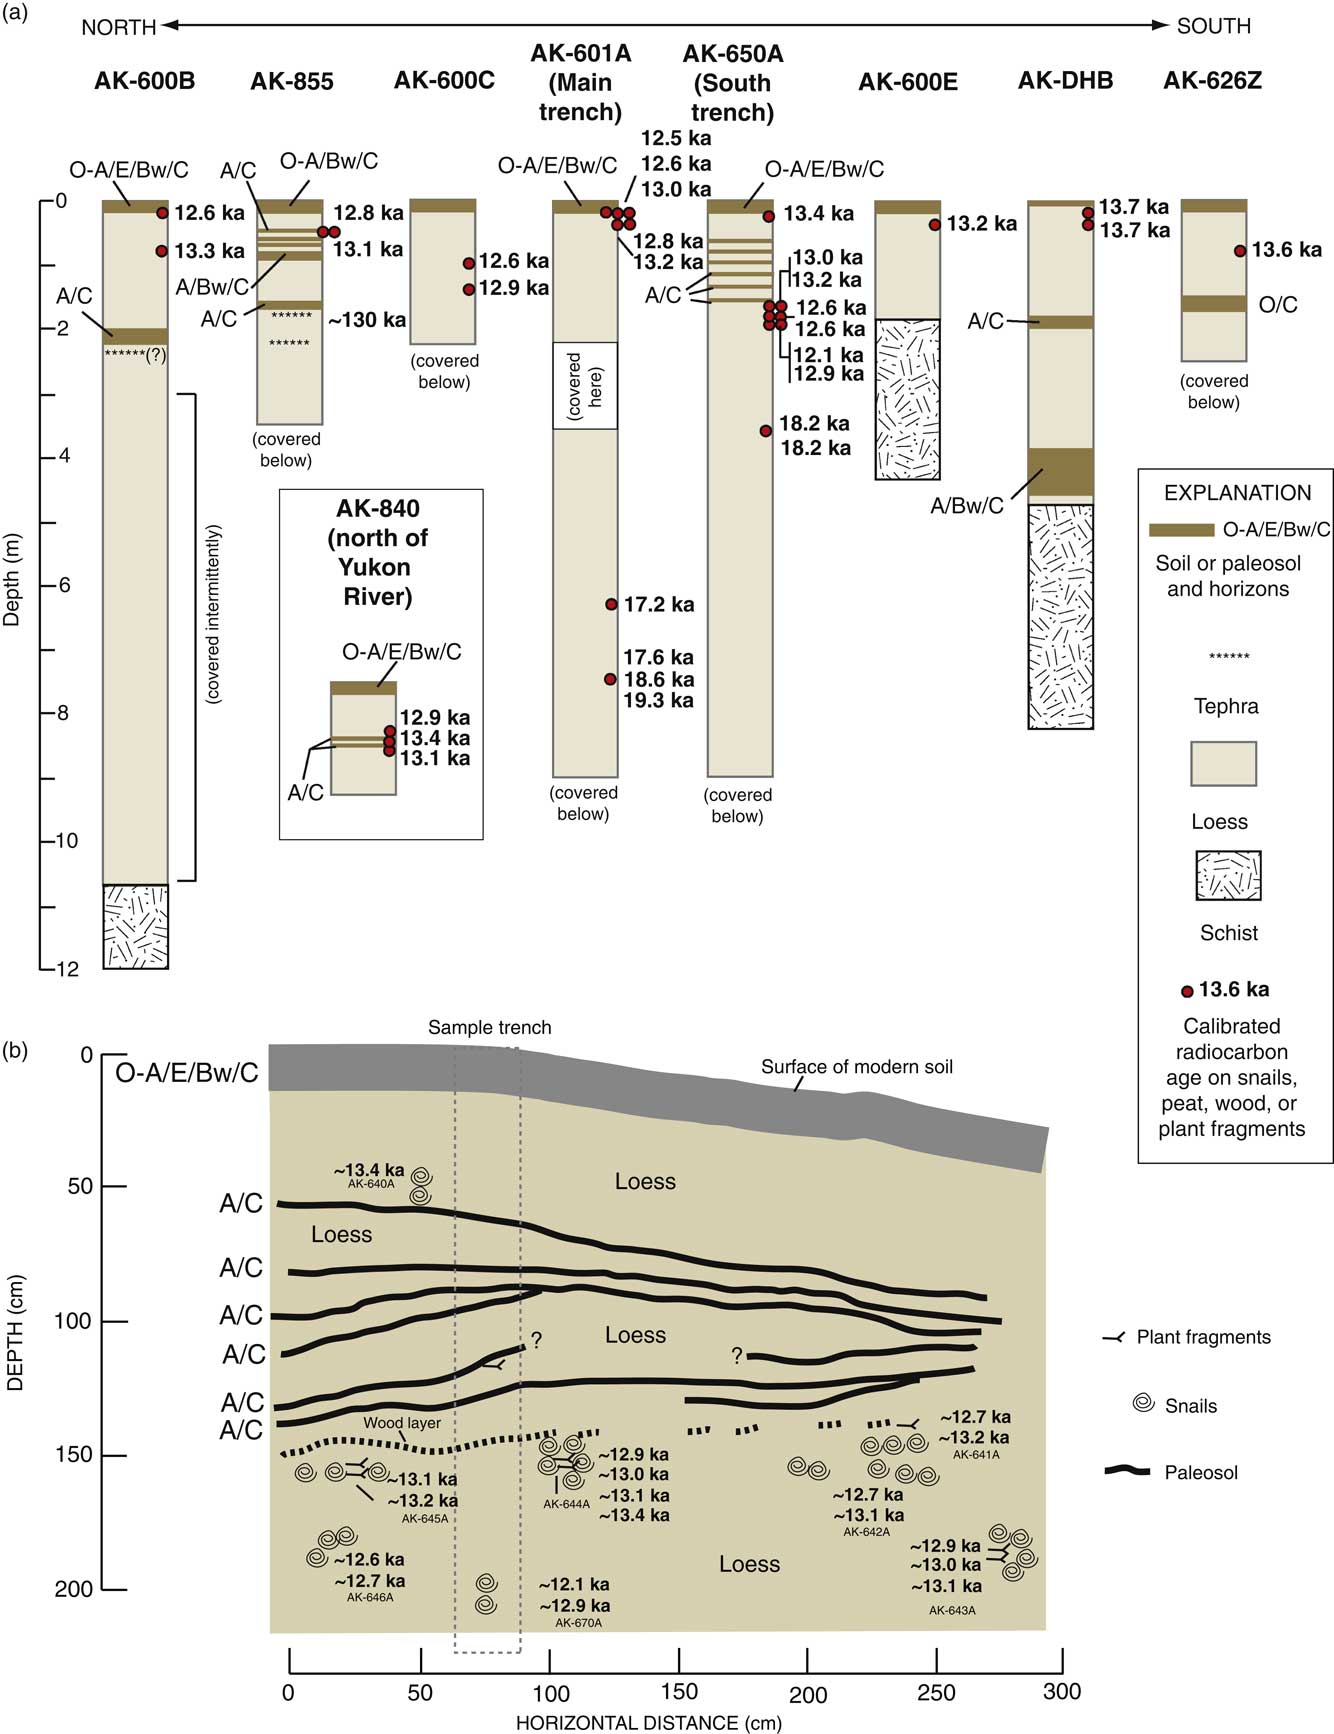
Radiocarbon dating of land snails forms the primary basis for our chronology of loess deposition, augmented by radiocarbon ages of plant remains from peaty zones in deeper parts of the loess, and tephrochronology at one section. Radiocarbon analyses of plant fragments within the Main Trench (locality AK-601A) gave calibrated ages of ~18.6 ka (AK-689A at 745 cm depth) and ~17.2 ka (AK-691A at 632 cm depth; Fig. 5a). Nearby, at the South Trench (locality AK-650A), peaty material at a depth of 350–375 cm gave a calibrated radiocarbon age of ~18.2 ka (Fig. 5a, Table 1). All three of these ages are in good stratigraphic agreement with younger ages derived from higher in the sections, discussed subsequently.
(color online) (a) Loess sections studied along the Dalton Highway in the Yukon-Tanana Upland with calibrated radiocarbon ages; locations are shown in Figure 2b, and complete radiocarbon data are given in Table 1. (b) Details of the stratigraphy and calibrated radiocarbon ages of land snails in the upper part of the South Trench (AK-650A; see Fig. 2b for location and Figs. 3 and 4 for photographs).

In loess sections at 12 localities (Figs. 2b and 5a, Table 1), snails were collected from the upper parts of the sections, but below the modern boreal forest soils. The modern soils in the sections have O or A/E/Bw/C profiles, similar to the Fairbanks silt loam series mapped in the Fairbanks area (White et al., Reference White, Koepke and Swanson2000). The Fairbanks silt loam is a Typic Cryochrept, a common soil type found in upland loess localities under boreal forest in central Alaska. The observation of the snail occurrences below these modern soils is critical, because it means that the snails were living on land surfaces that existed while loess accretion was still taking place. Nevertheless, in no case were snails found at depths below ~2 m, and in most cases, snails were found only within the upper meter of the loess section. Calibrated ages of these snails span a very short interval of time, from ~13.7 ka to ~12.1 ka (Fig. 5a, Table 1). Because analytical uncertainties of calibrated ages of the snails are mostly on the order of ~100 to ~200 yr (Table 1), many of these ages could, in principle, be interpreted as significantly different from one another. As pointed out by Pigati et al. (Reference Pigati, Rech and Nekola2010), however, although many land snails (including Succineidae) are suitable for radiocarbon dating, some of them do incorporate small amounts of inherited, “dead” carbon, a process often referred to as the “limestone effect.” Based on Pigati et al.’s (Reference Pigati, Rech and Nekola2010) studies of modern shells of the Succineidae family, the limestone effect with these taxa ranges from <300 yr to ~600 yr. Thus, although the strictly analytical uncertainties would permit an interpretation that certain of the snails in loess in this area are younger than others, the much greater possible uncertainty with the limestone effect—though not fatal to dating the deposits—would permit a simpler interpretation that all these snails are of approximately the same age, about 13 ka to 12 ka. This may explain the apparent reversals in some snail ages at the South Trench site, where several clusters of snails from different depths and over an approximately 300 cm horizontal distance were analyzed (Fig. 5b). We interpret the apparent snail age differences from place to place in this trench to be attributable to small but varying amounts of dead carbon uptake by snails in this carbonate-rich loess.
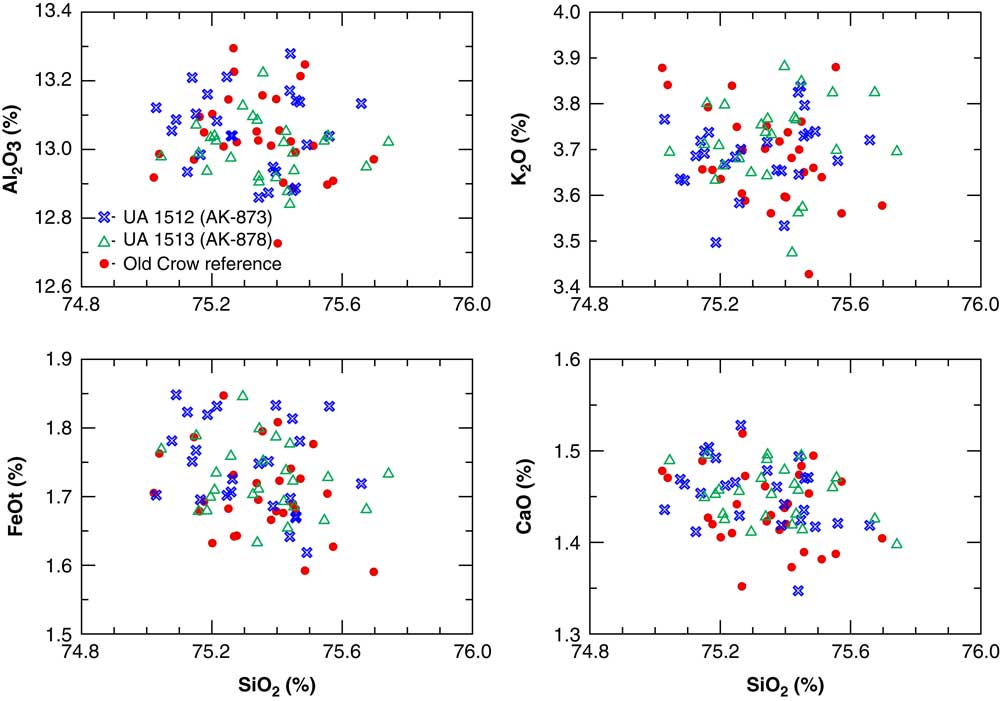
Locality AK-855, situated only about a kilometer south of the Yukon River, is one of our thinner exposures but apparently has one of the oldest records. Tephra deposits were exposed at depths of ~175 cm (as a bed) and at ~225 cm (as a pod; see Fig. 4d and e). Considerable effort has been undertaken in the past couple of decades to characterize the Quaternary tephra deposits found in loess and other sediments of Alaska and Yukon Territory (see Preece et al., Reference Preece, Westgate and Gorton1992, Reference Preece, Westgate, Stemper and Péwé1999, Reference Preece, Pearce, Westgate, Froese, Jensen and Perkins2011; Froese et al., Reference Froese, Westgate, Preece and Storer2002, Reference Froese, Zazula and Reyes2006; Matheus et al., Reference Matheus, Begét, Mason and Gelvin-Reymiller2003; Muhs et al., Reference Muhs, Ager, Bettis, McGeehin, Been, Begét, Pavich, Stafford and Stevens2003b; Jensen et al., Reference Jensen, Froese, Preece, Westgate and Stachel2008, Reference Jensen, Reyes, Froese and Stone2013, Reference Jensen, Evans, Froese and Kravchinsky2016). The primary means of correlation is major element geochemistry of glass shards, an approach that is followed here. The upper layer (AK-873 in Fig. 4e) has a mean SiO2 content of 75.32±0.17%, and the lower pod (AK-878 in Fig. 4e) has a mean SiO2 content of 75.36±0.17%. When these values are plotted against other major element abundances (Al2O3, CaO, FeOt, and K2O), the glass shards from this section overlap those of the Old Crow tephra deposits, based on the geochemistry of this ash (Fig. 6) from a key locality at Togiak Bay, in southwestern Alaska (Fig. 1b). Thus, the volcanic ash layer and ash pod at the AK-855 section are likely another occurrence of the Old Crow tephra deposits that are found over much of Alaska and Yukon Territory.
Major element geochemistry of glass shards from ash layer (blue X’s) and ash pod (open green triangles) at AK-855 section (Fig. 4d and e). Also shown for reference is major element geochemistry of glass shards from the Old Crow ash (filled red circles) from Togiak Bay, Alaska (TB in Fig. 1b). (For interpretation of the references to color in this figure legend, the reader is referred to the web version of this article.)

The age of the Old Crow volcanic ash is not known with certainty, but estimates have been made from a variety of techniques and localities, yielding roughly similar ranges. Early isothermal plateau fission track ages range from 156±26 ka to 118±23 ka (Westgate, Reference Westgate1988; errors are 1σ). Preece et al. (Reference Preece, Pearce, Westgate, Froese, Jensen and Perkins2011) recalculated these ages to range from 148±43 ka to 113±22 ka. Berger (Reference Berger2003) reported bracketing, partial-bleach thermoluminescence ages of loess of 147±12 ka (below the Old Crow ash) and 128±22 ka (above the Old Crow ash). Auclair et al. (Reference Auclair, Lamothe, Lagroix and Banerjee2007) reported bracketing infrared stimulated luminescence (IRSL) ages of 135 ka (+21/−13 ka, below the ash) and 131 ka (+21/−13 ka, above the ash). Roberts (Reference Roberts2012) also conducted IRSL analyses of bracketing loesses around the Old Crow ash and reported that calculated ages are conditioned significantly by preheat temperatures in the laboratory. She therefore generated a suite of possible ages for the Old Crow ash, ranging from ~150 ka to ~100 ka, using different options for preheat temperatures. Considering all the attempts to date this ash, it is reasonable to say that the Old Crow ash is between ~150 ka and ~100 ka and is likely around ~130 ka. If so, then the section at AK-855 contains loess that is much older than at the other sections examined. This older loess, hosting the Old Crow tephra deposits, was likely deposited during the penultimate glacial period, equivalent to MIS 6. Nevertheless, snail ages near the top of the section (Fig. 5a) indicate that the latest episode of loess deposition was similar in timing to that of the latest deposition at the other sections. Tephra deposits were not found at the other sections (except possibly at section AK-600B, Fig. 5a), and the Old Crow ash, if present at other sections, is presumably stratigraphically below what is exposed. The presence of this ash near the surface at AK-855 implies erosional removal of much of the later (but not latest) part of the loess record at this locality.
Sedimentology
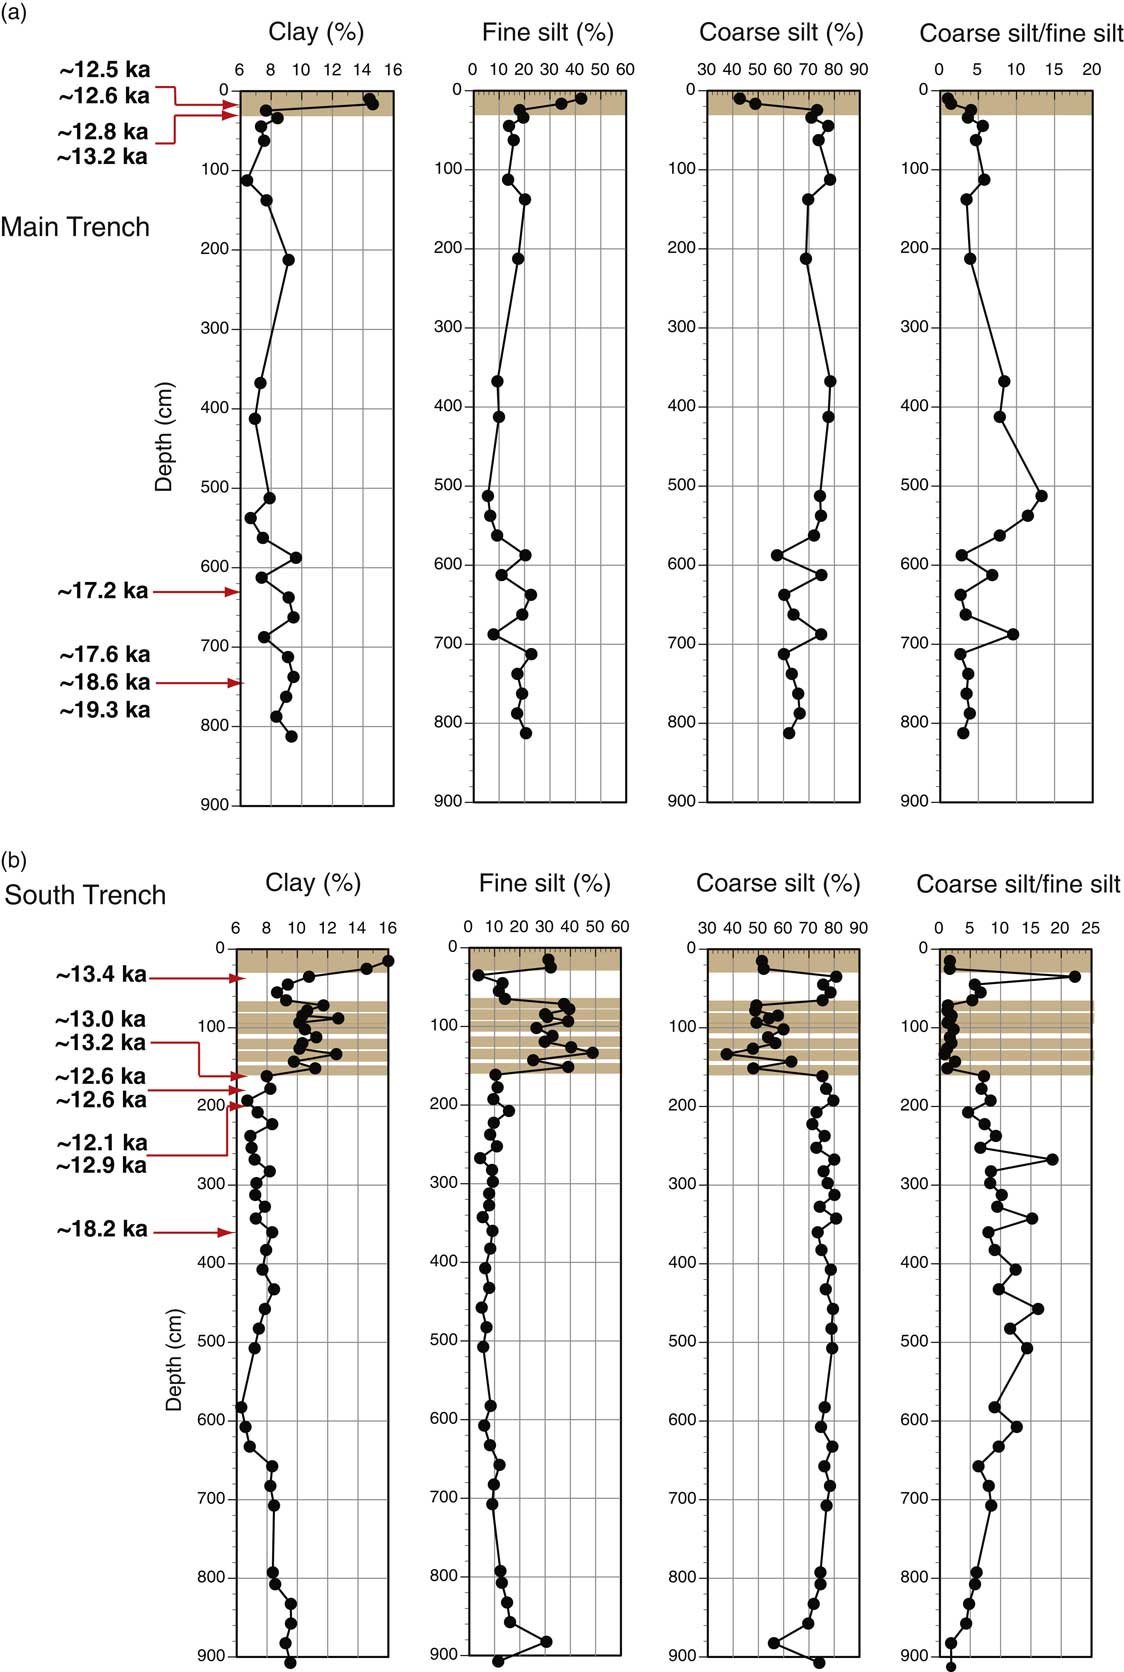
Loess from the western Yukon-Tanana Upland is dominated by silt-sized particles, consistent with loess deposits worldwide (see examples in Muhs, Reference Muhs2013). In unaltered parts of the sections studied here (i.e., where paleosols are not present), loess has coarse-silt (53–20 µm) contents of 55% to 80%, with loess at many depths having coarse-silt contents of 70% to 80% (Fig. 7). Despite the high coarse-silt content, sand (>53 µm) content is surprisingly low, usually less than 10%. Coarse-silt/fine-silt values are always greater than 2, usually greater than 5, and are sometimes higher than 10 (Fig. 7). These values are unusually high for loess deposits, and we discuss the significance of this later.
(a) Particle-size distribution of loess and modern soil at the Main Trench section (AK-601A in Figs. 2b and 5a). (b) Particle-size distribution of loess, paleosols, and modern soil at the South Trench section (AK-650A in Figs. 2b and 5a). Numbers in bold in both panels a and b are radiocarbon ages of land snails (upper parts of sections) and plant remains from peats (lower parts of sections); brown shades are modern soils and paleosols. (For interpretation of the references to color in this figure legend, the reader is referred to the web version of this article.)

Both clay-sized particles (<2 µm) and fine-silt-sized particles (20–2 µm) are enriched in modern soils and paleosols (Fig. 7) similar to loess found in the Fairbanks area (Muhs et al., Reference Muhs, Ager, Bettis, McGeehin, Been, Begét, Pavich, Stafford and Stevens2003b). Modern soils have clay contents as high as 14–16% and in paleosols, clay content is as high as 9–13%. In contrast, in unaltered loess, clay contents are less than 10%. Clay enrichment in soils can be attributable either to mechanical infiltration (illuviation) of fine particles from upper soil horizons to lower soil horizons or clay production by chemical weathering of primary silt-sized minerals. The enrichment of fine silt and clay in the same soil and paleosol horizons, as seen in our sections, can also be explained by slow eolian accretion of fine particles during pedogenesis (Muhs et al., Reference Muhs, Ager, Bettis, McGeehin, Been, Begét, Pavich, Stafford and Stevens2003b).
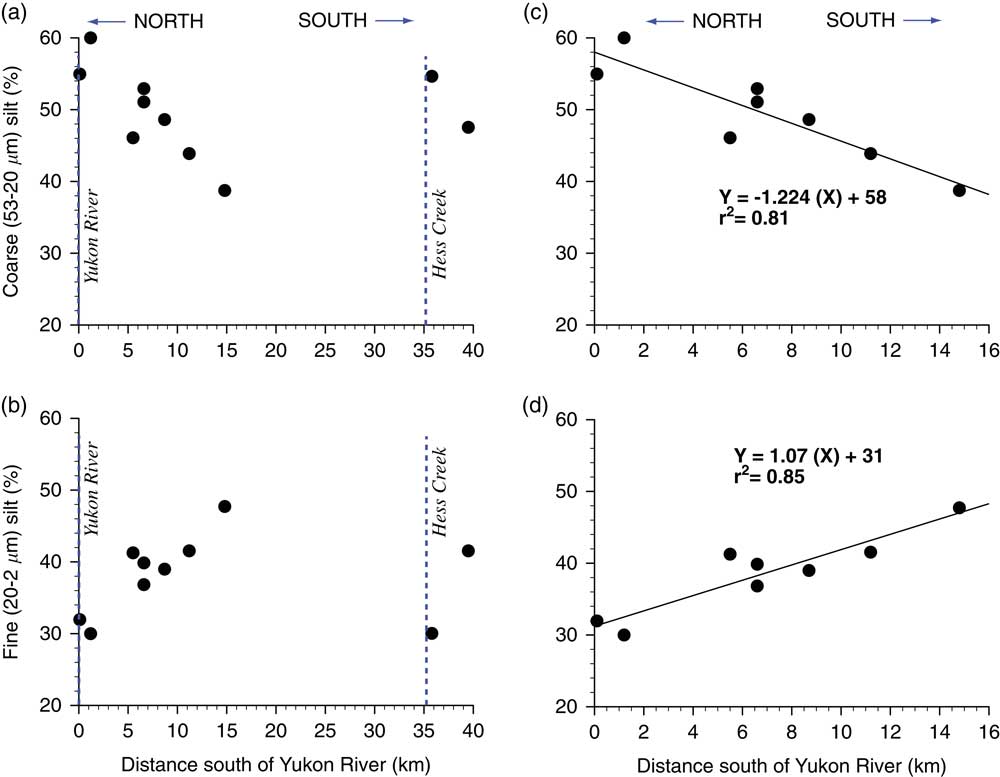
From approximately the same depths as our radiocarbon-dated snails, and below the modern soil zone, we sampled loess in a transect south of the Yukon River (Fig. 2b) for particle-size analyses. With the exception of the two southernmost localities, coarse silt in this 13–12 ka loess decreases, and fine silt increases as a function of distance south of the Yukon River in a linear fashion (Fig. 8), with high coefficients of determination (r 2=0.81 and 0.85, respectively). Similar distance-from-source trends have been well documented for loess in other localities (e.g., Muhs and Bettis, Reference Muhs and Bettis2000; Muhs et al., Reference Muhs, Bettis, Roberts, Harlan, Paces and Reynolds2013a) and are typically explained as a winnowing of coarse particles away from an alluvial source. It is noteworthy that the two southernmost localities, which do not fit these linear trends, are both south of Hess Creek (Fig. 2b), a major drainage south of the Yukon River. It is possible that Hess Creek served as a secondary source of loess, but this hypothesis requires more testing.
Coarse-silt and fine-silt contents in loess radiocarbon dated to ~13 ka to ~12 ka shown as a function of distance south of the Yukon River: all samples analyzed, with no regression equation computed (localities in Fig. 2b) (a, b); only localities north of Hess Creek, with regression equations and coefficients of determination computed (c, d). Note that sample point for AK-859 (~1.2 km south of the river) is average of several analyses, excluding one sample at ~30 cm depth with extraordinarily high coarse-silt content.

Mineralogy
The bulk mineralogy of Yukon-Tanana Upland loess was studied at four sections (AK-840, AK-855, the Main Trench [AK-601A], and the South Trench [AK-650A]). Mineralogy is similar in both the section north of the Yukon River (AK-840) and the three sections south of the river. Of the silicate minerals, quartz, plagioclase, K-feldspar, mica, chlorite, and amphibole are found at all depths in unaltered loess (i.e., above or below soils or paleosols). Mica, which appears to be mostly muscovite, is abundant and is easily visible under magnification or even to the naked eye in hand samples. Although the loess contains both K-feldspar and plagioclase, plagioclase is the more abundant of these two minerals based on XRD peak heights. Plagioclase and amphibole are represented in Na2O contents in unaltered loess of 1.5–2.7%; K-feldspar and mica contents are reflected in K2O contents of 1.1–2.0%. Chlorite and amphibole are seen in Fe2O3 concentrations of 3.9–5.0% (see Supplementary Table 1 for complete geochemical data).
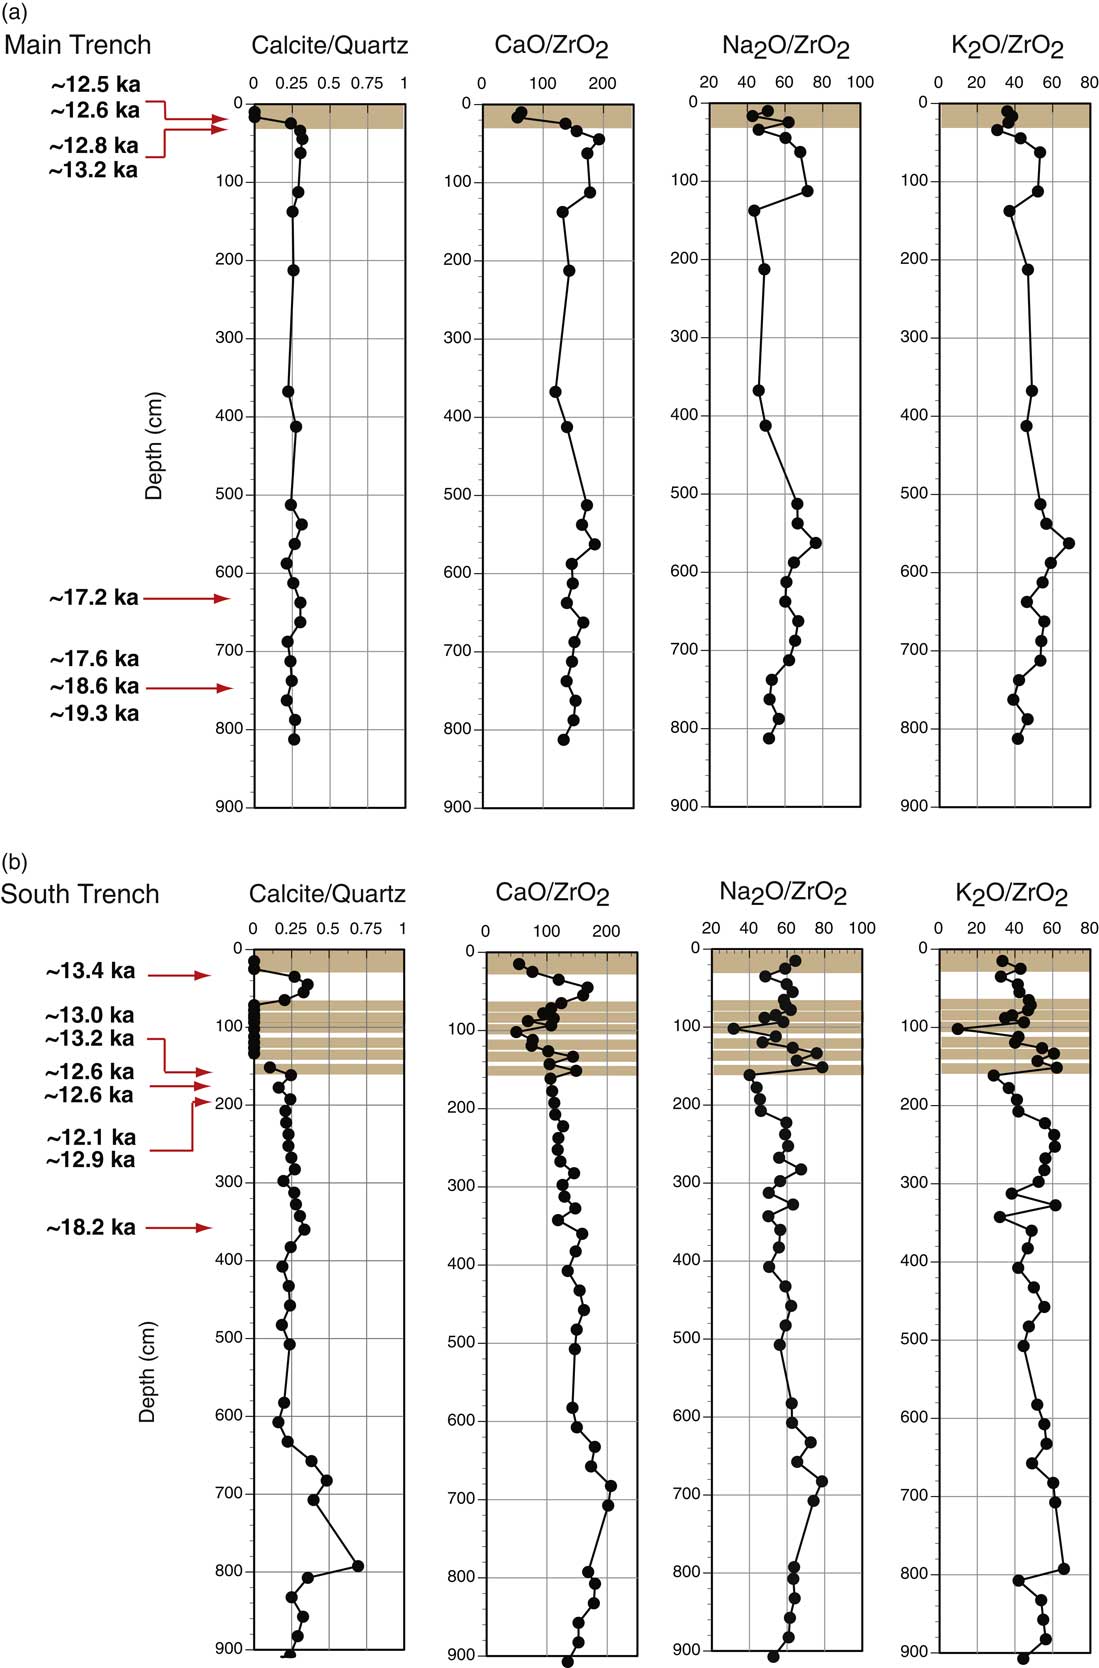
A major difference between loess studied here and loess along the Tanana River near Fairbanks is that Yukon-Tanana Upland loess has a much higher abundance of carbonate minerals, both calcite and dolomite. In both the Main Trench and South Trench, XRD peak-height ratios of calcite to quartz (29.4°2θ/20.9°2θ) and CaO/ZrO2 vary sympathetically with depth (Fig. 9). From both calcite/quartz and CaO/ZrO2 values, it is apparent that calcite is largely depleted in the modern soil in the upper parts of both sections and in the paleosols found in the South Trench. Values of Na2O/ZrO2 K2O/ZrO2 show that plagioclase and mica/K-feldspar, respectively, may have experienced some depletion in the modern soils and paleosols, but not to the degree that carbonate minerals have experienced.
Calcite/quartz values, CaO/ZrO2, Na2O/ZrO2, and K2O/ZrO2 of loess, paleosols, and modern soil at the Main Trench (a) and South Trench (b) sections. Calcite/quartz are relative values only (not weight percent ratios), taken from X-ray diffractometry peak heights of quartz (20.9°) and calcite (29.4°). For both sections, numbers in bold are calibrated radiocarbon ages of land snails (upper parts of sections) and plant remains from peats (lower parts of sections); brown shades are modern soils and paleosols. Note that the modern soil A horizon in the Main Trench is not plotted because it is believed to have been contaminated by carbonate-rich road dust. (For interpretation of the references to color in this figure legend, the reader is referred to the web version of this article.)

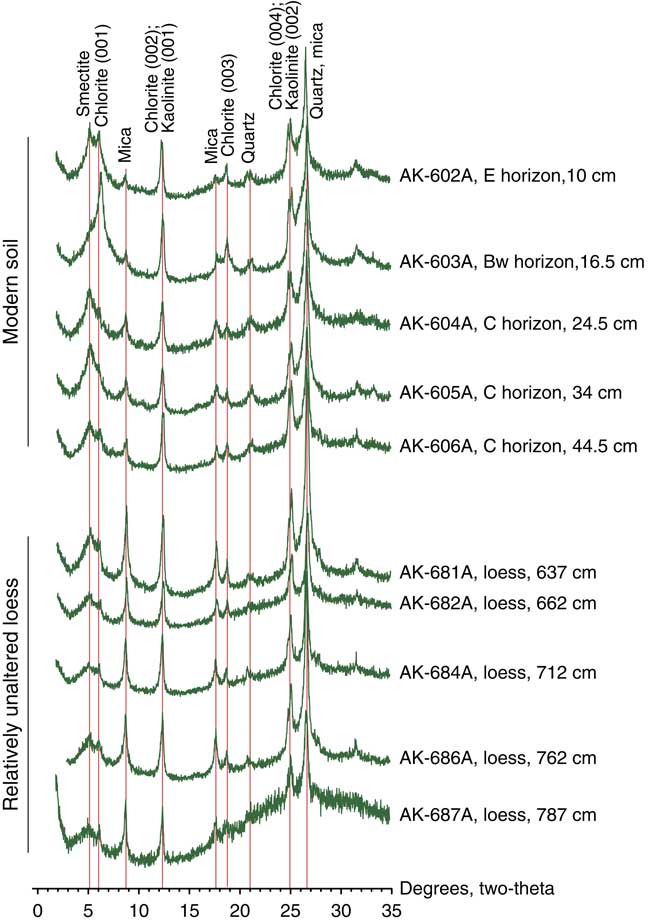
The clay mineralogy of loess along the Yukon-Tanana Upland loess is very similar to the clay mineralogy of loess near Fairbanks, reported by Muhs et al. (Reference Muhs, Ager, Skipp, Beann, Budahn and McGeehin2008a). In the Main Trench section, relatively unaltered loess at depths of 600–800 cm contains smectite, chlorite, mica, kaolinite, and possibly clay-sized quartz (Fig. 10). For chlorite, the (001) and (003) peaks are less intense than the (002) and (004) peaks on glycolated scans, which could indicate that the chlorite is Fe-rich. It is difficult to be certain about this, however, as kaolinite has (001) and (002) peaks that coincide with the chlorite (002) and (004) peaks. After heating to 550°C, the (002) and (004) peaks for chlorite are greatly diminished or disappear, meaning that peaks in these positions could be attributable at least partially to kaolinite. Mica in the modern soil shows some depletion compared with unaltered loess, based on peak heights (Fig. 10). This is consistent with the lower K2O/ZrO2 values also seen in the modern soil (Fig. 9). In the South Trench, relatively unaltered loess at depths of ~80 cm to ~140 cm has a clay mineralogy similar to that of deeper loess in the Main Trench.
(color online) Selected X-ray diffractograms of glycolated samples of the modern soil and loess from the Main Trench (AK-601A; Fig. 3), showing major clay minerals present.

Geochemistry and loess provenance
In order to determine the primary source or sources of loess in the Yukon-Tanana Upland, we calculated key element ratios that can differentiate alluvial silts from different river systems in the region. Given the generally east–west orientation of the major loess bodies in central Alaska, including the Yukon-Tanana Upland and Yukon Flats areas (Fig. 2a), we consider that east–west trending valleys of the Yukon and Tanana Rivers are the most likely sources. Muhs and Budahn (Reference Muhs and Budahn2006) reported that Cr/Sc, Th/Ta, As/Sb, and Zr/Hf, as well as Eu/Eu* and LaN/YbN, define distinct compositional fields for silt-sized (53–2 µm) particles in these two river systems. Some of these element ratios were also used to distinguish different alluvial sources for loess in the Matanuska Valley and in Wrangell–St. Elias National Park areas (Fig. 1b) of southern Alaska (Muhs et al., Reference Muhs, Budahn, McGeehin, Bettis, Skipp, Paces and Wheeler2013b, Reference Muhs, Budahn, Skipp and McGeehin2016a).
In addition to the trace elements used by Muhs and Budahn (Reference Muhs and Budahn2006), we investigated the use of K/Rb, K/Ba, and K/Cs as provenance indicators. The trace elements Rb, Ba, and Cs all substitute for K in K-bearing minerals such as mica and K-feldspar, both of which are present in Yukon-Tanana Upland loess. Muhs et al. (Reference Muhs, Bettis, Aleinikoff, McGeehin, Beann, Skipp, Marshall, Roberts, Johnson and Benton2008b, Reference Muhs, Budahn, McGeehin, Bettis, Skipp, Paces and Wheeler2013b) found that K/Rb and Ba/Rb values have the ability to discriminate loess bodies derived from different sources in both midcontinental North America and Alaska. In a recent study, Muhs et al. (Reference Muhs, Lancaster and Skipp2016b) used K/Rb and K/Ba to distinguish competing source sediments for dune sand in southern California. Because K, Rb, Ba, and Cs can all be mobile in near-surface environments and in soils, we restrict our use of these elements to deep, unaltered loess, well below modern soils and paleosols, and modern, unweathered alluvium.
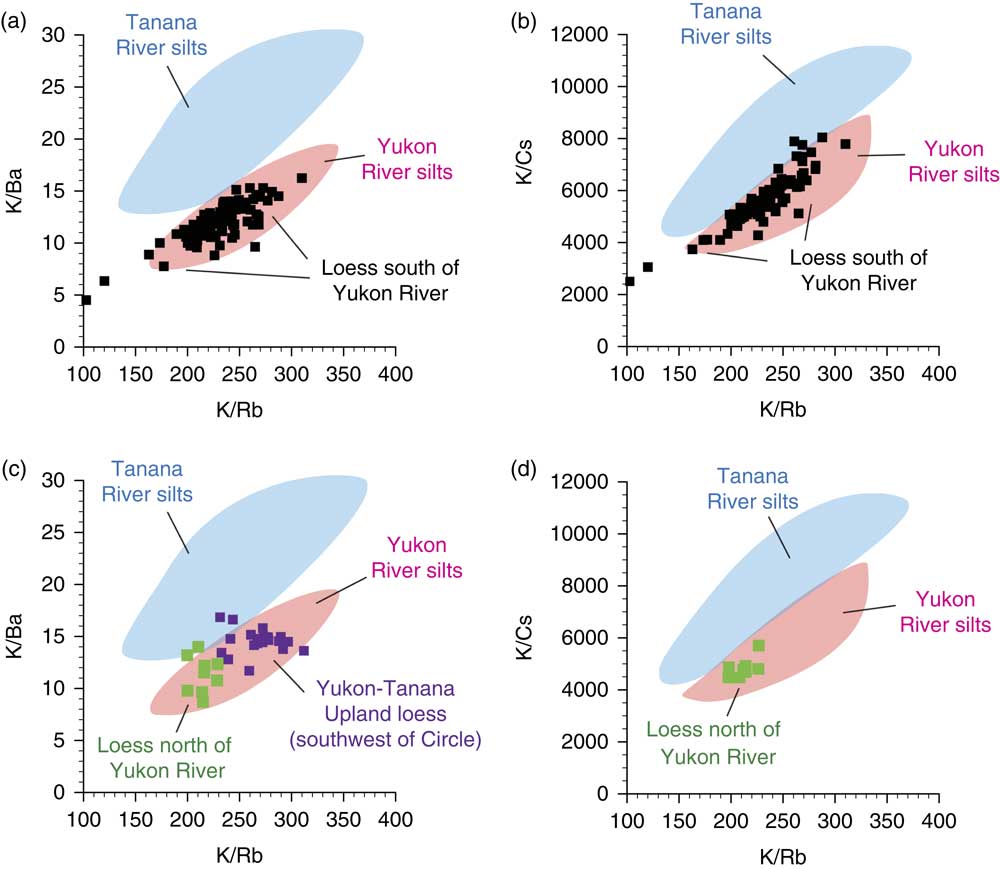
In the present study, we determined K, Rb, Ba, and Cs concentrations of the same alluvial samples studied by Muhs and Budahn (Reference Muhs and Budahn2006), from sample localities shown in Figure 2a. Results indicate that in K/Rb versus K/Ba and K/Rb versus K/Cs plots, Yukon River valley silts and Tanana River valley silts define distinctive fields (Fig. 11a and b). Yukon-Tanana Upland loess samples, from sections south of the Yukon River (localities AK-601A, AK-650A, and AK-855 in Fig. 2b), fall largely within the Yukon River valley silts field for K/Rb versus K/Ba and mostly within that field for K/Rb versus K/Cs (Fig. 11a and b). Loess from Yukon Flats, north of the Yukon River (locality AK-840 in Fig. 2b), also falls mostly within the Yukon River valley silts field. For Yukon-Tanana Upland loess collected southwest of Circle (Fig. 2a; specific localities are given in Muhs et al., Reference Muhs, Ager, Bettis, McGeehin, Been, Begét, Pavich, Stafford and Stevens2003b), we have data on K/Rb and K/Ba derived from energy-dispersive X-ray fluorescence. All but two of these samples also fall within the Yukon River valley silts field. Because all these elements reflect compositions of K-feldspar and muscovite, they represent a substantial portion of the light, silicate mineral fraction in loess.
K/Rb versus K/Ba values in Tanana River and Yukon River silts (blue and pink shaded zones, respectively) (a) and K/Rb versus K/Cs values in Tanana River and Yukon River silts (shaded zones) (b) compared with same values in Yukon-Tanana Upland loess samples from south of the Yukon River (localities AK-601A, AK-650A, and AK-855, unaltered loess only), shown as filled black squares. K/Rb versus K/Ba values in Tanana River and Yukon River silts (shaded zones) (c) and K/Rb versus K/Cs values in Tanana River and Yukon River silts (shaded zones) (d) compared with same values in Yukon Flats loess samples north of the Yukon River (locality AK-840, unaltered loess only), shown as filled green squares. Also shown in panel c are K/Rb and K/Ba values in Yukon-Tanana Upland loess southwest of Circle, Alaska (Fig. 2a); note that these values were obtained by energy-dispersive X-ray fluorescence. (For interpretation of the references to color in this figure legend, the reader is referred to the web version of this article.)

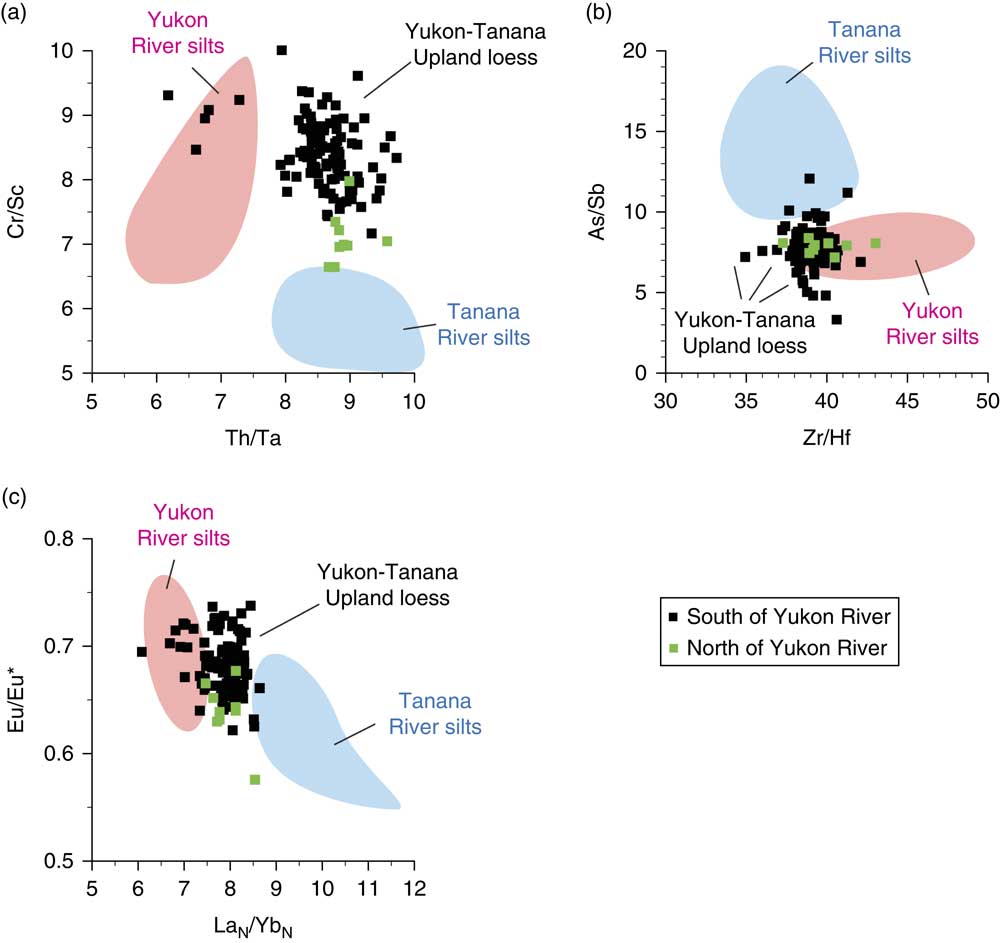
Cr/Sc and Th/Ta values represent trace element compositions of a broad suite of minerals, including micas, amphiboles, and clay minerals, whereas As/Sb and Zr/Hf represent compositions of specific heavy minerals, magnetite (Onishi and Sandell, Reference Onishi and Sandell1955) and zircon, respectively. These four element ratios show distinct fields for Yukon River valley silts and Tanana River valley silts (Fig. 12a and b). Both Yukon-Tanana Upland loess (south of the Yukon River) and Yukon Flats loess (north of the Yukon River) plot between the two alluvial fields for Th/Ta versus Cr/Sc (Fig. 12a). For Zr/Hf versus As/Sb, most loess samples plot within or near the Yukon River valley silts field (Fig. 12b).
Ranges of Th/Ta versus Cr/Sc (a), Zr/Hf versus As/Sb (b), and LaN/YbN versus Eu/Eu* (c) in Tanana River valley and Yukon River valley silts (shaded zones). Also shown are values of these ratios in Yukon-Tanana Upland loess (black squares, localities AK-601A, AK-650A, and AK-855) south of the Yukon River and Yukon Flats loess (green squares, locality AK-840) north of the Yukon River. Ranges of values for all river silts are from Muhs and Budahn (Reference Muhs and Budahn2006). (For interpretation of the references to color in this figure legend, the reader is referred to the web version of this article.)

The REEs represent compositions of a broad range of minerals including micas, chlorite, clay minerals, amphiboles, zircon, feldspars (in small amounts), and apatite. LaN/YbN is a measure of the ratio of light REEs to heavy REEs. The Eu/Eu* value is a measure of the magnitude of the Eu anomaly (see Taylor and McLennan, Reference Taylor and McLennan1985). These REE ratios show distinctive compositional fields for Yukon River valley and Tanana River valley silts for LaN/YbN versus Eu/Eu* (Fig. 12c). Both Yukon-Tanana Upland loess (south of the Yukon River) and Yukon Flats loess (north of the Yukon River) samples fall mostly between the two alluvial compositional fields for LaN/YbN versus Eu/Eu*, with a number of samples falling clearly within the Yukon River valley silts field.
DISCUSSION
Timing of loess deposition along the Yukon River
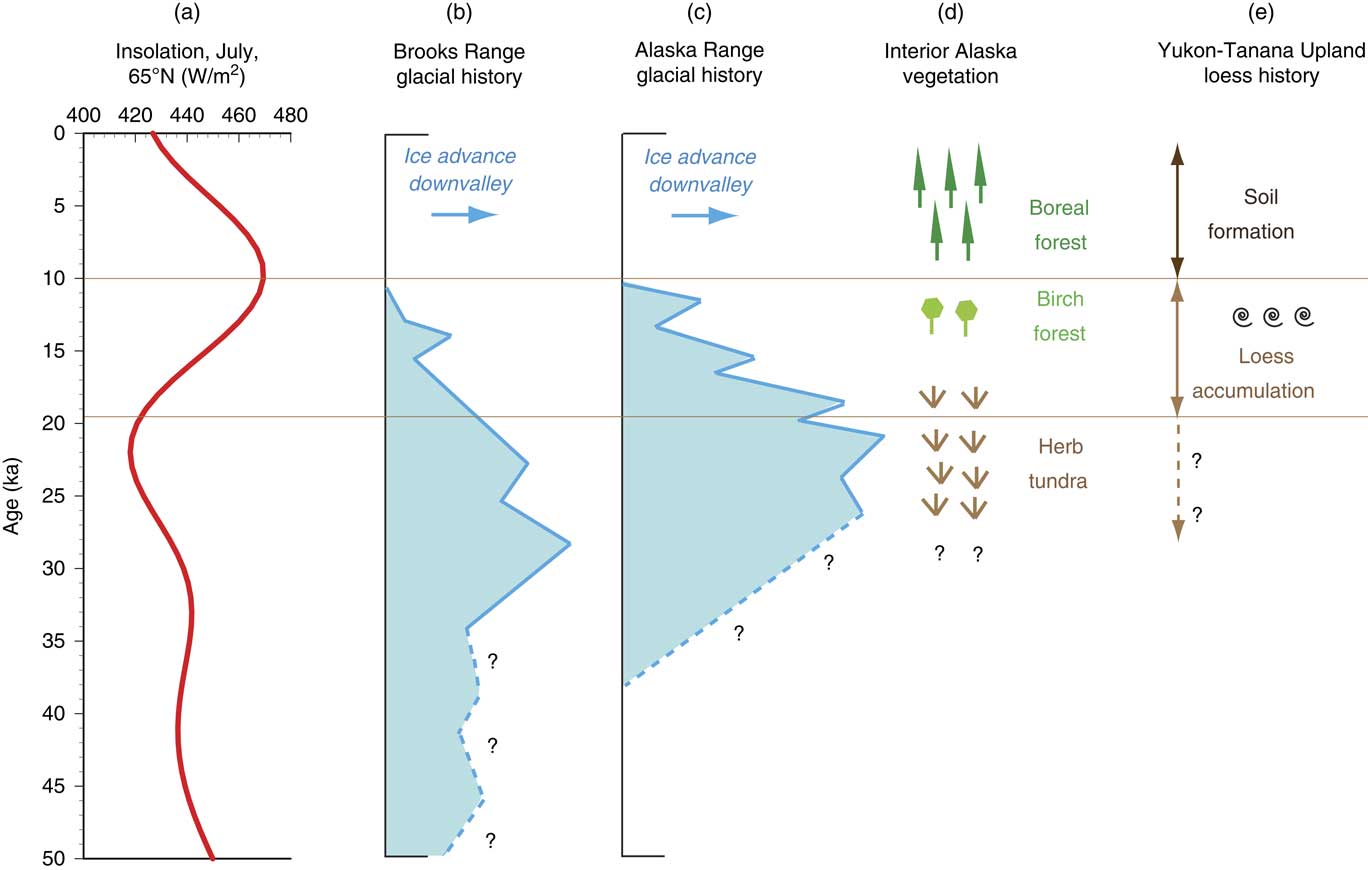
As discussed previously, in contrast to the midcontinent of North America, reports of last-glacial-aged loess in Alaska are rare, and the deposits are thin, poorly dated, or simply interpreted to exist from deposits in a favorable stratigraphic position without direct dating. Results presented here document one of the first dated records of loess accumulation during the last glacial period in central Alaska. It is not certain when loess accumulation began during the last glacial period on the western Yukon-Tanana Upland. If the radiocarbon ages of plant remains from peat deposits within the sections exposed at AK-601A and AK-650A are accurate, these data indicate that loess accumulation certainly was in progress by ~19–18 ka. By this time, glaciers in both the Brooks Range and Alaska Range had already reached their maximum downvalley positions of the last glacial period and had begun retreating (Fig. 13). However, ice was still much more extensive than present in both mountain ranges until ~11 ka. Consistent with the glacial record, loess accumulation continued until at least ~13–12 ka or shortly thereafter, based on radiocarbon ages of snails from the same two sections where the older ages are found, as well as a number of other sections examined both to the north and south of the Yukon River (Fig. 5a). Based on measurements made in the Main Trench, ~7 m of loess accumulated between ~19 ka and ~13 ka (Fig. 5), demonstrating significant eolian silt deposition during this ~6 ka period. A lack of paleosols in this section indicates that loess sedimentation was more or less continuous over the period between ~19 ka and ~13 ka, supported by the fact that calcite and dolomite are present at all depths, indicating that there was no hiatus long enough to bring about complete leaching. At the South Trench, an age of ~19.2 ka also indicates that loess accumulation was in progress during the last glacial period and continued until 13–12 ka. The presence of numerous paleosols between ~70 cm and ~160 cm in the South Trench is interpreted to indicate episodic slope instability during the latest phases of loess accumulation. The cessation of loess accumulation shortly after ~13–12 ka may be in part attributable to a reduction in glacial silt supplies as ice receded in both the Brooks Range and Alaska Range, mountains that are drained by the Yukon and Tanana Rivers.
(color online) Comparison of geologic records in Alaska over the past 50 ka. (a) Insolation at the top of the atmosphere in July at 65°N (from Berger and Loutre, Reference Berger and Loutre1991). Time-distance diagrams of Brooks Range (b) and Alaska Range (c) glaciers, constrained by calibrated radiocarbon and cosmogenic ages, dashed where uncertain (redrawn from Briner and Kaufman, Reference Briner and Kaufman2008). (d) Vegetation history of interior Alaska, generalized from Anderson and Brubaker (Reference Anderson and Brubaker1994), Edwards and Barker (Reference Edwards and Barker1994), Edwards et al. (Reference Edwards, Anderson, Brubaker, Ager, Andreev, Bigelow and Cwynar2000, Reference Edwards, Grosse, Jones and McDowell2016), and Bigelow et al. (Reference Bigelow, Brubaker, Edwards, Harrison, Prentice, Anderson and Andreev2003). (e) History of loess accumulation and soil formation in the Yukon-Tanana Upland (this study).

At other localities, not enough chronological data are available to ascertain the amount of loess that accumulated solely during the last glacial period. Nevertheless, similar radiocarbon ages near the tops of all sections studied show that loess sedimentation continued until approximately the same time (~13 ka to ~12 ka) during the very latest part of the last glacial period. Based on the identification of the Old Crow tephra deposits at locality AK-855 (Figs. 4 and 6), loess also accumulated in this area during the penultimate glacial period (MIS 6), based on estimated ages of this widespread stratigraphic marker.
Role of vegetation in loess accumulation
As mentioned earlier, Muhs et al. (Reference Muhs, Ager, Bettis, McGeehin, Been, Begét, Pavich, Stafford and Stevens2003b), following Tsoar and Pye (Reference Tsoar and Pye1987), proposed that vegetation plays a key role in loess accumulation, with forest being a more efficient dust trap than grassland or tundra. Understanding Alaska’s vegetation history from fossil pollen studies is critical to assessing this hypothesis. Reconstruction of past vegetation from pollen data for interior Alaska indicates that the dominant vegetation at ~21–17 ka was graminoid and forb tundra (Anderson and Brubaker, Reference Anderson and Brubaker1994; Edwards et al., Reference Edwards, Anderson, Brubaker, Ager, Andreev, Bigelow and Cwynar2000; Bigelow et al., Reference Bigelow, Brubaker, Edwards, Harrison, Prentice, Anderson and Andreev2003). Specifically for the Yukon Flats area, pollen data from a lake record (Sands of Time Lake [66.030°N, 147.548°W], an informal name) indicate that during full-glacial time (~21–17 ka), vegetation was characterized by abundant Poaceae (grasses), Cyperaceae (sedges), Chenopodiaceae (chenopods), and other herbaceous taxa (Edwards and Barker, Reference Edwards and Barker1994). Furthermore, Edwards and Barker (Reference Edwards and Barker1994) note that at this time, pollen accumulation rates were very low, which they interpret to mean a landscape that was very sparsely vegetated. By ~13 ka, however, herb tundra had diminished and birch (Betula) had arrived in the area, with poplar (Populus) becoming abundant by ~12 ka to ~10 ka, and finally spruce (Picea) and alder (Alnus) arriving at ~10 ka and ~9 ka, respectively (Edwards and Barker, Reference Edwards and Barker1994; Edwards et al., Reference Edwards, Grosse, Jones and McDowell2016). It is important to note here that an apparent rise in Betula pollen earlier in the record (starting at ~20 ka, with up to 50% Betula pollen between ~18 ka and ~14 ka) at Sands of Time Lake, previously reported by Lamb and Edwards (Reference Lamb and Edwards1988) and Edwards and Barker (Reference Edwards and Barker1994), is now interpreted to be attributable to reworking of older grains (Edwards et al., Reference Edwards, Grosse, Jones and McDowell2016).
If the radiocarbon ages from deep within the Main Trench (~18.6 ka and ~17.2 ka) are accurate, these data imply that loess accumulation was in progress during the last glacial period, likely under an herb tundra vegetation until ~13 ka, when birch arrived in the Yukon Flats area. The radiocarbon ages of ~13 ka to ~12 ka for land snails at shallow depths in our sections indicate that loess accumulation was nearing its end at about the time of birch arrival in the Yukon Flats area. The accumulation of loess under an herb tundra vegetation (with its low roughness height) and its termination with the arrival of birch (with a higher roughness height) is completely contrary to the hypothesis proposed by Muhs et al. (Reference Muhs, Ager, Bettis, McGeehin, Been, Begét, Pavich, Stafford and Stevens2003b). Thus, although it is based on sound aerodynamic considerations presented by Tsoar and Pye (Reference Tsoar and Pye1987), the hypothesis of vegetation control on loess accumulation proposed by Muhs et al. (Reference Muhs, Ager, Bettis, McGeehin, Been, Begét, Pavich, Stafford and Stevens2003b) may need revision. On the other hand, it is possible that the arrival of birch in the region at ~13 ka may have stabilized river floodplains, such that sediment availability in the source valleys was diminished, which would explain the termination of loess accumulation.
The presence of snails in significant concentrations in only the upper part of the Yukon-Tanana Upland loess differs from loess of midcontinental North America, where snails are found throughout the depths of last-glacial-aged Peoria Silt (see examples in Pigati et al., Reference Pigati, McGeehin, Muhs and Bettis2013, Reference Pigati, McGeehin, Muhs, Grimley and Nekola2015). Previously, we noted that the snails in the Yukon-Tanana Upland and Yukon Flats loess could be Succinea strigata, as identified by Williams (Reference Williams1962) in loess elsewhere in the area. Based on localities given in Pilsbry (Reference Pilsbry1948), this species has a modern distribution that spans a range of high-latitude climate and vegetation zones, including coastal forest in southeastern Alaska, boreal forest in interior Alaska and Yukon Territory, cottonsedge tundra and watersedge tundra in western Alaska, and Aleutian heath in the Aleutian Islands. Over this suite of biomes, mean July temperatures range from ~8°C to ~16°C. Thus, it does not seem likely that a change in summer temperatures was a likely cause for the arrival of S. strigata in the Yukon-Tanana Upland. It is possible that at the close of the last glacial period, when herb tundra gave way to birch forest and boreal forest (Edwards and Barker, Reference Edwards and Barker1994), increased moisture played a role in providing a more favorable environment for the presence of S. strigata.
Although most fossil snails examined were found close to the modern land surface, there is a small but measurable amount of loess above most of them and below the modern soil profile. The modern soil profiles appear to have developed within this thin loess, which was apparently deposited after ~13–12 ka. Modern soils at all localities examined have O/E/Bw/C or A/E/Bw/C profiles and are classified as Typic Cryochrepts. The presence of an E horizon in these soils is significant, as it indicates that the soils likely developed primarily under boreal forest. Holocene soils that develop under either coastal forest or boreal forest in Alaska have E horizons, whereas those developed under shrub tundra or herb tundra typically do not (see examples in Muhs et al., Reference Muhs, Ager, Been, Rosenbaum and Reynolds2000; an exception is the development of E horizons under acidic tundra in the Talkeetna Mountains of southern Alaska). Thus, given the time of arrival of Picea and other boreal forest taxa in the area (Anderson and Brubaker, Reference Anderson and Brubaker1994; Edwards et al., Reference Edwards, Grosse, Jones and McDowell2016), the modern soils likely developed their present morphologies no earlier than ~10 ka.
Differences in loess stratigraphic records of central Alaska
A major stratigraphic difference between the loess sections observed along the Yukon River and those in the Fairbanks area is the lack of evidence for significant Holocene loess in the Yukon-Tanana Upland. In the Fairbanks area, radiocarbon dating has established that 1–4 m of loess accumulated at a number of sites in the area during the Holocene (Péwé, Reference Péwé1975b; Hamilton et al., Reference Hamilton, Craig and Sellmann1988; Begét, Reference Begét1990; Muhs et al., Reference Muhs, Ager, Bettis, McGeehin, Been, Begét, Pavich, Stafford and Stevens2003b). Because only very thin loess is found above the snails dated ~13 ka to ~12 ka in the Yukon-Tanana Upland, it could be argued that no Holocene loess was deposited at all in the area (although see locality Q of Froese et al., Reference Froese, Smith and Clement2005). It is possible that this difference is related to glacial supplies. Although they were much larger and extended farther downvalley during the last glacial period, there are still extensive glaciers in the Alaska Range (Fig. 1b). Many of the rivers and streams that drain the north side of this mountain range are tributaries to the Tanana River (Fig. 2a), whose valley is the primary source of loess in the Fairbanks area (Muhs and Budahn, Reference Muhs and Budahn2006). Thus, glaciogenic silt is still available from the Tanana River valley and its tributaries that drain the Alaska Range. In contrast, although glaciers were extensive on the south side of the Brooks Range during the last glacial period (Hamilton, Reference Hamilton1982; Kaufman et al., Reference Kaufman, Manley, Ager, Axford, Balascio, Begét and Brigham-Grette2004; Briner and Kaufman, Reference Briner and Kaufman2008), those that still exist in these mountains are much smaller and mostly limited to the northeastern part of the range. Thus, although glaciogenic silt supplies are still delivered in abundance to the Tanana River, such supplies are far more limited in the Yukon River drainage basin.
Sources of loess in the western Yukon-Tanana Upland
Given the proximity of Yukon-Tanana Upland loess to the Yukon River, it might seem obvious that the valley of this river must be the major source of the loess. Nevertheless, previous studies have shown that elsewhere in Alaska, loess sources are complex and not always so easily identified. For example, in the Fairbanks area, although the nearby Tanana River valley was a major source of Pleistocene loess, the Yukon River valley was also a contributor and even the Nenana River valley made contributions (Muhs and Budahn, Reference Muhs and Budahn2006). In southern Alaska, it would be easy to assume that both the Matanuska River valley and Knik River valley are sources for loess in the Matanuska Valley, as both river systems are upwind of the major loess body in this valley. Yet, geochemical data show that the Knik River valley actually makes only minor contributions, if any, to the loess (Muhs et al., Reference Muhs, Budahn, Skipp and McGeehin2016a).
Recognizing that a complex origin is possible, particle-size data do support an interpretation that Yukon River valley sediments were important to the accumulation of loess in the Yukon-Tanana Upland. Ratios of coarse silt to fine silt have been commonly employed as a measure of wind strength, with applications to loess history in Europe, Asia, and North America (e.g., Rousseau et al., Reference Rousseau, Sima, Antoine, Hatté, Lang and Zöller2007; Machalett et al., Reference Machalett, Oches, Frechen, Zöller, Hambach, Mavlyanova, Markovic and Endlicher2008; Antoine et al., Reference Antoine, Rousseau, Fuchs, Hatté, Gauthier, Markovic, Jovanovic, Gaudenyi, Moine and Rossignol2009; Muhs et al., Reference Muhs, Budahn, McGeehin, Bettis, Skipp, Paces and Wheeler2013b). Such measures are referred to as “grain size indexes” (GSI) or “U-ratios,” and although the specific size cutoffs vary somewhat from study to study, all of them are basically measures of the coarse-silt fraction to the fine-silt fraction. In these studies, such ratios are almost always less than 5 and usually less than 3. Below the modern soil and shallow paleosols in both the Main Trench and South Trench, coarse-silt/fine-silt values (Fig. 7) are much higher than those reported in last-glacial loess sequences in Germany, Serbia, and Kazakhstan (Rousseau et al., Reference Rousseau, Sima, Antoine, Hatté, Lang and Zöller2007; Machalett et al., Reference Machalett, Oches, Frechen, Zöller, Hambach, Mavlyanova, Markovic and Endlicher2008; Antoine et al., Reference Antoine, Rousseau, Fuchs, Hatté, Gauthier, Markovic, Jovanovic, Gaudenyi, Moine and Rossignol2009). The Alaskan coarse-silt/fine-silt values are as high as 13 (Main Trench) and 22 (South Trench) and in general are closer to those found in loess at Loveland, Iowa, where a thick (~40 m), last-glacial loess accumulation is situated within a kilometer of its Missouri River valley source (Muhs and Bettis, Reference Muhs and Bettis2000; Muhs et al., Reference Muhs, Bettis, Roberts, Harlan, Paces and Reynolds2013a). From this, we infer that the primary loess source for the Yukon-Tanana Upland was likely nearby and/or that winds were strong in this region during the time of eolian silt transport. Further, particle-size data acquired along a transect to the south of the Yukon River show a distinct decrease in coarse silt and increase in fine silt in a southward direction (Fig. 8), at least until one reaches Hess Creek, a possible local source of loess (Fig. 2b). This again implies a source to the north, the most obvious of which is the Yukon River valley.
Mineralogy also provides an assessment of possible sources of Yukon-Tanana Upland loess. Based on bulk silicate mineralogy (quartz, plagioclase, K-feldspar, mica, amphibole, and chlorite), either the Yukon River valley, the Tanana River valley, or both valleys could be sources of loess. Similarly, clay mineralogy of alluvium from the two river valleys does not differ significantly (see fig. 9 of Muhs et al., Reference Muhs, Ager, Skipp, Beann, Budahn and McGeehin2008a) and the clay mineralogy of Yukon-Tanana Upland loess (Fig. 10) would permit an interpretation of contributions from either river valley. Carbonate minerals, both calcite and dolomite, are present in loess on the Yukon-Tanana Upland, unlike most Fairbanks area loess (Fig. 9). Muhs et al. (Reference Muhs, Ager, Skipp, Beann, Budahn and McGeehin2008a) interpreted the lack of carbonates in Fairbanks area loess to be attributable to syndepositional leaching. Although modern alluvial silts in both the Tanana River valley and Yukon River valley both contain calcite and dolomite, overall, the abundance of carbonate minerals is higher in modern Yukon River valley sediments (~10%) compared with Tanana River valley sediments (~3%), based on analyses by Eberl (Reference Eberl2004). Values of CaO content and CaO/ZrO2 in alluvial silts from these river valleys reported by Muhs and Budahn (Reference Muhs and Budahn2006) and Muhs et al. (Reference Muhs, Ager, Skipp, Beann, Budahn and McGeehin2008a) are consistent with Eberl’s (Reference Eberl2004) findings. Concentrations of CaO in Tanana River valley silts range from 3.3 to 6.0, whereas in the Yukon River valley, alluvial silts have CaO concentrations that range from 6.4 to 10.1 (see Supplementary Table 2). Values of CaO/ZrO2 in Tanana River valley silts range from 47 to 127 (mean of 93), whereas these values in Yukon River valley silts range from 91 to 354 (mean of 185). In Yukon-Tanana Upland loess, below the modern soil, CaO/ZrO2 values in the Main Trench range from 132 to 192 (Fig. 9). In the South Trench, CaO/ZrO2 values (excluding the modern soil and paleosols) range from 106 to 206 and below a depth of ~2 m, values are no lower than 114. These observations imply that even if some syndepositional leaching had occurred, the higher carbonate contents and higher CaO/ZrO2 values in Yukon-Tanana Upland loess require a significant Yukon River valley contribution.
Finally, geochemical methods also provide a means of distinguishing loess sources. Values of K/Rb, K/Ba, and K/Cs, representing K-feldspar and mica, define nonoverlapping geochemical fields for Yukon River valley silts and Tanana River valley silts (Fig. 11). Loess from the Yukon-Tanana Upland falls almost wholly within the Yukon River valley fields for these ratios, indicating that this fluvial system is a significant loess source. Geochemical indicators of the heavy mineral fraction, Zr/Hf (zircon) and As/Sb (magnetite), also support a Yukon River valley source, although there is more variability. Other geochemical indicators, however, such as Th/Ta and Cr/Sc, permit an interpretation of some Tanana River valley contributions as well as Yukon River valley contributions (Fig. 12). Furthermore, although LaN/YbN versus Eu/Eu* values show clearly defined fields for the two river sources, Yukon-Tanana Upland loesses fall between the two geochemical fields for the river valleys. We conclude from all the geochemical data that although the Yukon River valley is likely the most important source for Yukon-Tanana Upland loess, it cannot be the only source. Geochemical data permit an interpretation of at least some eolian input of Tanana River valley–derived sediments to the Yukon-Tanana Upland. Particle transport from the Tanana River valley to the Yukon-Tanana Upland would occur over a significantly greater distance than transport from the Yukon River valley (Fig. 2a). Because of this greater transport distance, we suspect that the component of Yukon-Tanana Upland loess derived from the Tanana River is largely in the fine-silt (20–2 µm) and clay (<2 µm) fractions. This hypothesis could be tested easily with geochemical analyses of different particle-size classes.
Paleoclimatic considerations
Identification of the Yukon River valley as the primary source of last-glacial loess to the Yukon-Tanana Upland supports the inference of northeasterly paleowinds in interior Alaska by Hopkins (Reference Hopkins1982) and Lea and Waythomas (Reference Lea and Waythomas1990), based on eolian sand records. If, however, as the geochemical data indicate, the Tanana River valley was an additional contributing source to loess on the Yukon-Tanana Upland, then it is necessary to consider the paleoclimatic conditions that would bring about dual loess sources. Because the western Yukon-Tanana Upland is situated between the two river valleys, the implications of our findings are that winds that transported silt came at times from the north and at other times came from the south.
Muhs and Budahn (Reference Muhs and Budahn2006), in interpreting multiple sources of loess in the Fairbanks area, proposed that katabatic winds in Alaska’s mountain ranges could have brought about opposing paleowinds in the past. Katabatic winds are strong, gravity-driven, downslope winds caused by nocturnal surface cooling (Barry, Reference Barry1992). They are best known from the large ice sheets of Greenland and Antarctica but can occur in much more local environments as well (see examples in Barry, Reference Barry1992). Schaetzl and Attig (Reference Schaetzl and Attig2013) provide evidence that last-glacial-aged loess accumulation in some parts of the North American midcontinent was influenced by katabatic winds coming off the Laurentide Ice Sheet. Thorson and Bender (Reference Thorson and Bender1985), Guthrie (Reference Guthrie1990), Muhs et al. (Reference Muhs, Ager, Bettis, McGeehin, Been, Begét, Pavich, Stafford and Stevens2003b), and DiPietro et al. (Reference DiPietro, Driese, Nelson and Harvill2017) have all inferred that such winds could have played a role in silt particle entrainment during the last glacial period in Alaska. In both the Brooks Range and the Alaska Range, glaciers advanced to downvalley positions, compared with where they are now, during the last glacial period (Figs. 2a and 13). During the last glacial period, because glaciers flowed both south out of the southern Brooks Range and north out of the northern Alaska Range, the potential existed for the development of katabatic winds with opposing directions. It is proposed here that these opposing katabatic winds played a role in the generation of loess in the Yukon-Tanana Upland area.
Seasonality could also have played a role in the timing of eolian silt entrainment during the last glacial period. A recent global climate simulation by Alder and Hostetler (Reference Alder and Hostetler2015) presents surface paleowinds at 3 ka intervals over the past 21 ka. In winter (December, January, and February), surface winds in interior Alaska at 21 ka and 18 ka are simulated to be much stronger than present and dominantly from the east or northeast. In summer (June, July, and August), winds at 21 ka and 18 ka are also simulated to be stronger than present (though weaker than during winter), but from the south. If this reconstruction is correct, Yukon-Tanana Upland loess that was derived from the Yukon River valley could have been entrained largely during the colder months of the year, whereas Yukon-Tanana Upland loess that was derived from the Tanana River valley could have been entrained during the warmer months of the year.
CONCLUSIONS
Loess in Alaska has traditionally been associated with glacial periods, but loess deposits confidently dated to the last glacial period are scarce. We report here a rare occurrence of loess dating to this period on the lower slopes of the western Yukon-Tanana Upland of central Alaska. In the thickest sections, radiocarbon ages of plant materials from buried peats (deep in the sections) and land snails (near the surface) indicate that loess deposition was in progress by ~19 ka and terminated sometime shortly after ~13 ka to ~12 ka. Loess near the Yukon River is as much as ~10 m thick and thins, in an irregular fashion, to the south. Within a few kilometers of the river, the loess has abundant coarse particles, with high coarse-silt/fine-silt values, implying strong winds and/or a nearby source. However, coarse-silt contents decrease to the south, with a concomitant increase in fine-silt contents. All these observations imply that the Yukon River valley was a major loess source during the last glacial period.
The presence of abundant carbonate minerals (calcite and dolomite) in Yukon-Tanana Upland loess contrasts with loess of the Fairbanks area, and also implicates the Yukon River valley as a source, because sediments in this river system are high in carbonate minerals. Nevertheless, geochemical data indicate that Yukon River valley silts cannot be the only source, and Tanana River valley silts appear to be a contributing source. If so, this implies that southerly winds must have been present during the last glacial period, because the Tanana River is situated to the south of the western Yukon-Tanana Upland. Reconciliation of both a dominantly northerly loess source (Yukon River valley) and a secondary southerly loess source (Tanana River valley) is possible with consideration of the role of opposing katabatic winds. Because glaciers expanded in both the southern Brooks Range (to the north) and the northern Alaska Range (to the south) during the last glacial period, the Yukon-Tanana Upland, between these two mountain ranges, was in a position to receive sediment from both directions because of strong katabatic winds over these ice bodies. An alternative interpretation comes from a recent climate model for the last glacial period in Alaska. This model simulates southerly winds during last-glacial summers in Alaska and northerly winds during last-glacial winters, suggesting seasonality could play a role in changing loess sources. With either interpretation, the observations made here indicate that loess accumulation in central Alaska during the last glacial period likely had a complex origin.
ACKNOWLEDGMENTS
The Climate and Land Use Change Research and Development Program of the U.S. Geological Survey (USGS) supported this study. We thank the Alaska Department of Transportation and Public Facilities (Division of Maintenance and Operations) for allowing us to study the sections along the Dalton Highway when they were newly exposed in 2006. Jossh Beann (USGS, retired), Zachary Muhs Rowland (USGS volunteer), and Peter Rowland (USGS volunteer) assisted with fieldwork, which we appreciate. We extend sincere thanks to our good friend, Jack McGeehin (USGS, retired), for generating the radiocarbon ages. We appreciate helpful discussions with Duane Froese (University of Alberta) about tephra geochemistry and with Steve Hostetler (USGS) about paleoclimatic interpretations. Dave Grimley (Illinois State Geological Survey), Pierre Antoine (CNRS, Laboratoire de Géographie Physique), Randy Schaetzl (Michigan State University), Adam Hudson (USGS), and Janet Slate (USGS) offered helpful comments on an earlier version of this paper, for which we extend our thanks. Any use of trade, product, or firm names is for descriptive purposes only and does not imply endorsement by the U.S. government.
SUPPLEMENTARY MATERIAL
To view supplementary material for this article, please visit https://doi.org/10.1017/qua.2018.11