1. Introduction
Currently, the application of industrial robots is expanding rapidly, encompassing fields such as food packaging, medical equipment, spraying, handling, and processing [Reference Maghami and Khoshdarregi1–Reference Liu, Guo, Yin, Jiang and Liu5 ]. The control system is central to industrial robots, and its quality not only influences the robot’s flexibility and execution capability but also its operational accuracy [Reference Jin, Chen, Zhao, Ji and Jing6]. Interpolation points are the primary means by which the control system manages industrial robots, and their quantity directly impacts the robots’ accuracy and stability [Reference Domae7–Reference Clark and Ahmad9 ]. It is well understood that increasing the number of interpolation points can enhance motion accuracy and stability, and prevent abrupt movements, but an excessive number can lead to jittering and loss of synchronization during motion [Reference Sun, Liu, Ding and Pi10–Reference Feng, Sun and Tian12 ]. In this paper, we investigate the relationship between the response time of the control system and the robot’s terminal velocity to determine the limit interpolation points under various conditions.
In recent years, as industrialization has advanced, the demands on industrial robots have become more stringent, with applications increasingly requiring high precision and efficiency [Reference Hijazi, Brethé and Lefebvre13–Reference Zhao, Liu and Li16 ]. The motion accuracy of a robot is influenced not only by its structure but also significantly by the control system [Reference Zhang, Meng and Yin17–Reference Xiao, Zhang, Wang, Xiao, Xing, Li and Zhao25 ]. The greater the number of interpolation points the control system can manage, the smoother the path planning becomes, enhancing the stability of robot motion and allowing for better control of speed and acceleration to prevent abrupt movements. Fewer interpolation points can reduce computational and control complexity, improve the efficiency and real-time performance of path planning, and decrease system load. However, the robot’s terminal velocity and the control system’s response time are coupled with the interpolation points, necessitating the selection of an appropriate number of interpolation points to balance accuracy, efficiency, and real-time performance based on specific conditions. In practical application, experiments and theoretical calculations are typically required to determine the limit interpolation points and provide a basis for selecting the number of interpolation points in path planning.
Current research has identified that robots exhibit significant jittering and out-of-step when their terminal velocity exceeds a certain threshold [Reference Zu, Zhao, Chen, He and Zhou26, Reference Li, Ma, Zhang, Wu, Chen, Li, Li and Cheng27], yet no comprehensive studies have been undertaken. It is widely recognized that increasing the number of interpolation points enhances the precision of the robot’s motion trajectory; however, excessive interpolation points can lead to CPU (Central Processing Unit) utilization exceeding acceptable levels. If the control system’s response time is prolonged, the robot may experience delays in the executing interpolation motion, potentially causing discrepancies between planned and actual trajectories, thereby affecting the robot’s accuracy and stability.
In summary, this paper presents the relationship between the control system’s response time, the robot’s terminal velocity, and the limit interpolation points through theoretical calculations and experimental validation. This provides a foundation for the rational selection of interpolation points, ensuring stable and smooth robot motion while avoiding abrupt movements.
The main research contents of this paper include the following: Section 2 introduces division of the control system’s response time and the principle of time-sharing multitasking; Section 3 presents a method for calculating the theoretical limit interpolation points. In Section 4, the experimental equipment and procedures are introduced, and multiple experimental results are obtained by varying the response time and terminal velocity, followed by analysis of the results. In Section 5, the method for calculating theoretical limit interpolation points is refined, and the optimized calculation method is validated; Section 6 is the summary of the full text.
2. Response mechanism analysis of control system
The number of limit interpolation points in a controller typically depends on its computing power, sampling frequency, and real-time requirements. In a real-time control system, generating and executing interpolation points consumes the controller’s computational resources. Therefore, to determine the controller’s capacity for handling limit interpolation points, a comprehensive evaluation based on these factors is necessary. In practical applications, the controller’s maximum interpolation point processing capacity is typically determined through experiments. Analyzing the number of limit interpolation points in a robot control system can address the issue of excessive CPU utilization during the robot control process.
In the robot control system, response time directly influences the robot’s accuracy and stability during trajectory planning and interpolation motion. The shorter the response time, the more quickly the robot can initiate movement following a control instruction, thereby reaching each interpolation point with greater accuracy and achieving a smoother motion trajectory. If the response time of the robot control system is prolonged, there may be delays in the execution of interpolation motions, and the planned trajectory may deviate from the actual motion, thereby affecting the robot’s accuracy and stability.
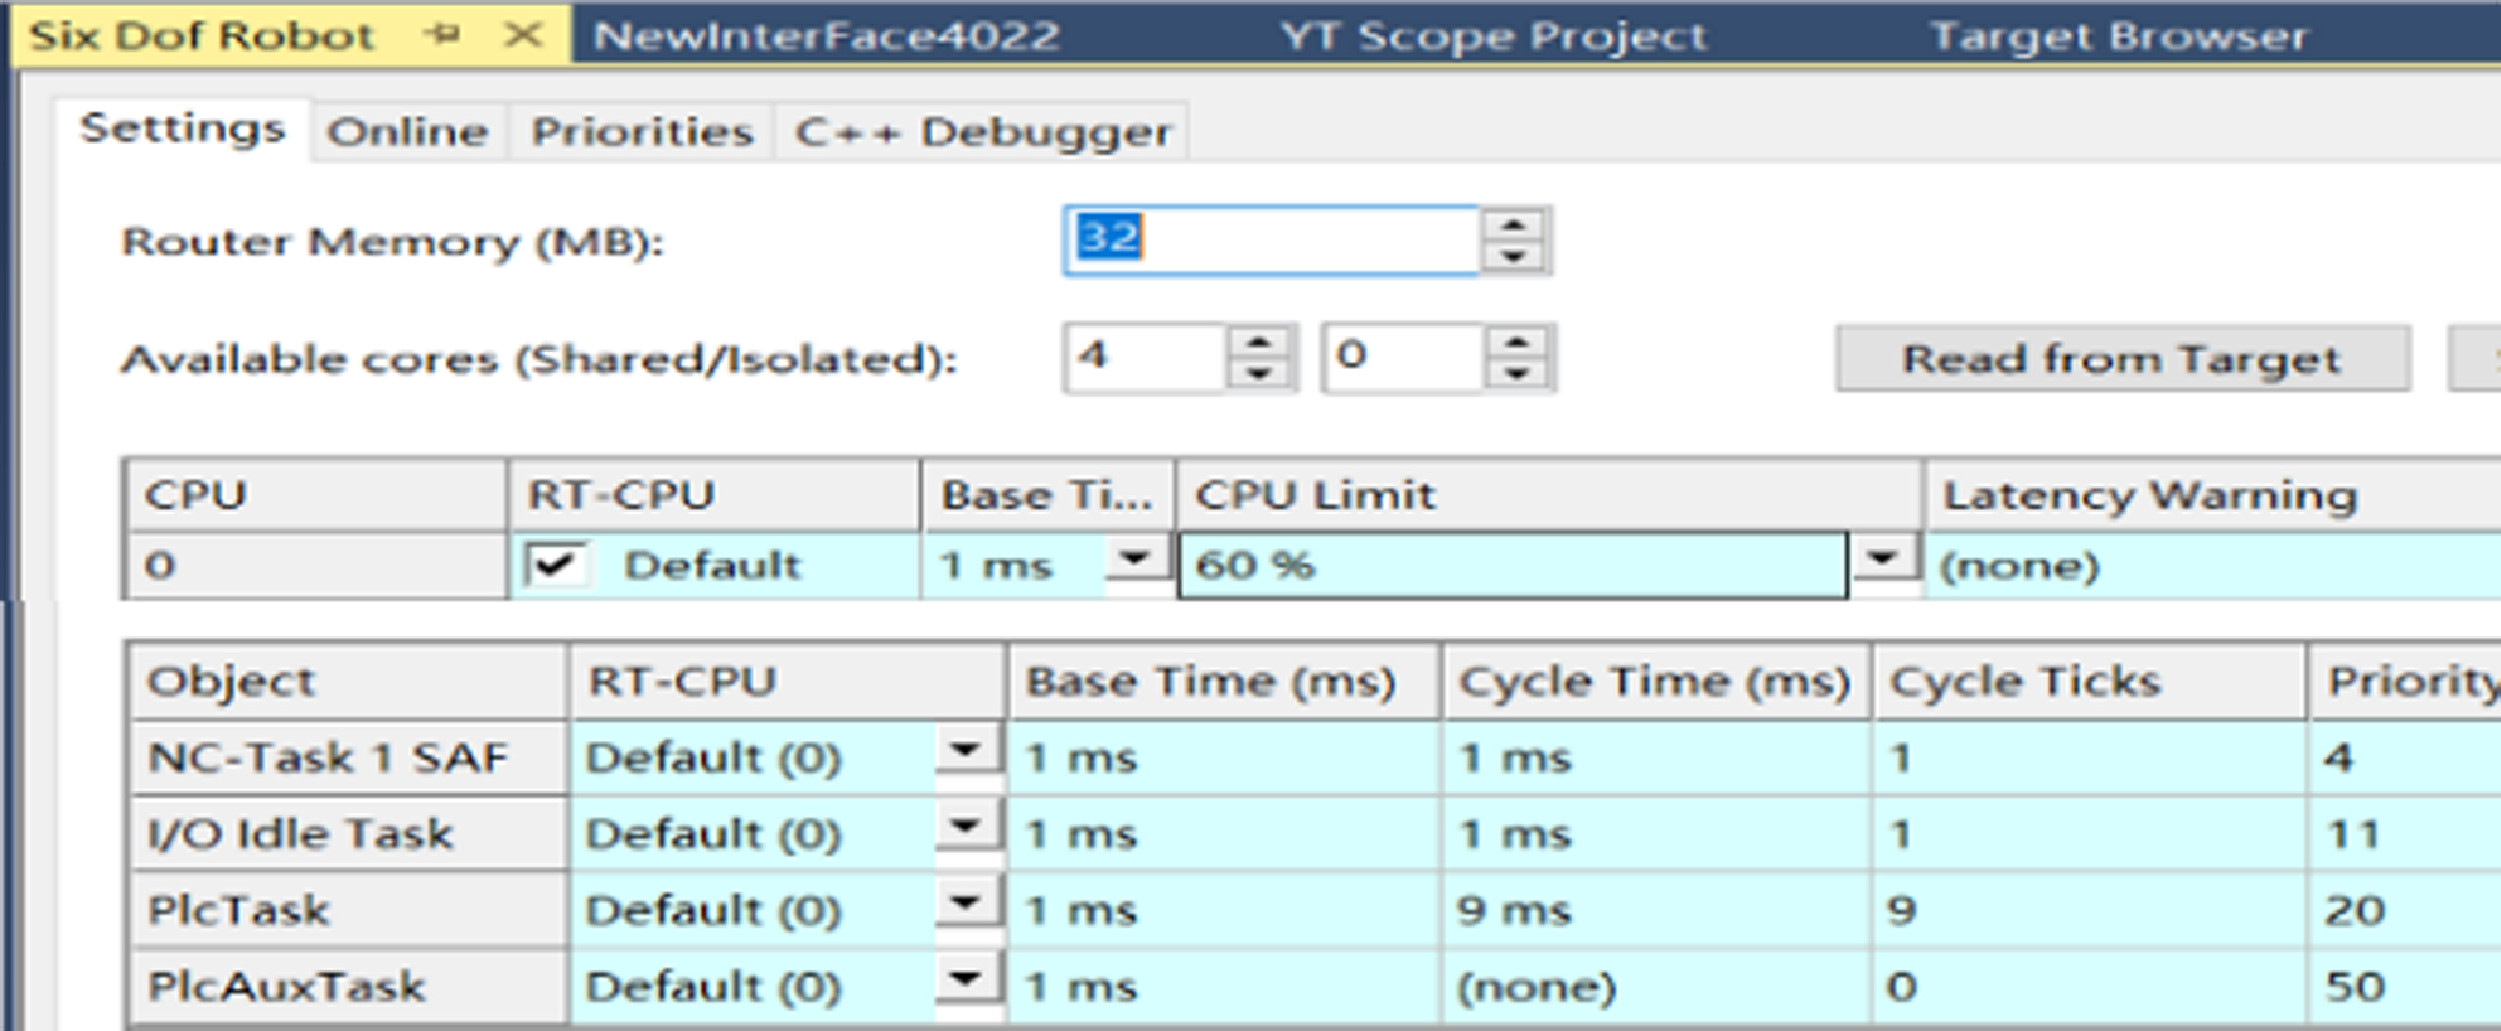
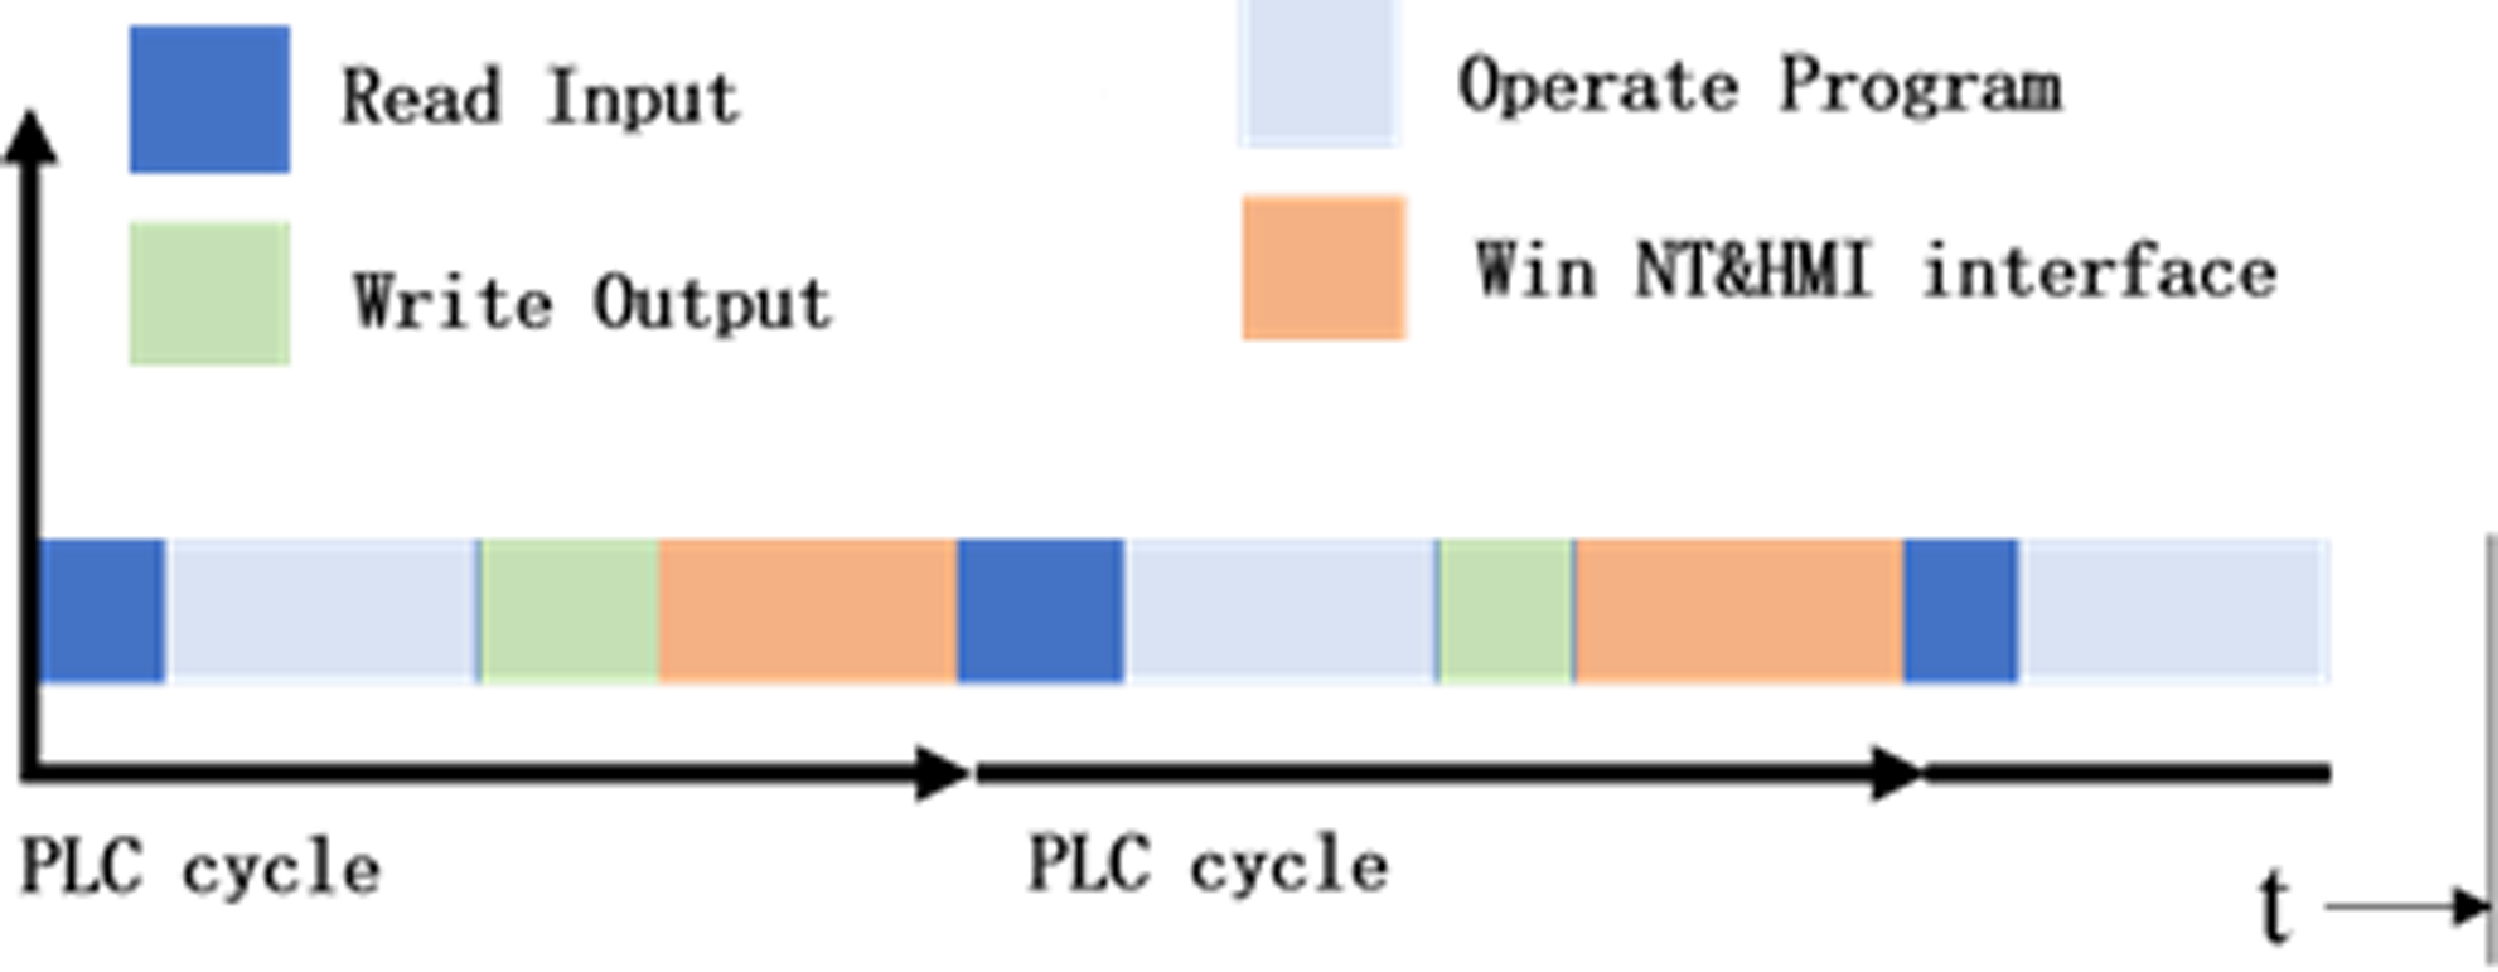
This paper uses the Beckhoff controller in the self-developed robot as an example to demonstrate that the control system’s response time comprises three components: input time, calculation time, and output time. The input time and output time are determined by I/O operations, while the calculation time is ensured by the real-time core of TwinCAT. Based on the control system’s architecture, during the execution of the TwinCAT control task, the computer allocates a portion of the CPU’s computing power through real-time checks of various functional blocks at the operating system’s base level [Reference Li, Ding, Zhao and Liu28], as shown in Fig. 1.
Task division of CPU in the control system.

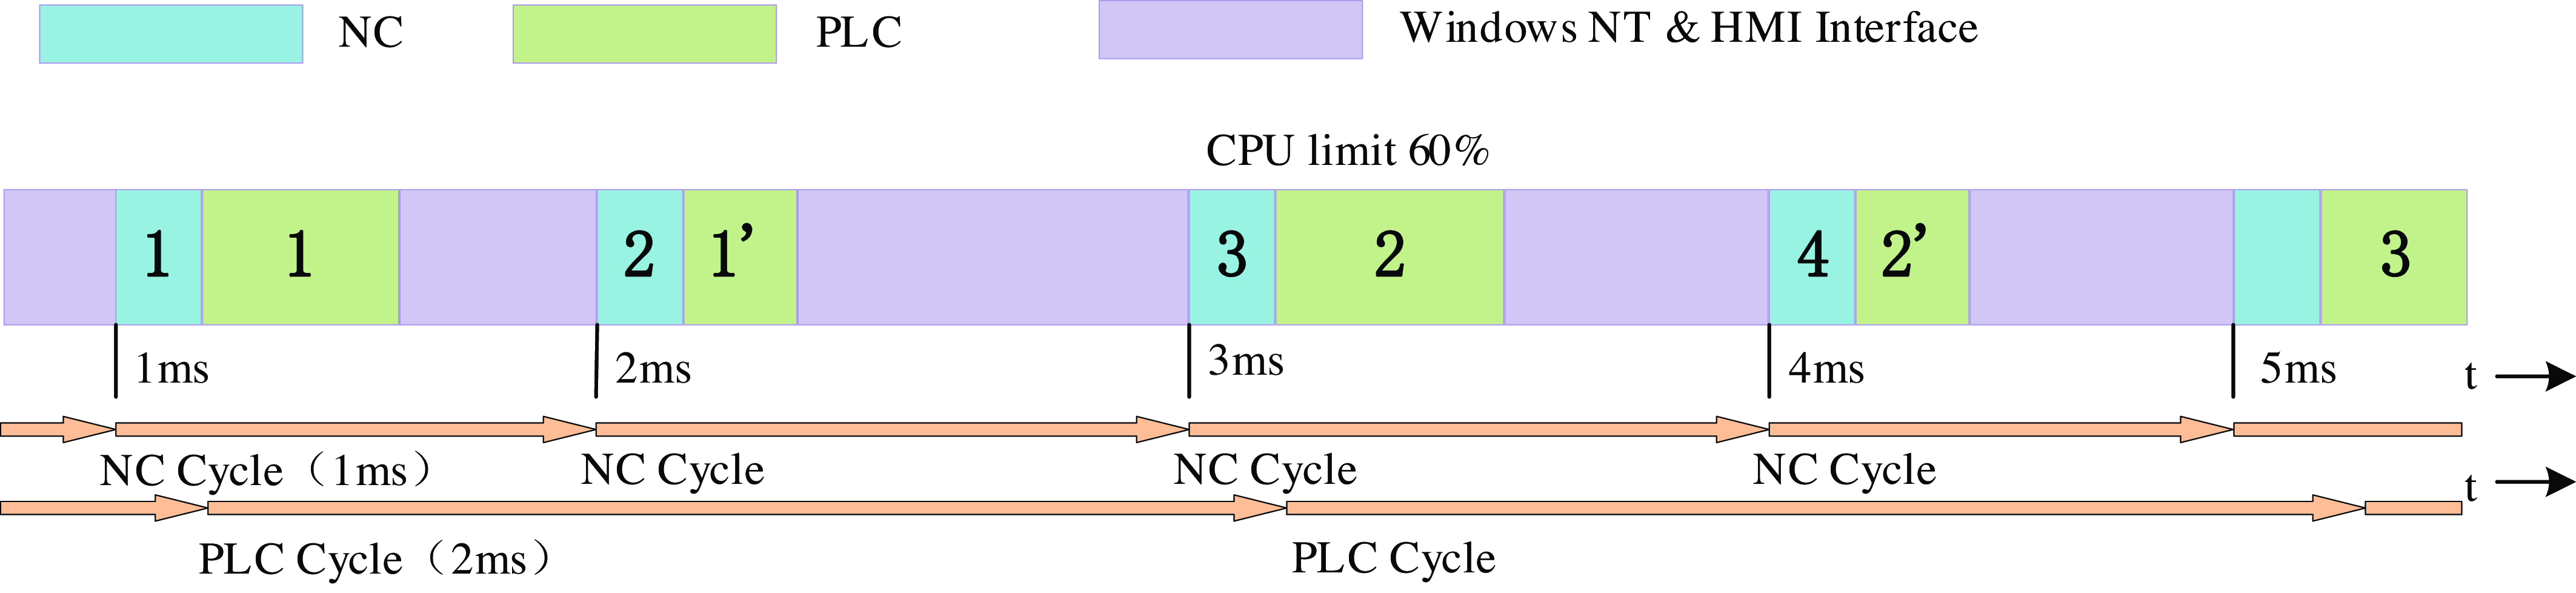
Once the response time for the corresponding task in the robot control system is set, the subsequent allocation of CPU time is shown in Fig. 2. The base time is the minimum time slice that Windows allocates for CPU time resources to TwinCAT. The CPU limit represents the maximum percentage of CPU resources that TwinCAT can utilize within this time slice. In PLC (Programmable Logic Controller) tasks, the real-time kernel initially allocates the CPU based on the base time, then divides it into four processes within a PLC cycle, as shown in Fig. 2, for each 1 ms real-time task, and ultimately responds to human-computer interaction requests. If the CPU limit is reached during the application and the task is not completed, the TwinCAT thread will suspend and proceed to the next stage of execution [Reference Hughes, Chang, Hu, Talak, Abdulhai, Strader and Carlone29, Reference Laurenzi, Antonucci, Tsagarakis and Muratore30]. Generally, the CPU limit and base time can be adjusted, and setting the response time appropriately facilitates a broader range of system applications.
CPU time allocation during system running.

The CPU of a computer equipped with TwinCAT must allocate a portion of its computational power to perform the functions of PLC module and the NC (Numerical Control) module in the motion controller while the system is operational. Consequently, there are two primary tasks in the system: NC-TASK1 SAF and Plc Task, with periods of 1 and 10 ms, respectively. Based on this configuration, when TwinCAT is operational, the execution timing of the two tasks in the system is shown in Fig. 3.
Execution sequence of time-sharing multitasking.

As shown in Fig. 3, in this system, NC and PLC tasks run on dedicated real-time cores, the NC task has a higher priority than the PLC task due to its higher priority setting. Consequently, at the start of the 1 ms cycle, the NC task is executed first. The PLC task, which has a lower priority, is executed only after the NC task completes and the CPU Limit is not exceeded. If the first pass of the PLC task is not completed within the CPU time limit, the CPU will interrupt the current PLC task and proceed to the next task. For instance, during task execution, if the system is still executing the first pass of the PLC task after 3 ms, a timeout marker, "timeout completion counter," will automatically trigger, allowing the PLC program to immediately detect the task status. When the system experiences consecutive timeouts, the PLC will detect that the CPU utilization has exceeded the standard threshold.
There are two approaches to address the issue of excessive CPU utilization: optimizing the code and optimizing task response time. Of these two approaches, optimizing task response time can lead to more efficient control system responses and faster coordination of CPU resources. Therefore, to ensure that the robot control system achieves accurate and stable motion control, the control system’s response time is optimized, and the relationship between response time and motion interpolation points is established. This allows the robot to respond quickly to control commands and achieve effective motion interpolation, thereby enhancing production and operational efficiency.
3. Determination method of limit interpolation points
To investigate the relationship between the control system’s response time, the robot’s terminal velocity, and the number of limit interpolation points, it is essential to control the robot to perform point-to-point interpolation motion, and subsequently assess the control system’s performance based on the robot’s motion.
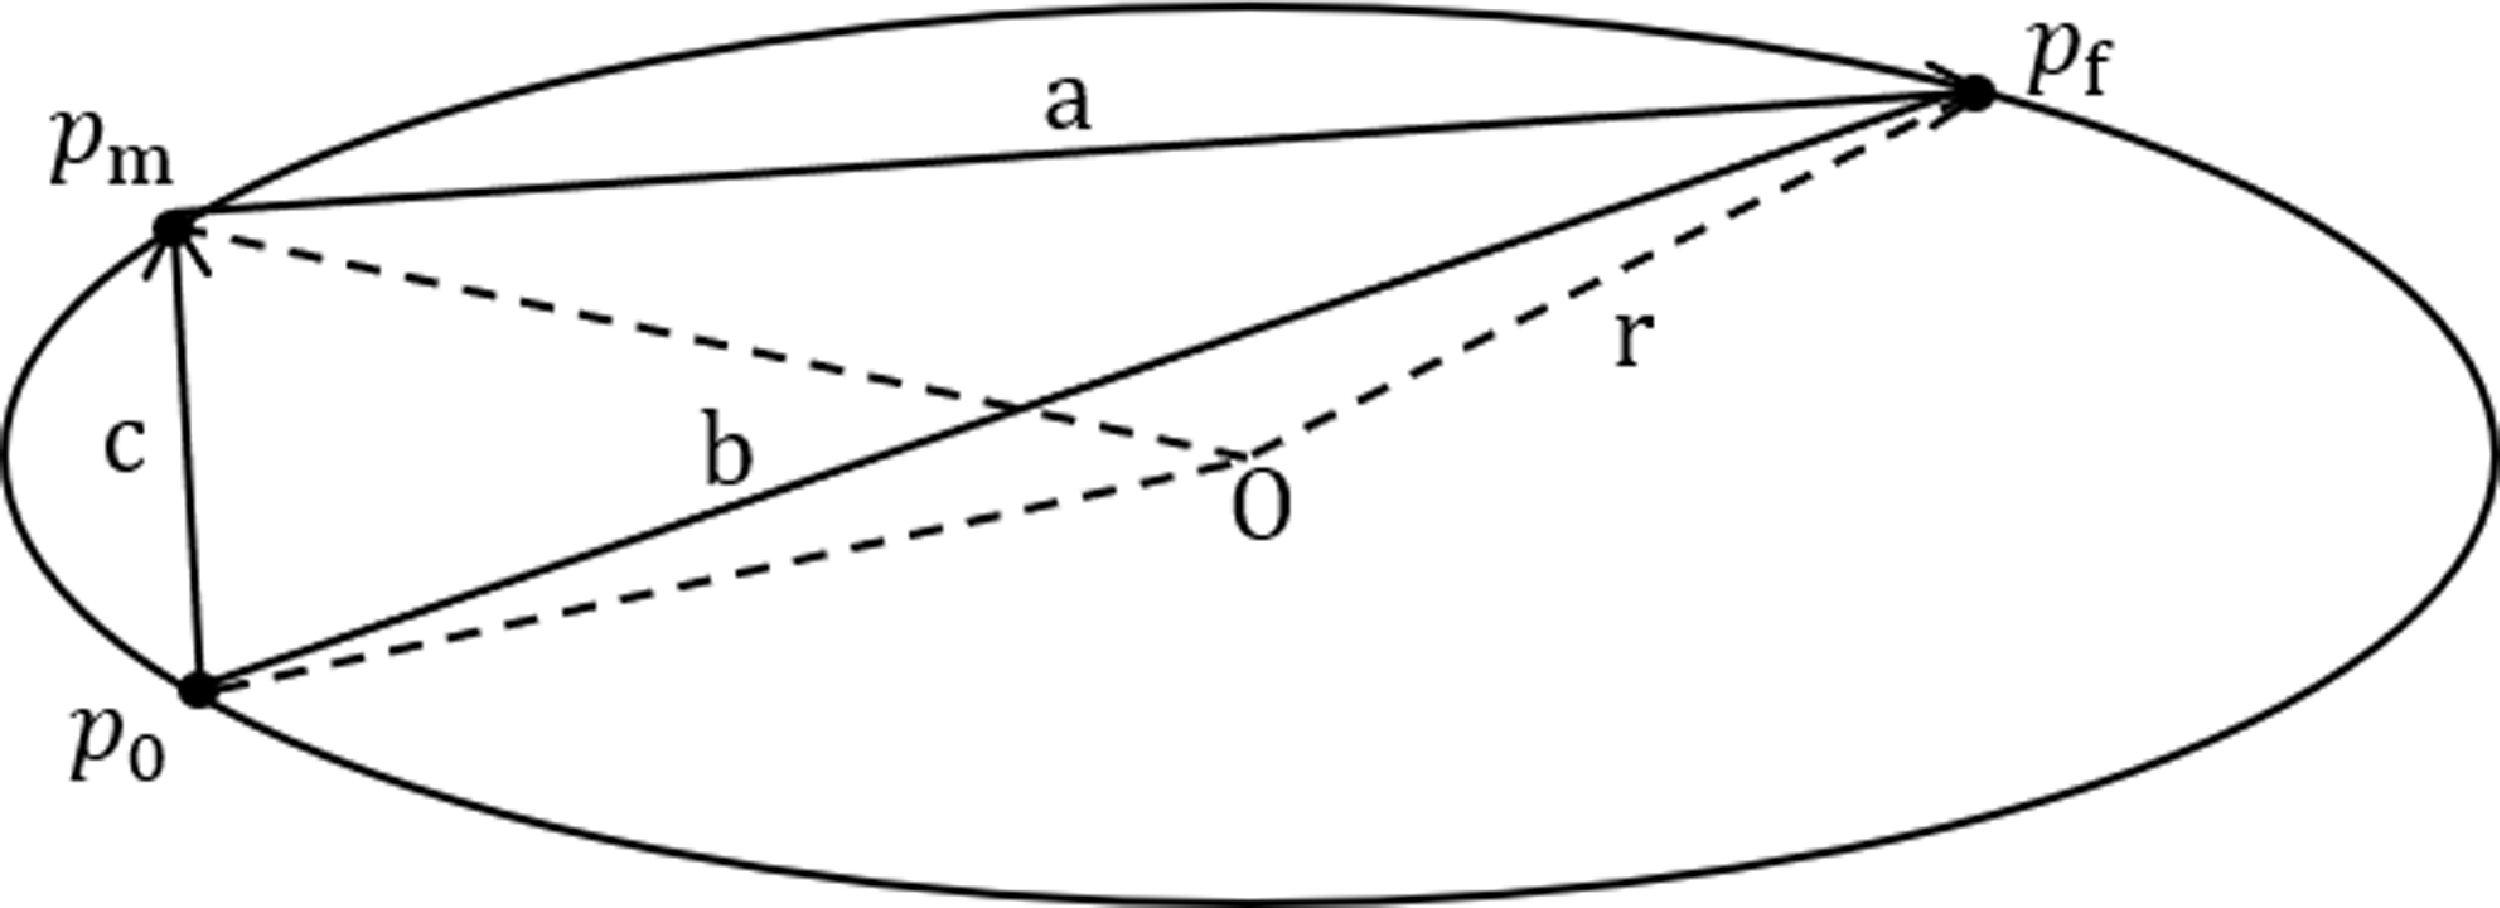
The position of the manipulator’s end-effector is interpolated using the circular interpolation principle. Define
 $p_{0}(x_{0},y_{0},z_{0})$
as the starting point of the arc trajectory,
 $p_{m}(x_{m},y_{m},z_{m})$
as the middle point, and
 $p_{f}(x_{f},y_{f},z_{f})$
as the target point. These three points form the internal triangle of the arc trajectory, as shown in Fig. 4.
Schematic diagram of arc trajectory interpolation.

In Fig. 4 (a), (b), and (c) represent the sides of the internal triangle, and the distance l between any two points can be expressed in coordinates as:
 $l=\sqrt{(x_{1}-x_{2})^{2}+(y_{1}-y_{2})^{2}}$
. Let
 $C_{0}$
be the circumference of the internal triangle, then the radius of the arc of the path traveled can be expressed as:
 \begin{equation} r=\frac{abc}{4S_{\Delta }}=\frac{abc}{4\sqrt{\frac{C_{0}}{2}\left(\frac{C_{0}}{2}-a\right)\left(\frac{C_{0}}{2}-b\right)\left(\frac{C_{0}}{2}-c\right)}} \end{equation}
where
 $r$
is the radius and
 $S_{\Delta }$
is the circumcircle area.
Utilize the points on the circumference to determine the trajectory function of the circle and set the center coordinates of the circular trajectory to be
 $O(x,y,z)$
. The trajectory function of the circle is then given by:
 \begin{align} \begin{cases} \left(\mathrm{x}-\mathrm{x}_{0}\right)^{2}+\left(\mathrm{y}-\mathrm{y}_{0}\right)^{2}+\left(\mathrm{z}-\mathrm{z}_{0}\right)^{2}=\left(\mathrm{x}-\mathrm{x}_{\mathrm{m}}\right)^{2}+\left(\mathrm{y}-\mathrm{y}_{\mathrm{m}}\right)^{2}+\left(\mathrm{z}-\mathrm{z}_{\mathrm{m}}\right)^{2}\\ \left(\mathrm{x}-\mathrm{x}_{\mathrm{m}}\right)^{2}+\left(\mathrm{y}-\mathrm{y}_{\mathrm{m}}\right)^{2}+\left(\mathrm{z}-\mathrm{z}_{\mathrm{m}}\right)^{2}=\left(\mathrm{x}-\mathrm{x}_{\mathrm{f}}\right)^{2}+\left(\mathrm{y}-\mathrm{y}_{\mathrm{f}}\right)^{2}+\left(\mathrm{z}-\mathrm{z}_{\mathrm{f}}\right)^{2} \end{cases} \end{align}
Then,
 \begin{align} \begin{cases} 2\left(x_{m}-x_{0}\right)x+2\left(y_{m}-y_{0}\right)y+2\left(z_{m}-z_{0}\right)z=-x_{0}^{2}-y_{0}^{2}-z_{0}^{2}+x_{m}^{2}+y_{m}^{2}+z_{m}^{2}\\ 2\left(x_{f}-x_{0}\right)x+2\left(y_{f}-y_{0}\right)y+2\left(z_{f}-z_{0}\right)z=-x_{0}^{2}-y_{0}^{2}-z_{0}^{2}+x_{f}^{2}+y_{f}^{2}+z_{f}^{2} \end{cases} \end{align}
Additionally, let the plane equation of the trajectory circle be:
 \begin{equation} \mathrm{Ax}+\mathrm{By}+\mathrm{Cz}=1 \end{equation}
Equations (3) and (4) are transformed into matrix form:
 \begin{equation} \left[\begin{array}{c@{\quad}c@{\quad}c} \mathrm{x}_{0} & \mathrm{y}_{0} & \mathrm{z}_{0}\\ \mathrm{x}_{\mathrm{m}} & \mathrm{y}_{\mathrm{m}} & \mathrm{z}_{\mathrm{m}}\\ \mathrm{x}_{\mathrm{f}} & \mathrm{y}_{\mathrm{f}} & \mathrm{z}_{\mathrm{f}} \end{array}\right]\left[\begin{array}{c} \mathrm{A}\\ \mathrm{B}\\ \mathrm{C} \end{array}\right]=\left[\begin{array}{c} 1\\ 1\\ 1 \end{array}\right] \end{equation}
By combining Eqs. (3) and (5), the center coordinates can be determined as:
 \begin{equation} \left[\begin{array}{c} \mathrm{x}\\ \mathrm{y}\\ \mathrm{z} \end{array}\right]=\left[\begin{array}{c@{\quad}c@{\quad}c} 2\left(\mathrm{x}_{\mathrm{m}}-\mathrm{x}_{0}\right) & 2\left(\mathrm{y}_{\mathrm{m}}-\mathrm{y}_{0}\right) & 2\left(\mathrm{z}_{\mathrm{m}}-\mathrm{z}_{0}\right)\\ 2\left(\mathrm{x}_{\mathrm{f}}-\mathrm{x}_{0}\right) & 2\left(\mathrm{y}_{\mathrm{f}}-\mathrm{y}_{0}\right) & 2\left(\mathrm{z}_{\mathrm{f}}-\mathrm{z}_{0}\right)\\ \mathrm{A} & \mathrm{B} & \mathrm{C} \end{array}\right]^{-1}\left[\begin{array}{c} -\mathrm{x}_{0}^{2}-\mathrm{y}_{0}^{2}-\mathrm{z}_{0}^{2}+\mathrm{x}_{\mathrm{m}}^{2}+\mathrm{y}_{\mathrm{m}}^{2}+\mathrm{z}_{\mathrm{m}}^{2}\\ -\mathrm{x}_{0}^{2}-\mathrm{y}_{0}^{2}-\mathrm{z}_{0}^{2}+\mathrm{x}_{\mathrm{f}}^{2}+\mathrm{y}_{\mathrm{f}}^{2}+\mathrm{z}_{\mathrm{f}}^{2}\\ 1 \end{array}\right] \end{equation}
By determining the coordinates of the circle’s center, the radius can be calculated, and the radius parameter can be incorporated into the G-code. The information for a single arc interpolation point is generated, and this method can be used to generate the information for each point on the arc trajectory.
Assuming that there are
 $n$
trajectory points on the arc, dividing the arc angle
 $\theta$
into
 $n$
equal parts. If
 $i$
is less than
 $n$
, the arc angle formed by the
 $i$
th tracepoint and the starting point
 $p_{02}$
can be expressed as:
 \begin{equation} {\unicode[Arial]{x03B8}} _{\mathrm{i}}=\frac{\mathrm{i}}{\mathrm{n}}{\unicode[Arial]{x03B8}} \end{equation}
Then, introduce a Z axis to the plane containing the arc trajectory. The angle
 $\theta _{i}$
through which the robot’s end effector rotates around the Z axis, from the starting point
 $p_{02}(x_{0},y_{0},z_{0})$
to the
 $i$
th trajectory point.
At the same time, the unit vector of the arc trajectory’s rotation axis is:
 \begin{equation} \mathrm{w}=\frac{\mathrm{p}_{02}}{\left\| \mathrm{p}_{02}\right\| }\times \frac{\mathrm{p}_{\mathrm{f}2}}{\left\| \mathrm{p}_{\mathrm{f}2}\right\| }=\left[\begin{array}{ccc} \mathrm{w}_{\mathrm{x}} & \mathrm{w}_{\mathrm{y}} & \mathrm{w}_{\mathrm{z}} \end{array}\right] \end{equation}
where
 $p_{\mathrm{f}2}$
represents the coordinates of the target point of the arc trajectory, and
 $p_{02}$
represents the coordinates of the starting point.
The rotation matrix is given by:
 \begin{equation} \mathrm{R}_{\mathrm{i}}=\left[\begin{array}{c@{\quad}c@{\quad}c} \mathrm{c}{\unicode[Arial]{x03B8}} _{\mathrm{i}}+\mathrm{w}_{\mathrm{x}}^{2}\left(1-\mathrm{c}{\unicode[Arial]{x03B8}} _{\mathrm{i}}\right) & \mathrm{w}_{\mathrm{xy}}\left(1-\mathrm{c}{\unicode[Arial]{x03B8}} _{\mathrm{i}}\right)-\mathrm{w}_{\mathrm{z}}\mathrm{s}{\unicode[Arial]{x03B8}} _{\mathrm{i}} & \mathrm{w}_{\mathrm{xz}}\left(1-\mathrm{c}{\unicode[Arial]{x03B8}} _{\mathrm{i}}\right)+\mathrm{w}_{\mathrm{y}}\mathrm{s}{\unicode[Arial]{x03B8}} _{\mathrm{i}}\\ \mathrm{w}_{\mathrm{xy}}\left(1-\mathrm{c}{\unicode[Arial]{x03B8}} _{\mathrm{i}}\right)+\mathrm{w}_{\mathrm{z}}\mathrm{s}{\unicode[Arial]{x03B8}} _{\mathrm{i}} & \mathrm{c}{\unicode[Arial]{x03B8}} _{\mathrm{i}}+\mathrm{w}_{\mathrm{y}}^{2}\left(1-\mathrm{c}{\unicode[Arial]{x03B8}} _{\mathrm{i}}\right) & \mathrm{w}_{\mathrm{yz}}\left(1-\mathrm{c}{\unicode[Arial]{x03B8}} _{\mathrm{i}}\right)-\mathrm{w}_{\mathrm{x}}\mathrm{s}{\unicode[Arial]{x03B8}} _{\mathrm{i}}\\ \mathrm{w}_{\mathrm{xz}}\left(1-\mathrm{c}{\unicode[Arial]{x03B8}} _{\mathrm{i}}\right)-\mathrm{w}_{\mathrm{y}}\mathrm{s}{\unicode[Arial]{x03B8}} _{\mathrm{i}} & \mathrm{w}_{\mathrm{yz}}\left(1-\mathrm{c}{\unicode[Arial]{x03B8}} _{\mathrm{i}}\right)+\mathrm{w}_{\mathrm{x}}\mathrm{s}{\unicode[Arial]{x03B8}} _{\mathrm{i}} & \mathrm{c}{\unicode[Arial]{x03B8}} _{\mathrm{i}}+\mathrm{w}_{\mathrm{z}}^{2}\left(1-\mathrm{c}{\unicode[Arial]{x03B8}} _{\mathrm{i}}\right) \end{array}\right] \end{equation}
where
 $w_{xy}=w_{x}\times w_{y},{w_{xz}}={w_{x}}\times {w_{z}},\,w_{yz}=w_{y}\times w_{z},c\theta _{i}=\mathit{\cos } \theta _{i},s \theta _{i}=\mathit{\sin } \theta _{i}$
.
Consequently, by combining the target position coordinates and rotation matrix, the pose matrix of the robot ’s end effector can be derived. This pose matrix, corresponding to each point on the arc trajectory, can be utilized to determine the robot pose, thereby enabling the robot to perform arc interpolation motion.
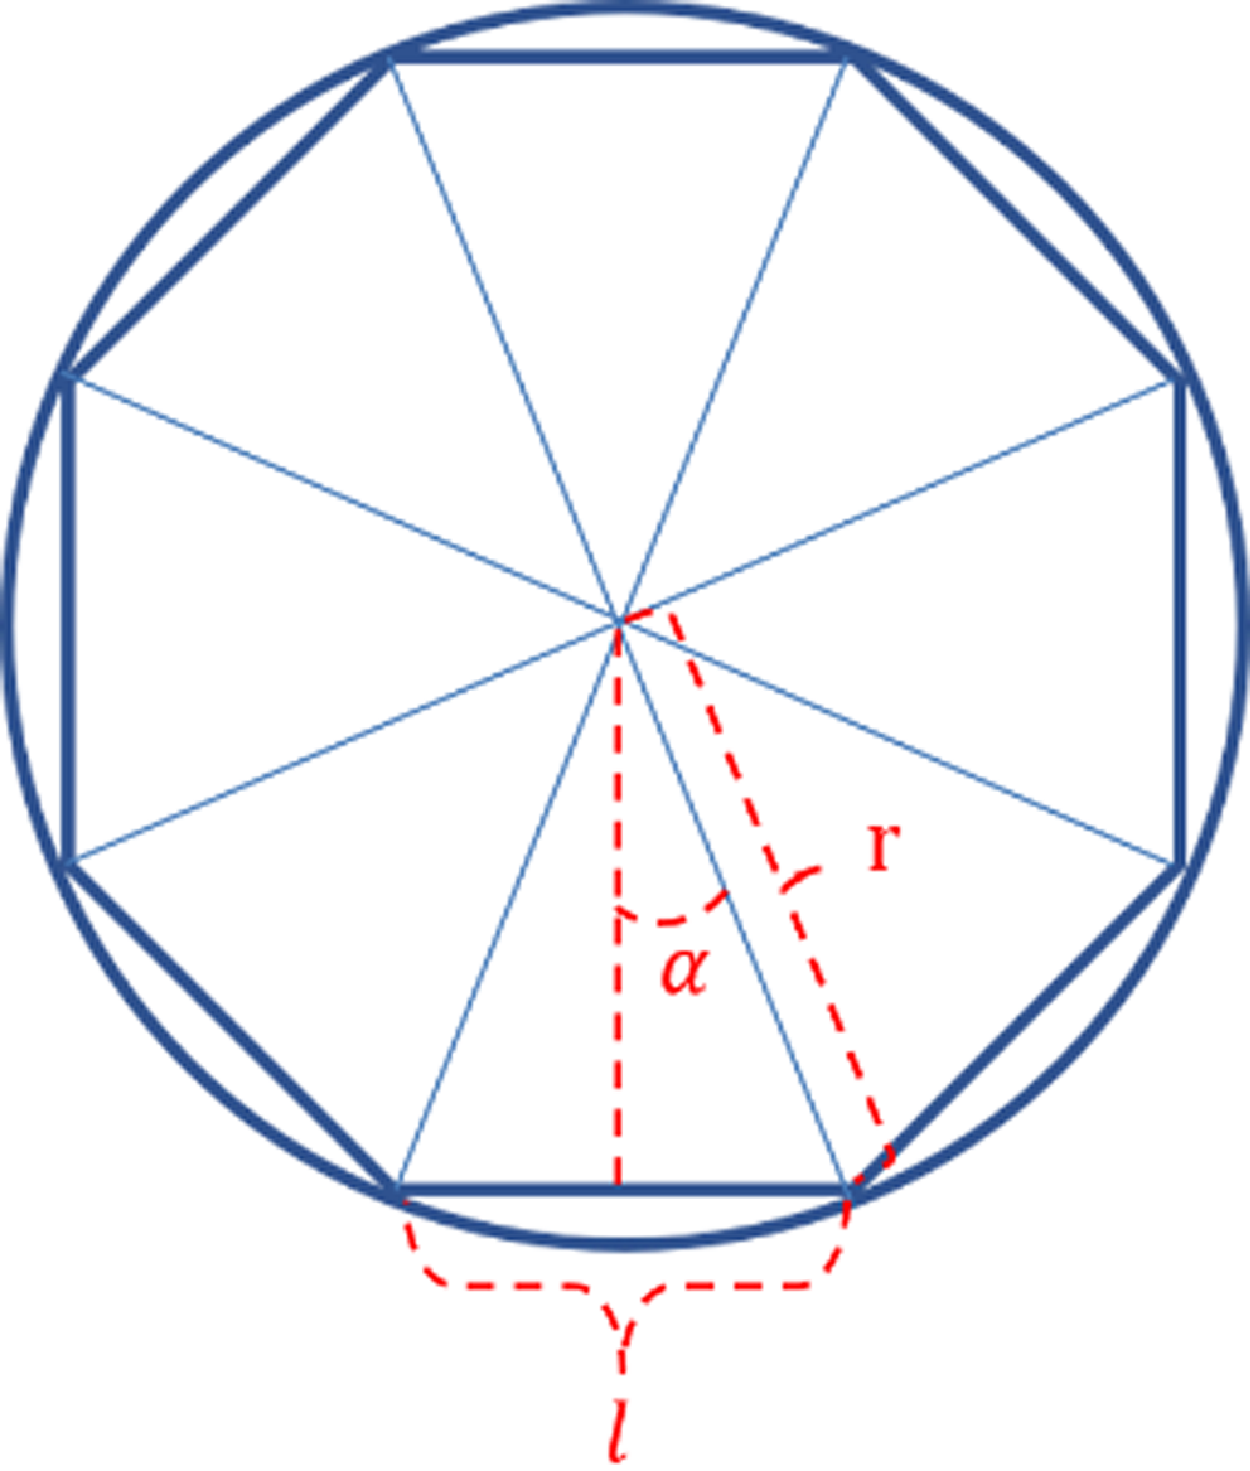
As shown in Fig. 5, the greater the number of interpolation points along the robot’s motion trajectory on the circumference, the smaller the approximation error of the line becomes. However, the number of steps in the robot’s motion increases, while the step length decreases. Therefore, it is assumed that there is a limit to the number of interpolation points given a certain robot’s terminal velocity and the control system’s response time. Thus, there are m points on the entire circular trajectory of the robot, with a step between each pair of points. When the number of points on the circle is sufficiently large, the length of each step approaches the length of the circle. The robot’s terminal velocity is v, the control system’s response time is t, and the number of limit interpolation points on the circumference is m. The circumference is then divided into m segments, with the chord length of each segment being l, then:
 \begin{equation} {\unicode[Arial]{x03B1}} =\frac{360^{\circ}}{2\mathrm{m}} \end{equation}
where
 $\alpha$
is the angle between the angular bisector of the circular radius chord and the circle’s center angle.
Division of circular track points.

Let the robot’s step size be s, then
 $\mathit{s}\mathit{=}\mathit{vt}$
. If the step length s is less than the chord length l, the robot movement will not be out-of-step, so l > s, then:
 \begin{equation} 2\text{rsin}\left(\frac{360^{\circ}}{2\mathrm{m}}\right)\geq \mathrm{vt} \end{equation}
Then,
 \begin{equation} \mathrm{m}\leq \frac{180^{\circ}}{\arcsin \left(\frac{\mathrm{vt}}{2\mathrm{r}}\right)} \end{equation}
4. Limit interpolation points determination experiment
To validate the accuracy of the theoretical calculation of limit interpolation points, the robot’s motion under varying response times and terminal velocities was recorded through experiments, and the results were analyzed.
4.1 Experimental process
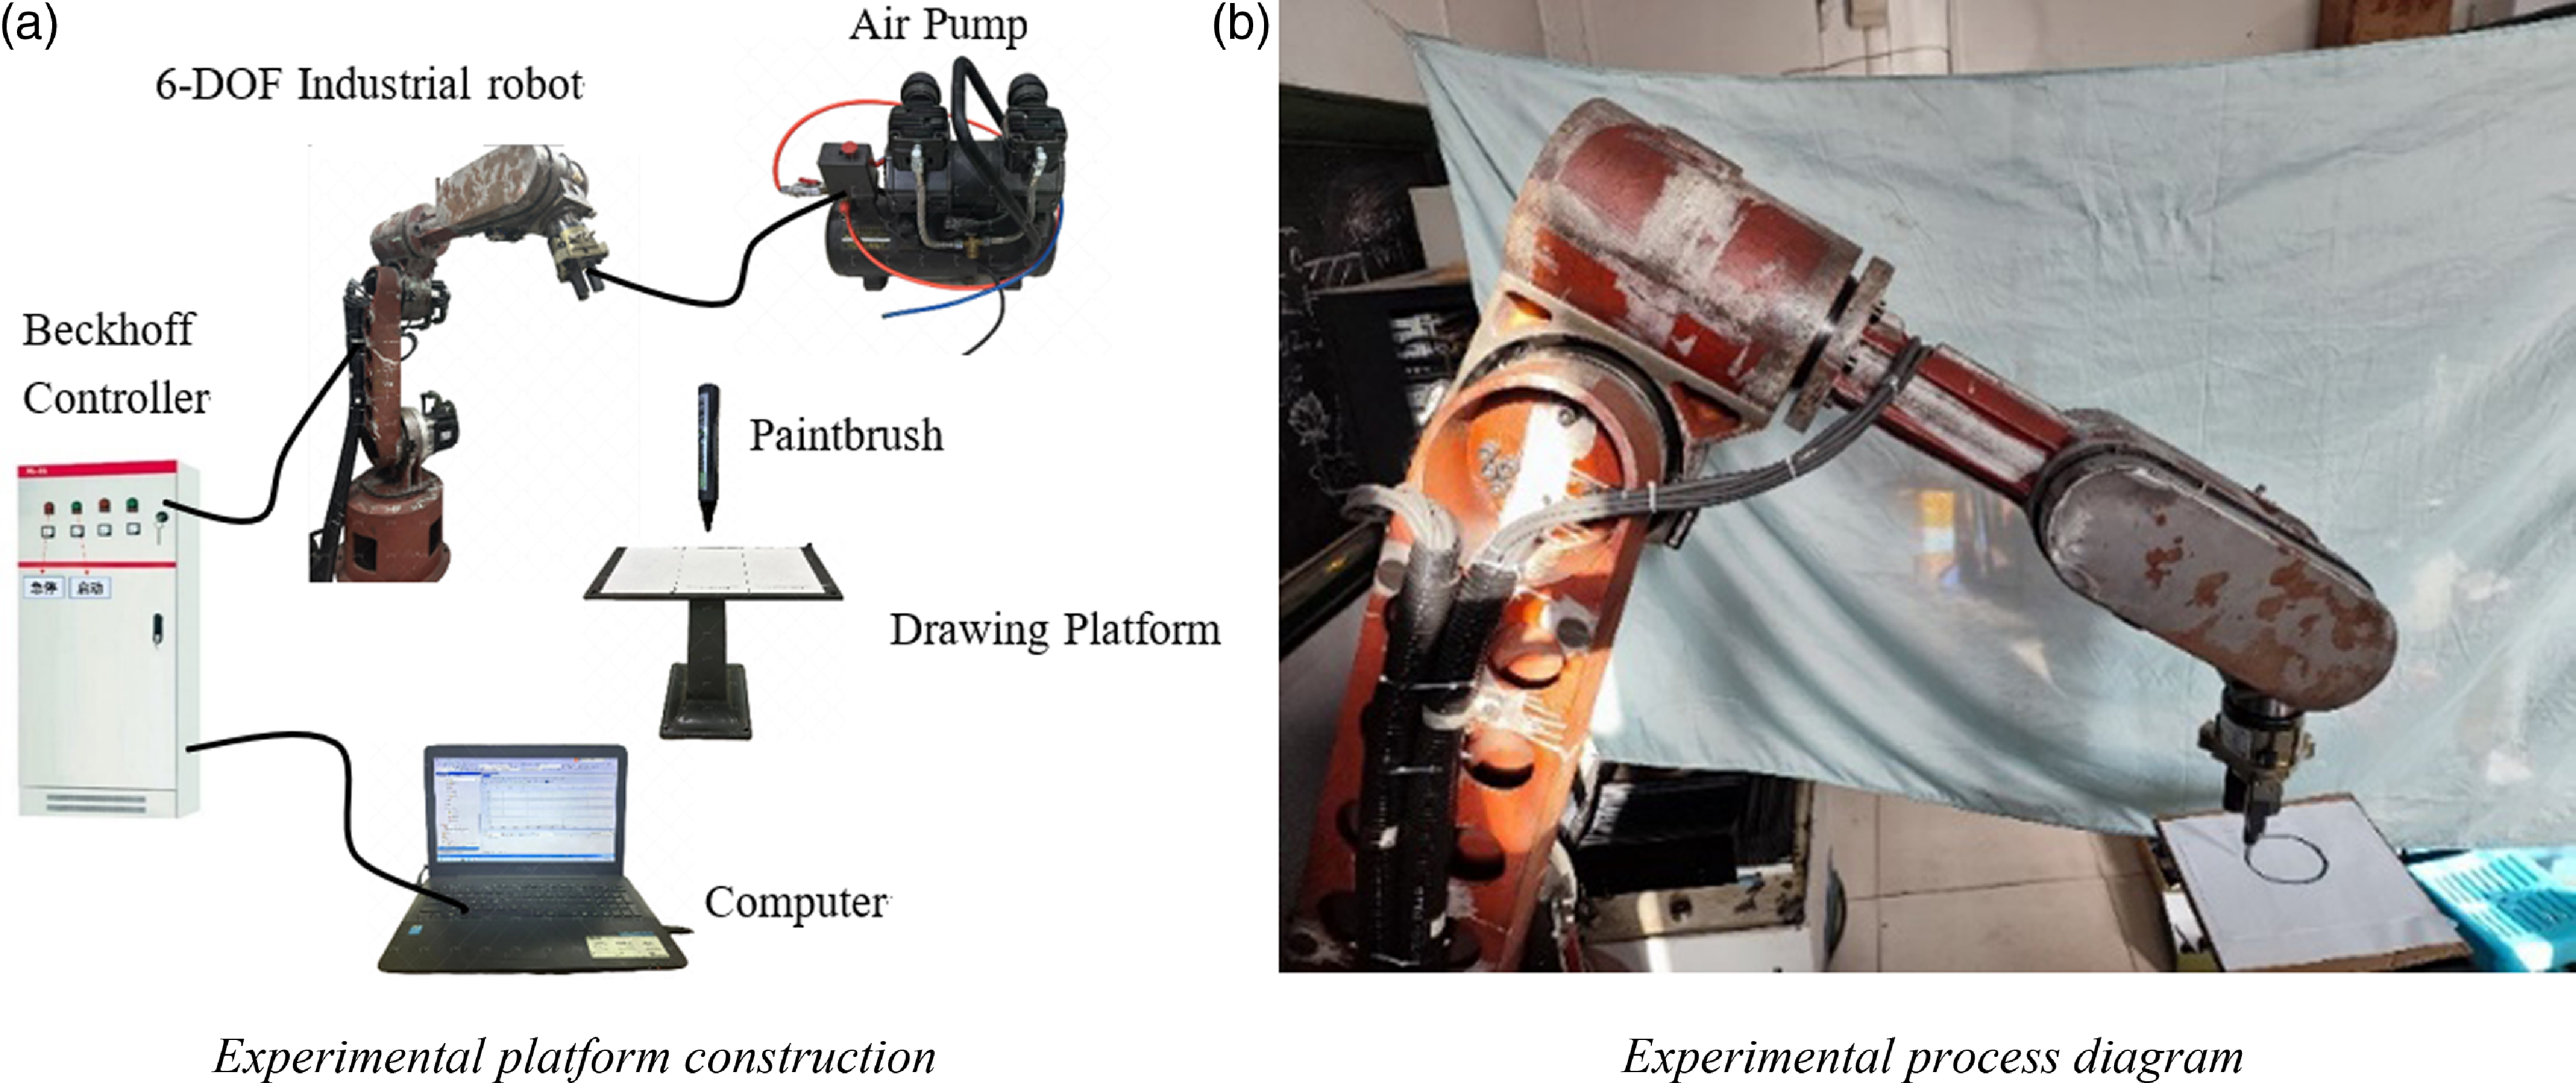
To investigate the relationship between the control system’s response time, the robot’s terminal velocity, and the limit interpolation point, an experiment was designed to have the robot’s gripper draw a circular trajectory on the drawing plane. The motion data were recorded and analyzed using ScopeView, a graphical output analysis tool in Beckhoff’s PC-based control software TwinCAT3. The experimental equipment primarily consists of a 6-DOF Industrial Robot, Beckhoff Controller, Air Pump, Drawing Platform, etc., as shown in Fig. 6(a). During the experiment, the controller directs the robot to draw the circular trajectory on the platform, as shown in Fig. 6(b).
Limit interpolation point exploration experiment.

The steps of the experiment are as follows:
(1) To obtain the robot’s motion trajectory, a cylinder with a diameter of 8 mm and a height of 25 mm was modeled in 3D software, and a G-code program with varying interpolation points was generated using post-processing software.
(2) Position the drawing platform at the designated measurement location based on the robot’s origin and adjust it horizontally.
(3) Create a new project, Scope YT project, using ScopeView in TwinCAT3, and add variable parameters for the speed and position of the X and Y axes in the Cartesian coordinate system.
(4) Set the robot to its zero position and adjust the control system’s response time to 5 ms.
(5) During the experiment, the robot’s terminal velocity was varied from 40 to 500 mm/min, and all programs with different interpolation points were executed and recorded.
(6) Switch the system to configuration mode, adjust the response time to 10 ms, and repeat the above steps to complete the experiment.
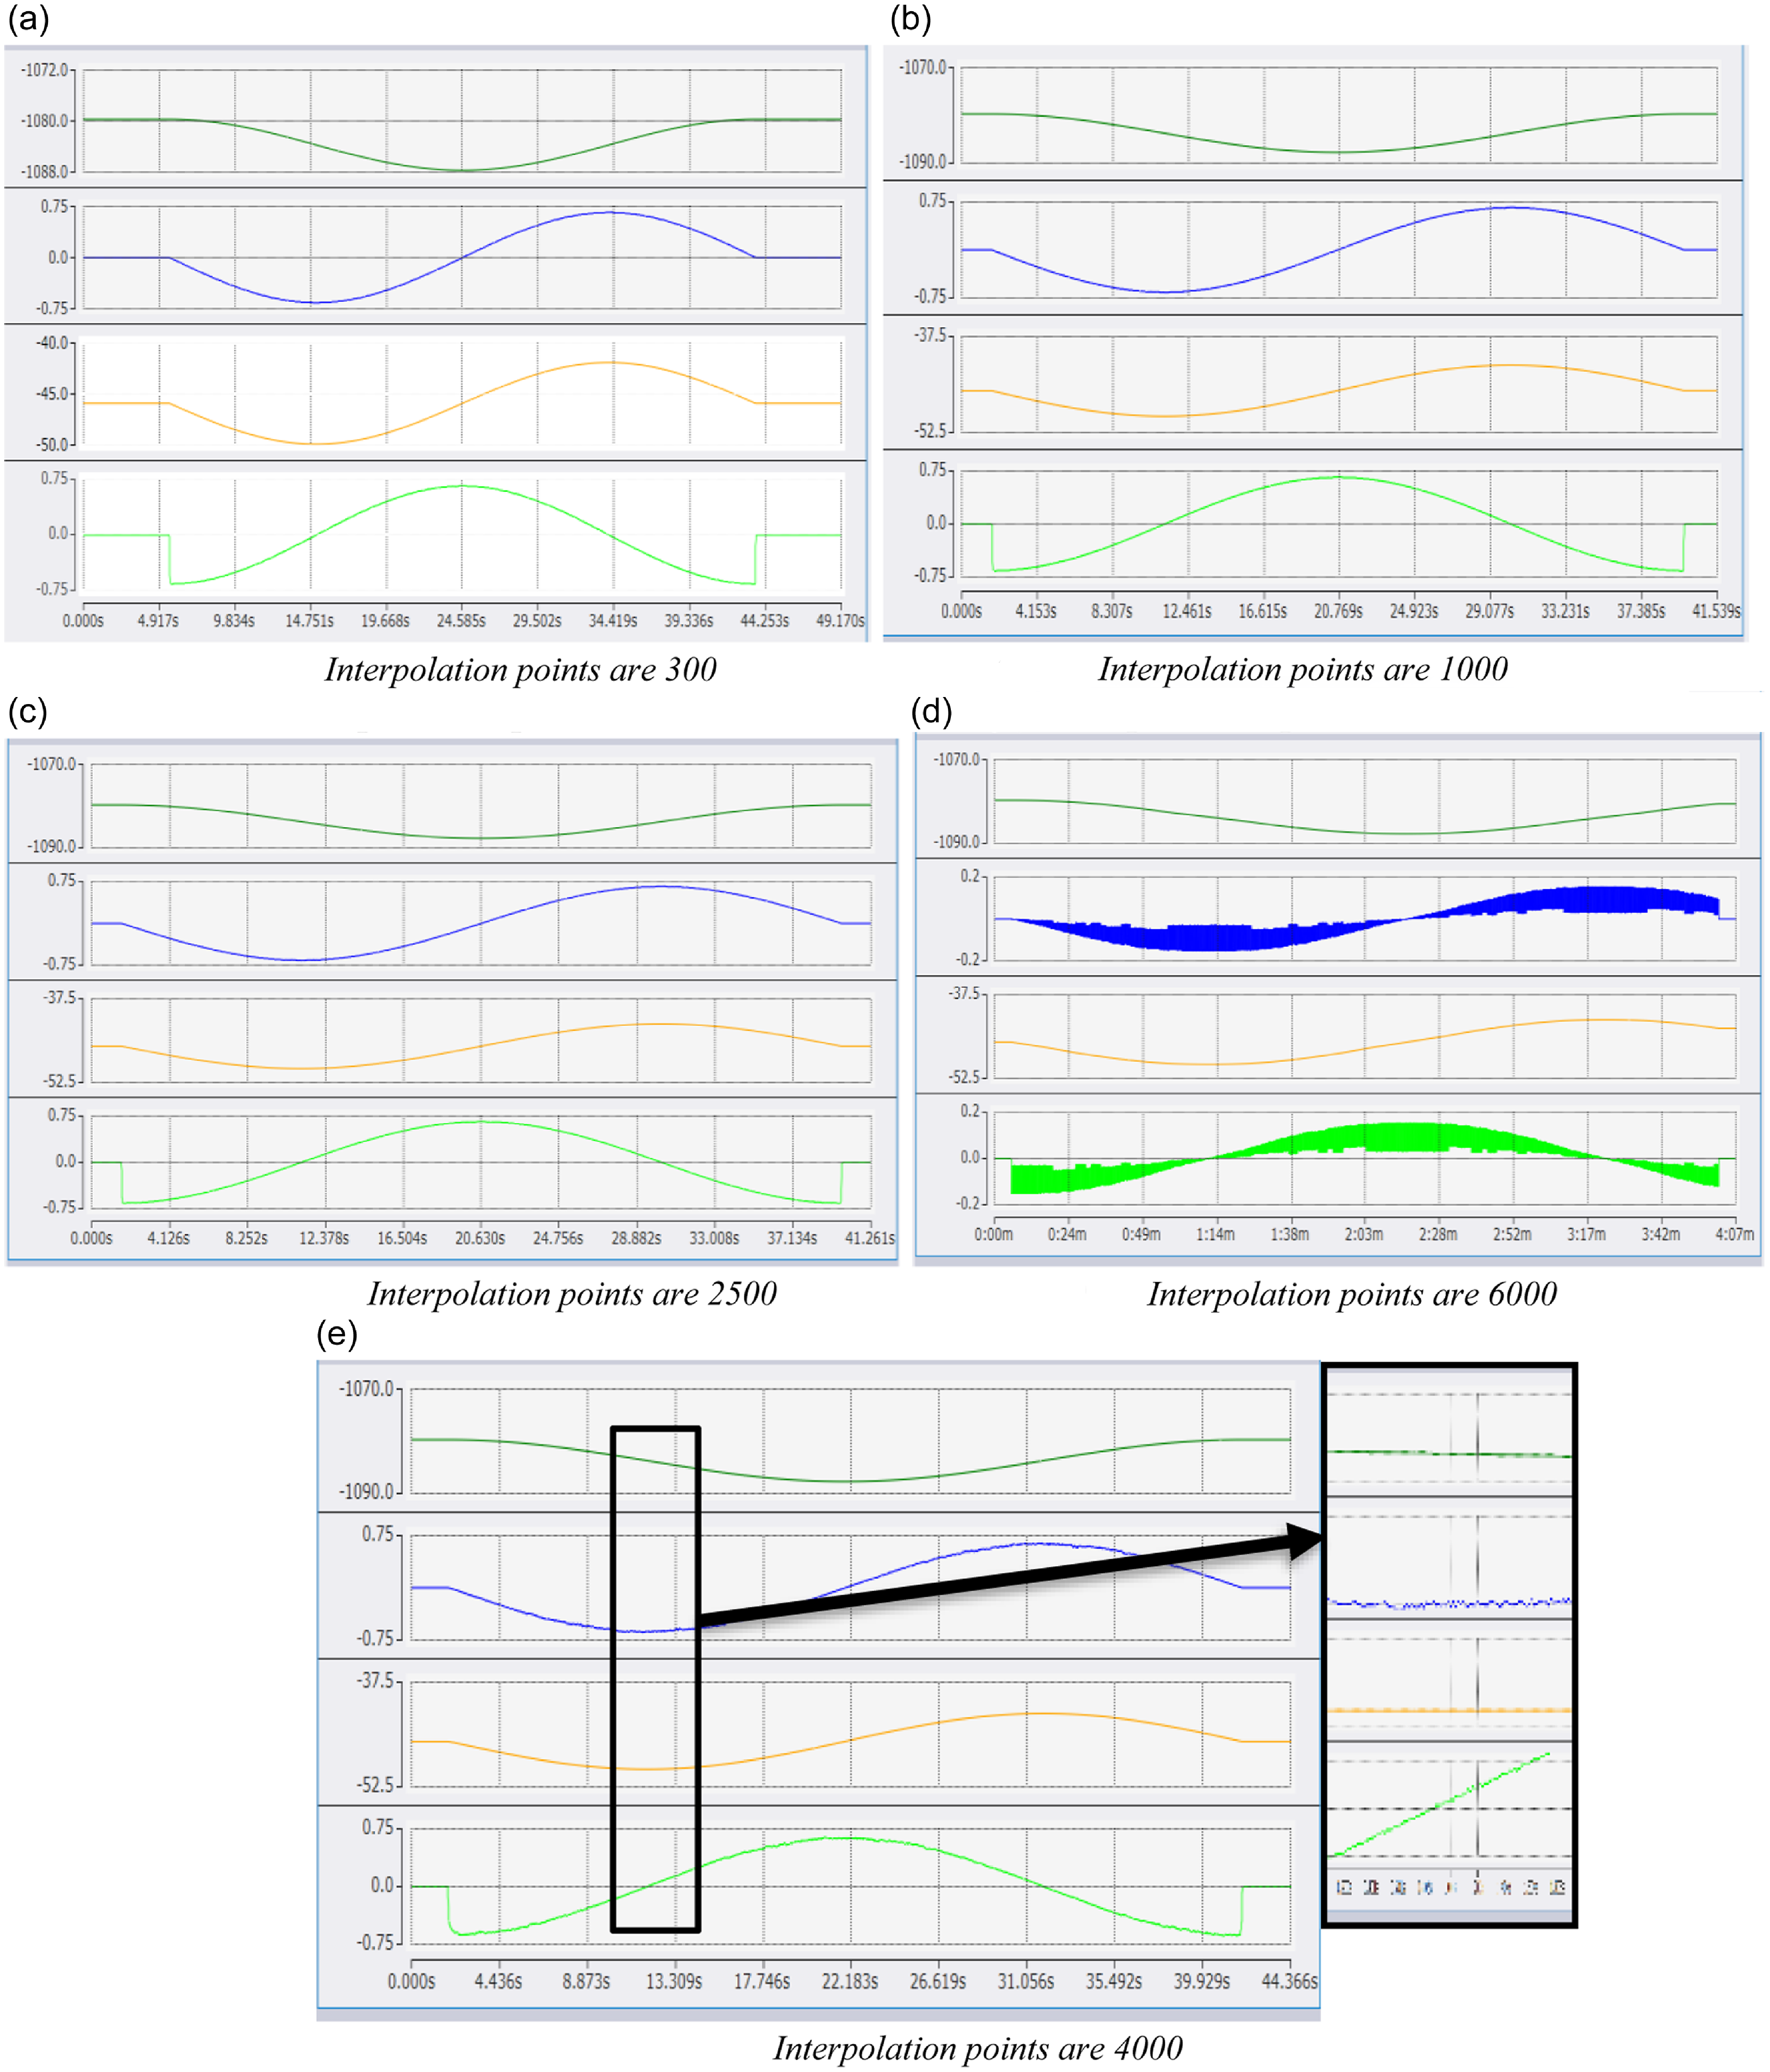
During the experiment, the changes in velocity and position of the robot’s end effector along the X and Y axes over time were recorded. For example, one set of data was collected under the conditions of a 10 ms control system response time and a robot’s terminal velocity of 40mm/min. The number of motion interpolation points was 300, 1000, 2500, 4000, and 6000, respectively, and the recorded data are shown in Fig. 7. In Fig. 7, the horizontal axis represents time, and the vertical axis represents displacement in the X, Y, and Z directions. (The axis labels for Figs. 12 and 13 are consistent with those in Fig. 7.)
Experimental data recording when the response time is 10 ms and the robot’s terminal velocity is 40 mm/min.

Figure 7 shows that the position and velocity curves for the X and Y axes in (a), (b), and (c) are relatively smooth, indicating that the robot did not exhibit jitter during the experiment. The blue and green lines in Fig. 7(d) represent the speed curves of the X and Y axes, respectively, and it can be observed that these two lines experienced severe shaking and partial missing. In Fig. 7(e), the overall motion curve appears relatively smooth, but upon magnification, it is evident that the velocity and position curves have fluctuated, and the motion time has increased. This indicates that the robot noticeably dithered as the number of interpolation points increased, resulting in unstable speed.
As indicated by Eq. (12), when the model diameter is 8 mm, the control system’s response time is 10 ms, and the robot’s terminal velocity is 40 mm/min, the number of limit interpolation points is 3769. Consequently, the motion in Fig. 7(a), (b), and (c) remains stable as it does not exceed the limited number of motion interpolation points. Figure 7(d) significantly exceeds the limit of interpolation points, resulting in the control system’s response time exceeding the limit, causing the robot’s movement to be out-of-step and exhibit drastic fluctuations. Figure 7(e) slightly exceeds the limit of interpolation points, leading to jitter.
4.2 Analysis of experimental data
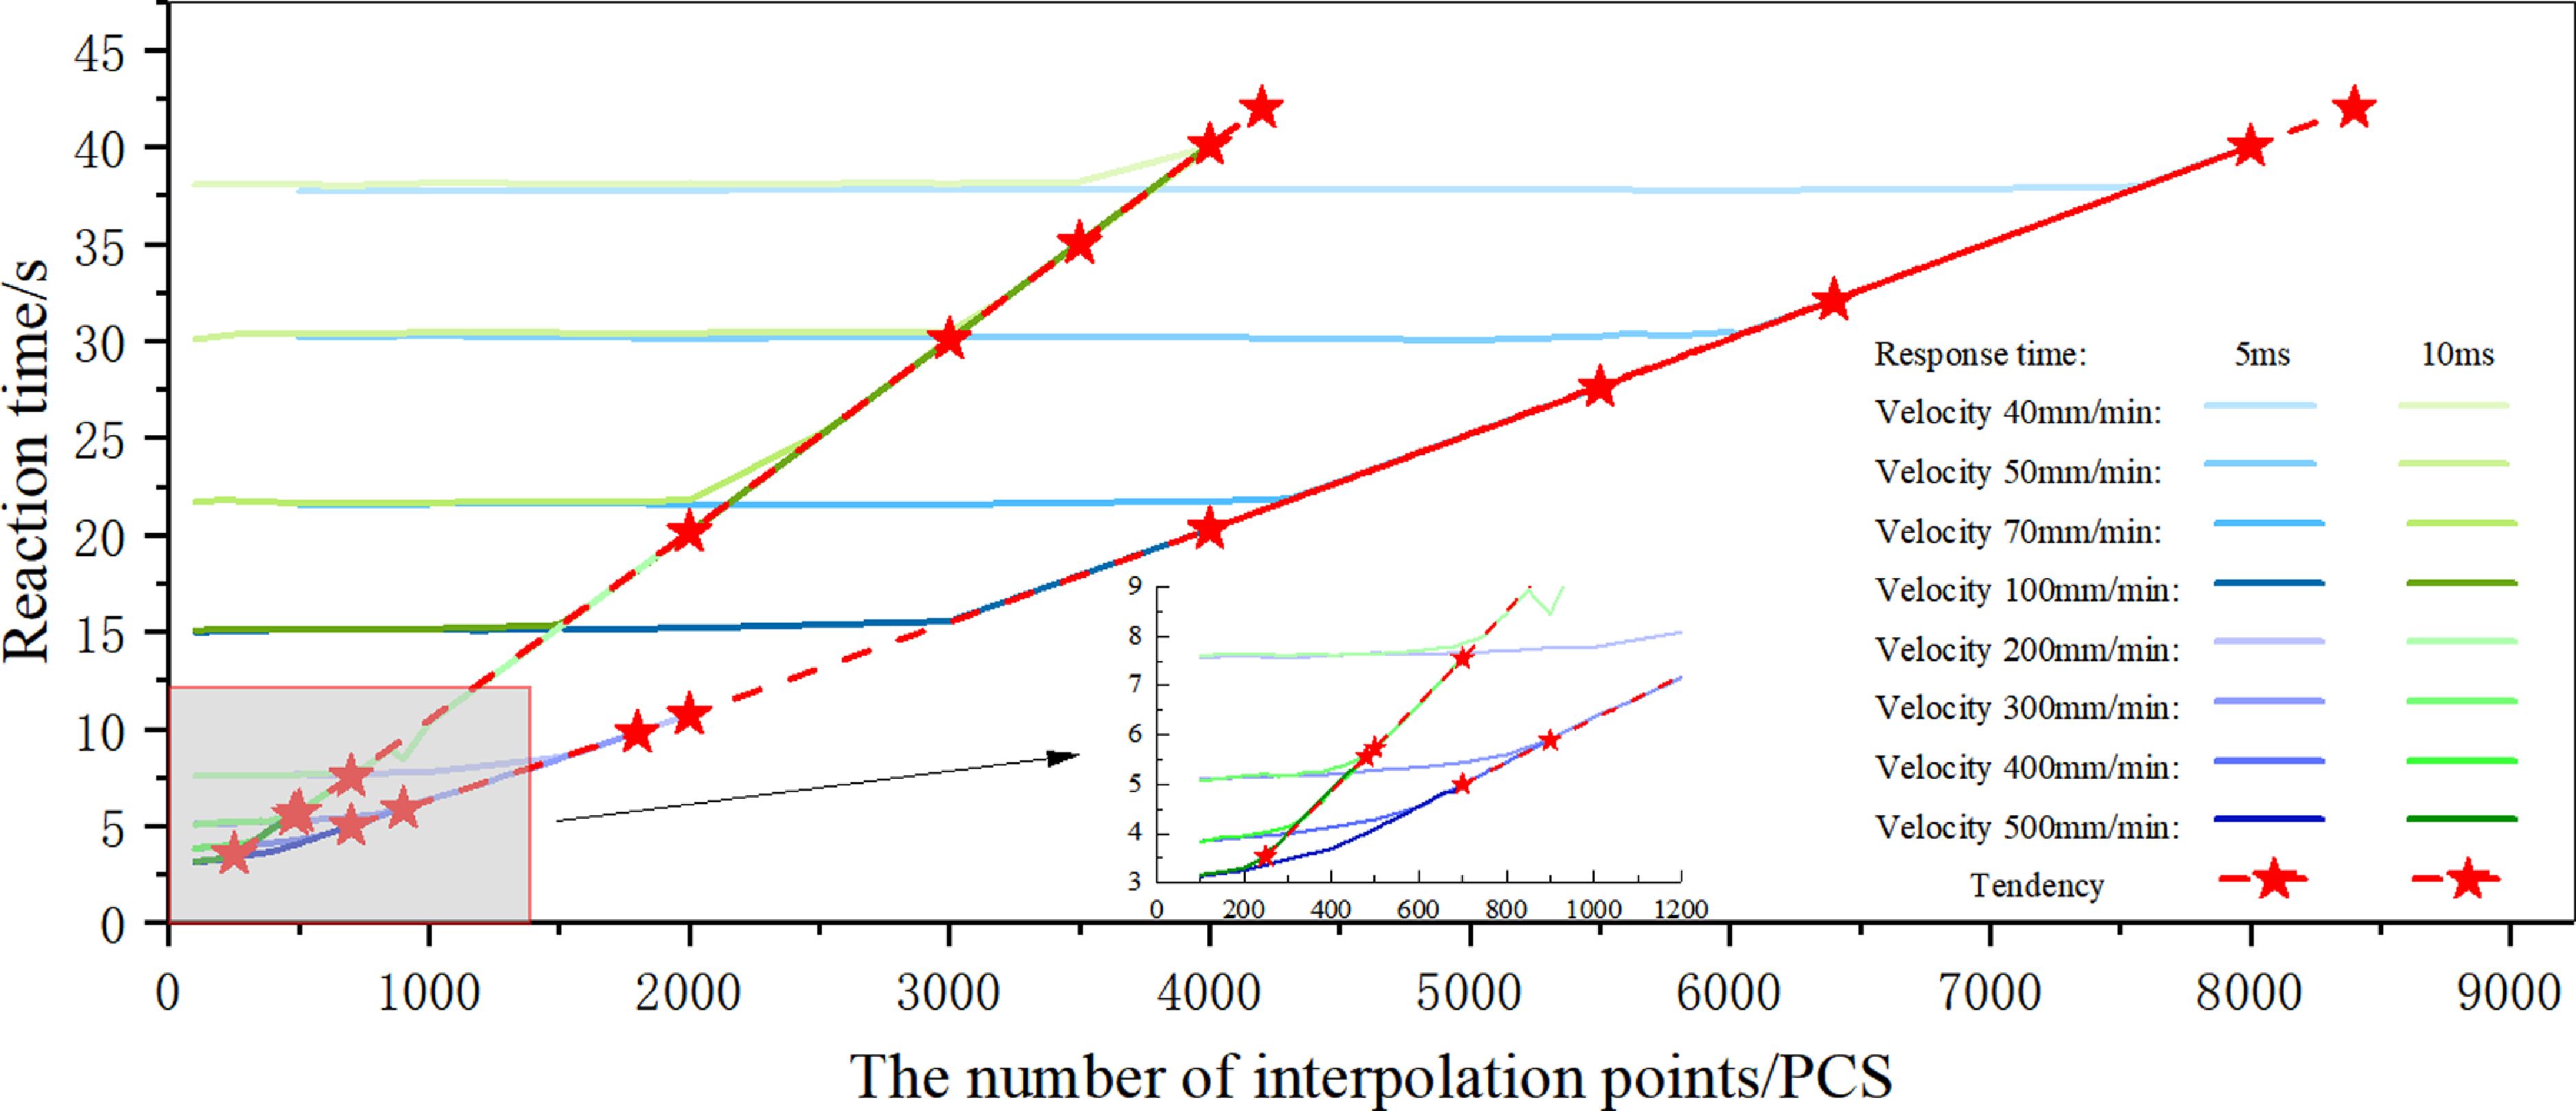
After all experiments are completed and experimental data are recorded, the data are divided into two categories based on the control system’s response times. One category corresponds to a control system’s response time of 5 ms, while the other corresponds to 10 ms, with the robot’s terminal velocity incrementally varying from 40 to 500 mm/min. The data from both categories were compiled to create Fig. 8. In Fig. 8, the vertical axis represents the reaction time of the interpolation velocity, which is the time taken for the robot’s end to move along an 8 mm diameter circular path at different speeds over one cycle, and the horizontal axis represents the number of interpolation points the robot moves during actual motion. When the control system’s response time is 5 ms, the different robot terminal velocities are represented by 8 lines ranging from blue to purple; when the control system’s response time is 10 ms, the different robot terminal velocities are represented by various shades of green; the two red lines represent the predicted limit interpolation points for a specific robot’s terminal velocity under different control system’s response time.
The relationship between the number of interpolation points and the reaction time for different response times.

As observed from the curves of different speeds in Fig. 8:
(1) With the same response time and at a certain velocity, the reaction time remains relatively constant initially as the number of interpolation points increases, but once the limit is reached, the reaction time increases linearly with further increases in the number of interpolation points.
(2) With the same response time, the number of limit interpolation points decreases as the robot’s terminal velocity increases.
(3) Compared to a control system’s response time of 5 ms, the number of interpolation points for a response time of 10 ms, at the same robot’s terminal velocity, is reduced.
(4) The number of limit interpolation points at different speeds is approximately fitted to a straight line, so that the number of limit interpolation points presents a linear distribution.
(5) As the control system’s response time increases, the linear slope of the limit interpolation point distribution becomes steeper.
4.3 Error analysis of theoretical and practical limit interpolation points
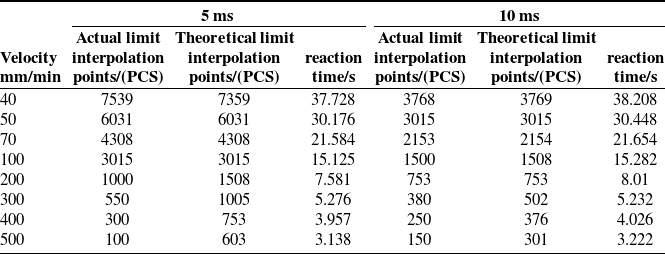
Based on the data organized in Section 4.2, the reaction time and limit interpolation points from the experimental data were extracted, and the theoretical reaction time and limit interpolation points were calculated using Eq. (12). After performing the calculations and organizing the data, the results are shown in Table I.
Limit interpolation points and reaction time under 5 and 10 ms response time.

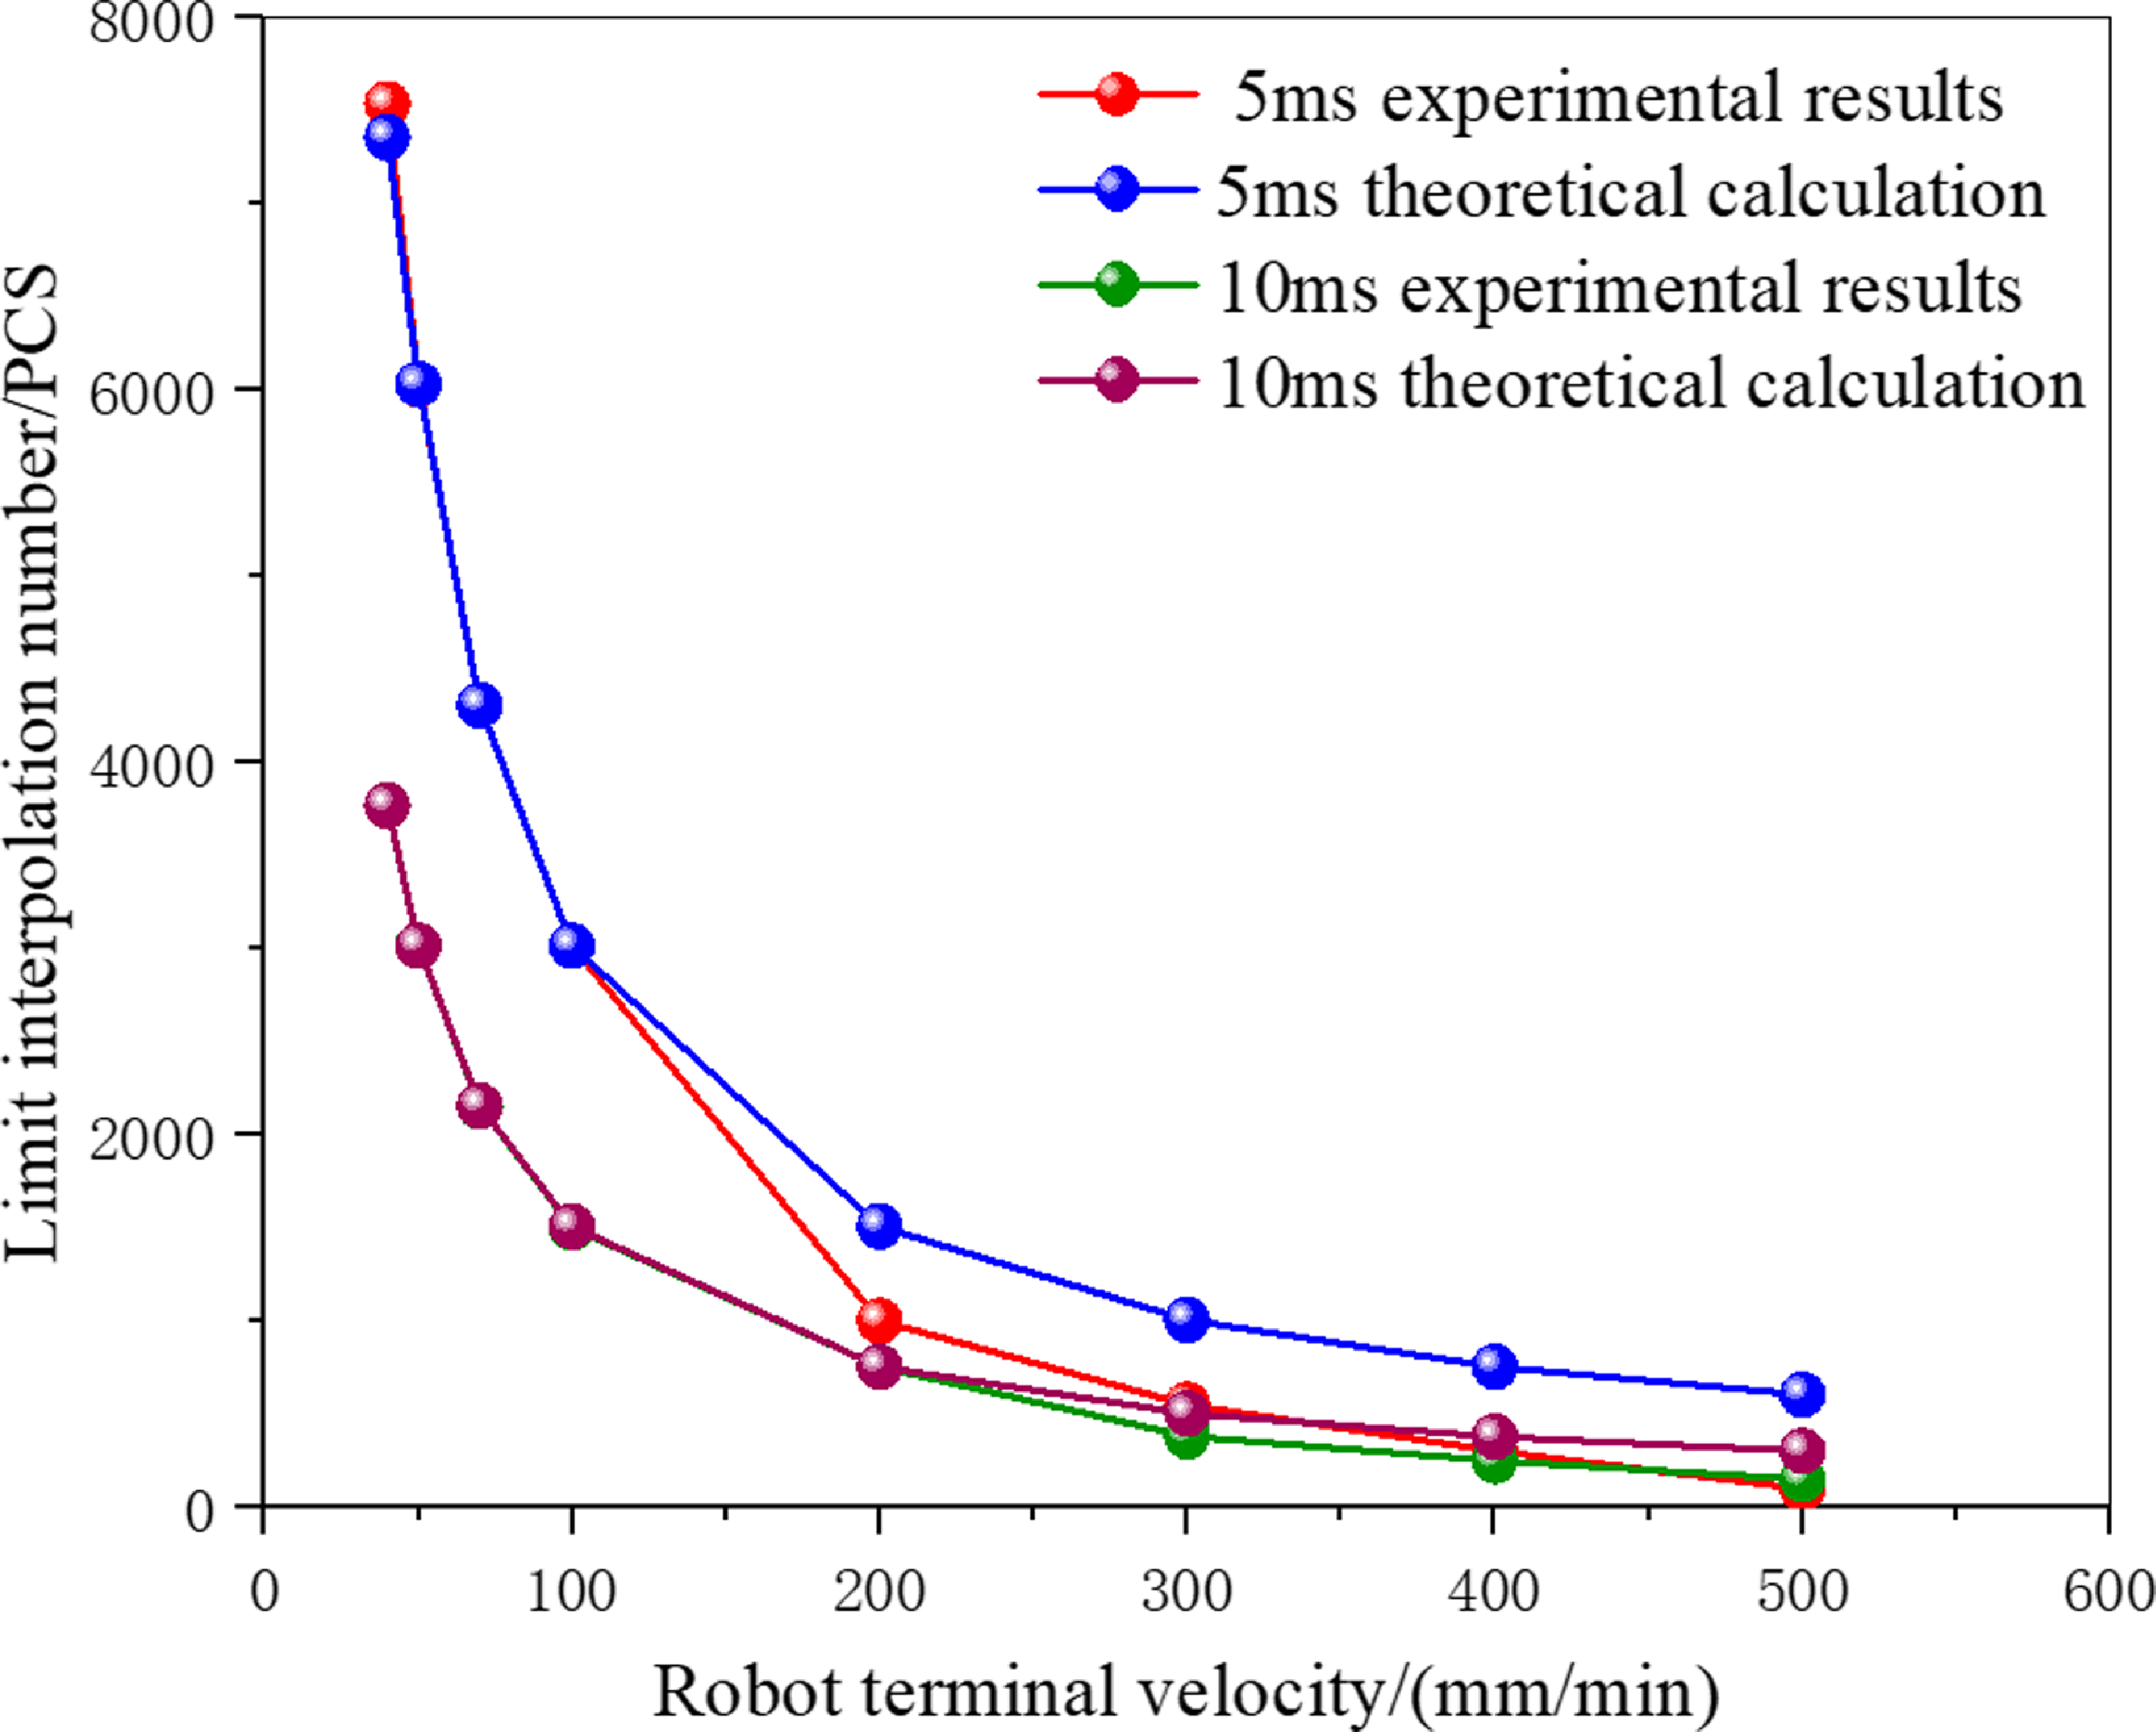
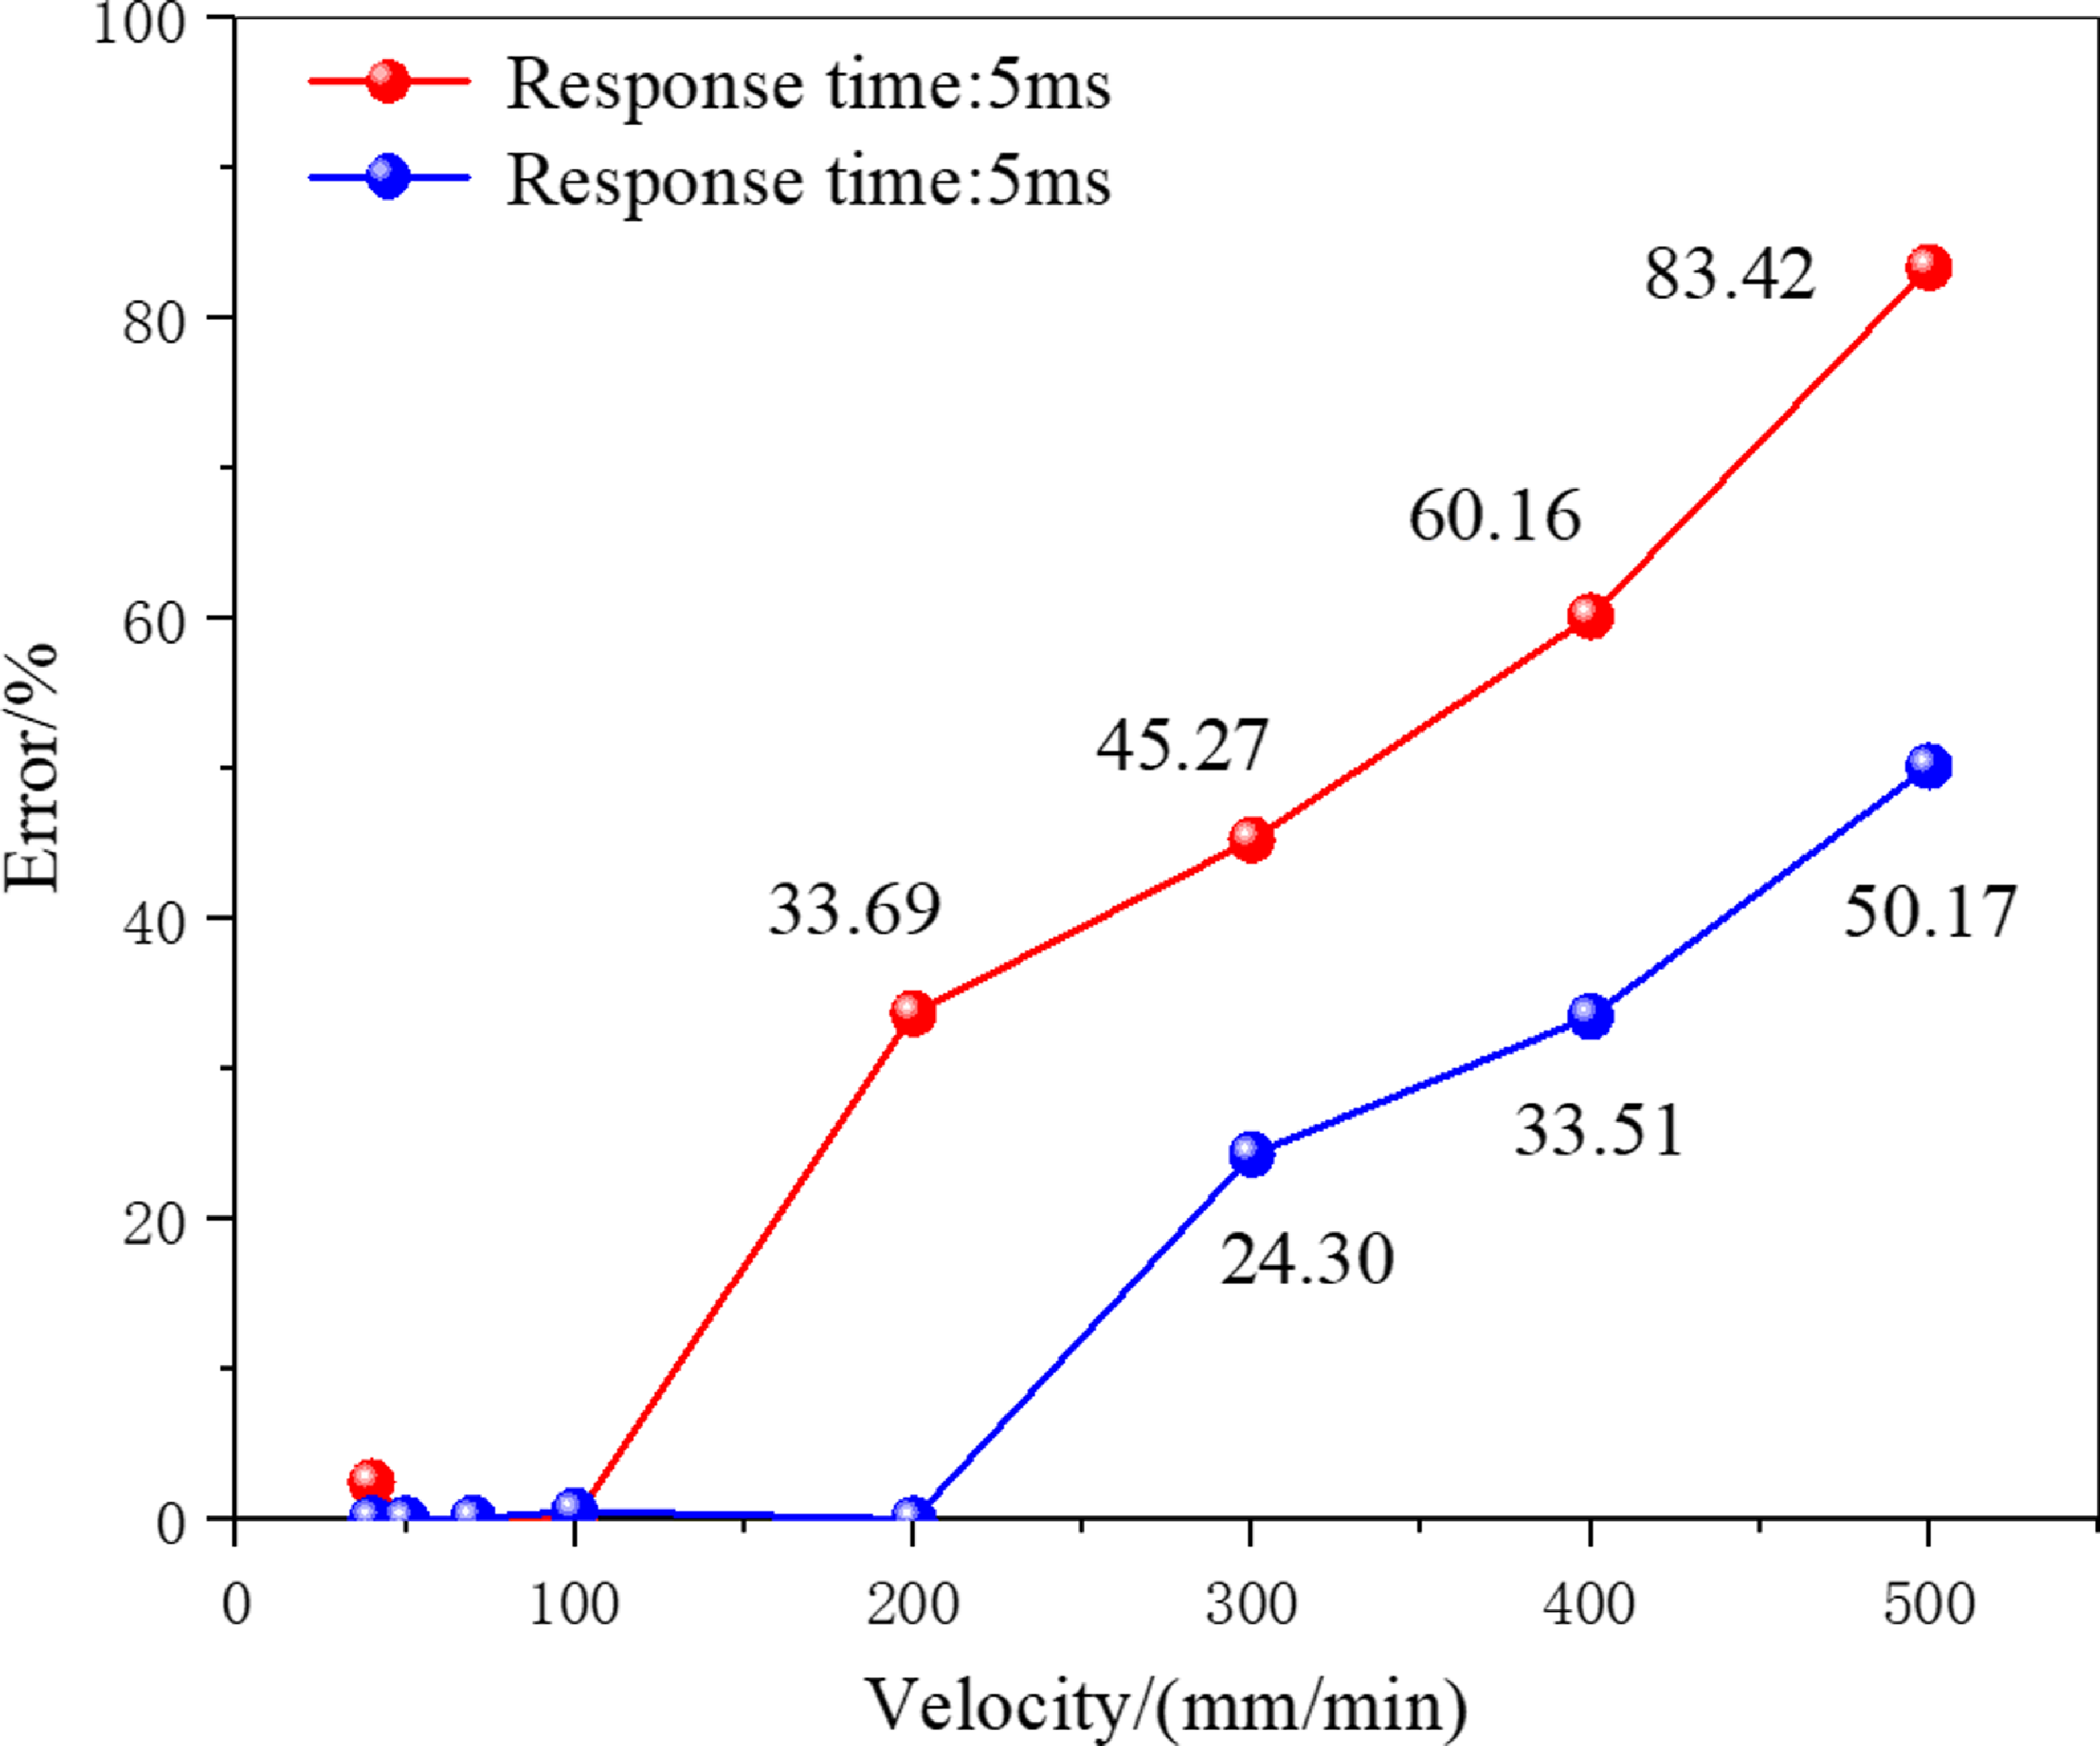
The data in Table I were fitted into a graph, with the robot’s terminal velocity as the independent variable and the experimental and theoretical values of the limit interpolation points under different control system’s response times as the dependent variable, resulting in the line chart shown in Fig. 9. The error between the experimental and theoretical values of the limit interpolation point under different control system’s response time is shown in Fig. 10.
Relationship between terminal velocity and limit interpolation points.

Error diagram between experimental results and theoretical calculation under different response time.

According to the fitted curve in Fig. 9 and the error curve in Fig. 10, it is evident that when the control system’s response time is 5 ms and the robot’s terminal velocity is within 100 mm/min, the number of limit interpolation points can be more accurately calculated using Eq. (12). When the speed exceeds 100 mm/min, the equation does not accurately calculate the number of limit interpolation points. When the control system’s response time is 10 ms, the theoretical calculation of the robot’s terminal velocity is more accurate within 200 mm/min. When the speed exceeds 200 mm/min, significant errors occur, necessitating the use of alternative prediction methods.
5. Limit interpolation point prediction model based on least square method
To more accurately predict the relationship between the control system’s response time, robot’s terminal velocity, and the limit interpolation points, a prediction model for limit interpolation points was developed using the least squares method, and the model’s accuracy was validated.
5.1 Establishment of prediction model
As the same response time but different reaction time, the number of limit interpolation points is linearly distributed along a straight line. After organizing the data along the trend line, the results are presented in Tables II and 3.
Limit interpolation points and reaction time under 5 ms response time.

Limit interpolation points and reaction time under 10 ms response time.

According to the principles of the least square method, let the trend curve expression be
 $\mathit{t}=\mathit{m}+b$
, then the best estimate of a and b can be expressed as:
 \begin{align} \hat{\mathrm{a}}=\frac{\mathrm{N}\left(\sum \mathrm{m}_{\mathrm{i}}\mathrm{t}_{\mathrm{i}}\right)-\left(\sum \mathrm{m}_{\mathrm{i}}\right)\left(\sum \mathrm{t}_{\mathrm{i}}\right)}{\mathrm{N}\left(\sum \mathrm{m}_{\mathrm{i}}^{2}\right)-\left(\sum \mathrm{m}_{\mathrm{i}}\right)^{2}} \end{align}
 \begin{align} \hat{\mathrm{b}}=\frac{\left(\sum \mathrm{m}_{\mathrm{i}}^{2}\right)\left(\sum \mathrm{t}_{\mathrm{i}}\right)-\left(\sum \mathrm{m}_{\mathrm{i}}\right)\left(\sum \mathrm{m}_{\mathrm{i}}\mathrm{t}_{\mathrm{i}}\right)}{\mathrm{N}\left(\sum \mathrm{m}_{\mathrm{i}}^{2}\right)-\left(\sum \mathrm{m}_{\mathrm{i}}\right)^{2}} \\[8pt]\nonumber\end{align}
where t represents the reaction time, m represents the number of limit interpolation points, and i ranges from 1 to 8.
The trend curve for a response time of 5 ms is
 $t_{1}$
, and the trend curve for a response time of 10 ms is
 $t_{2}$
, then,
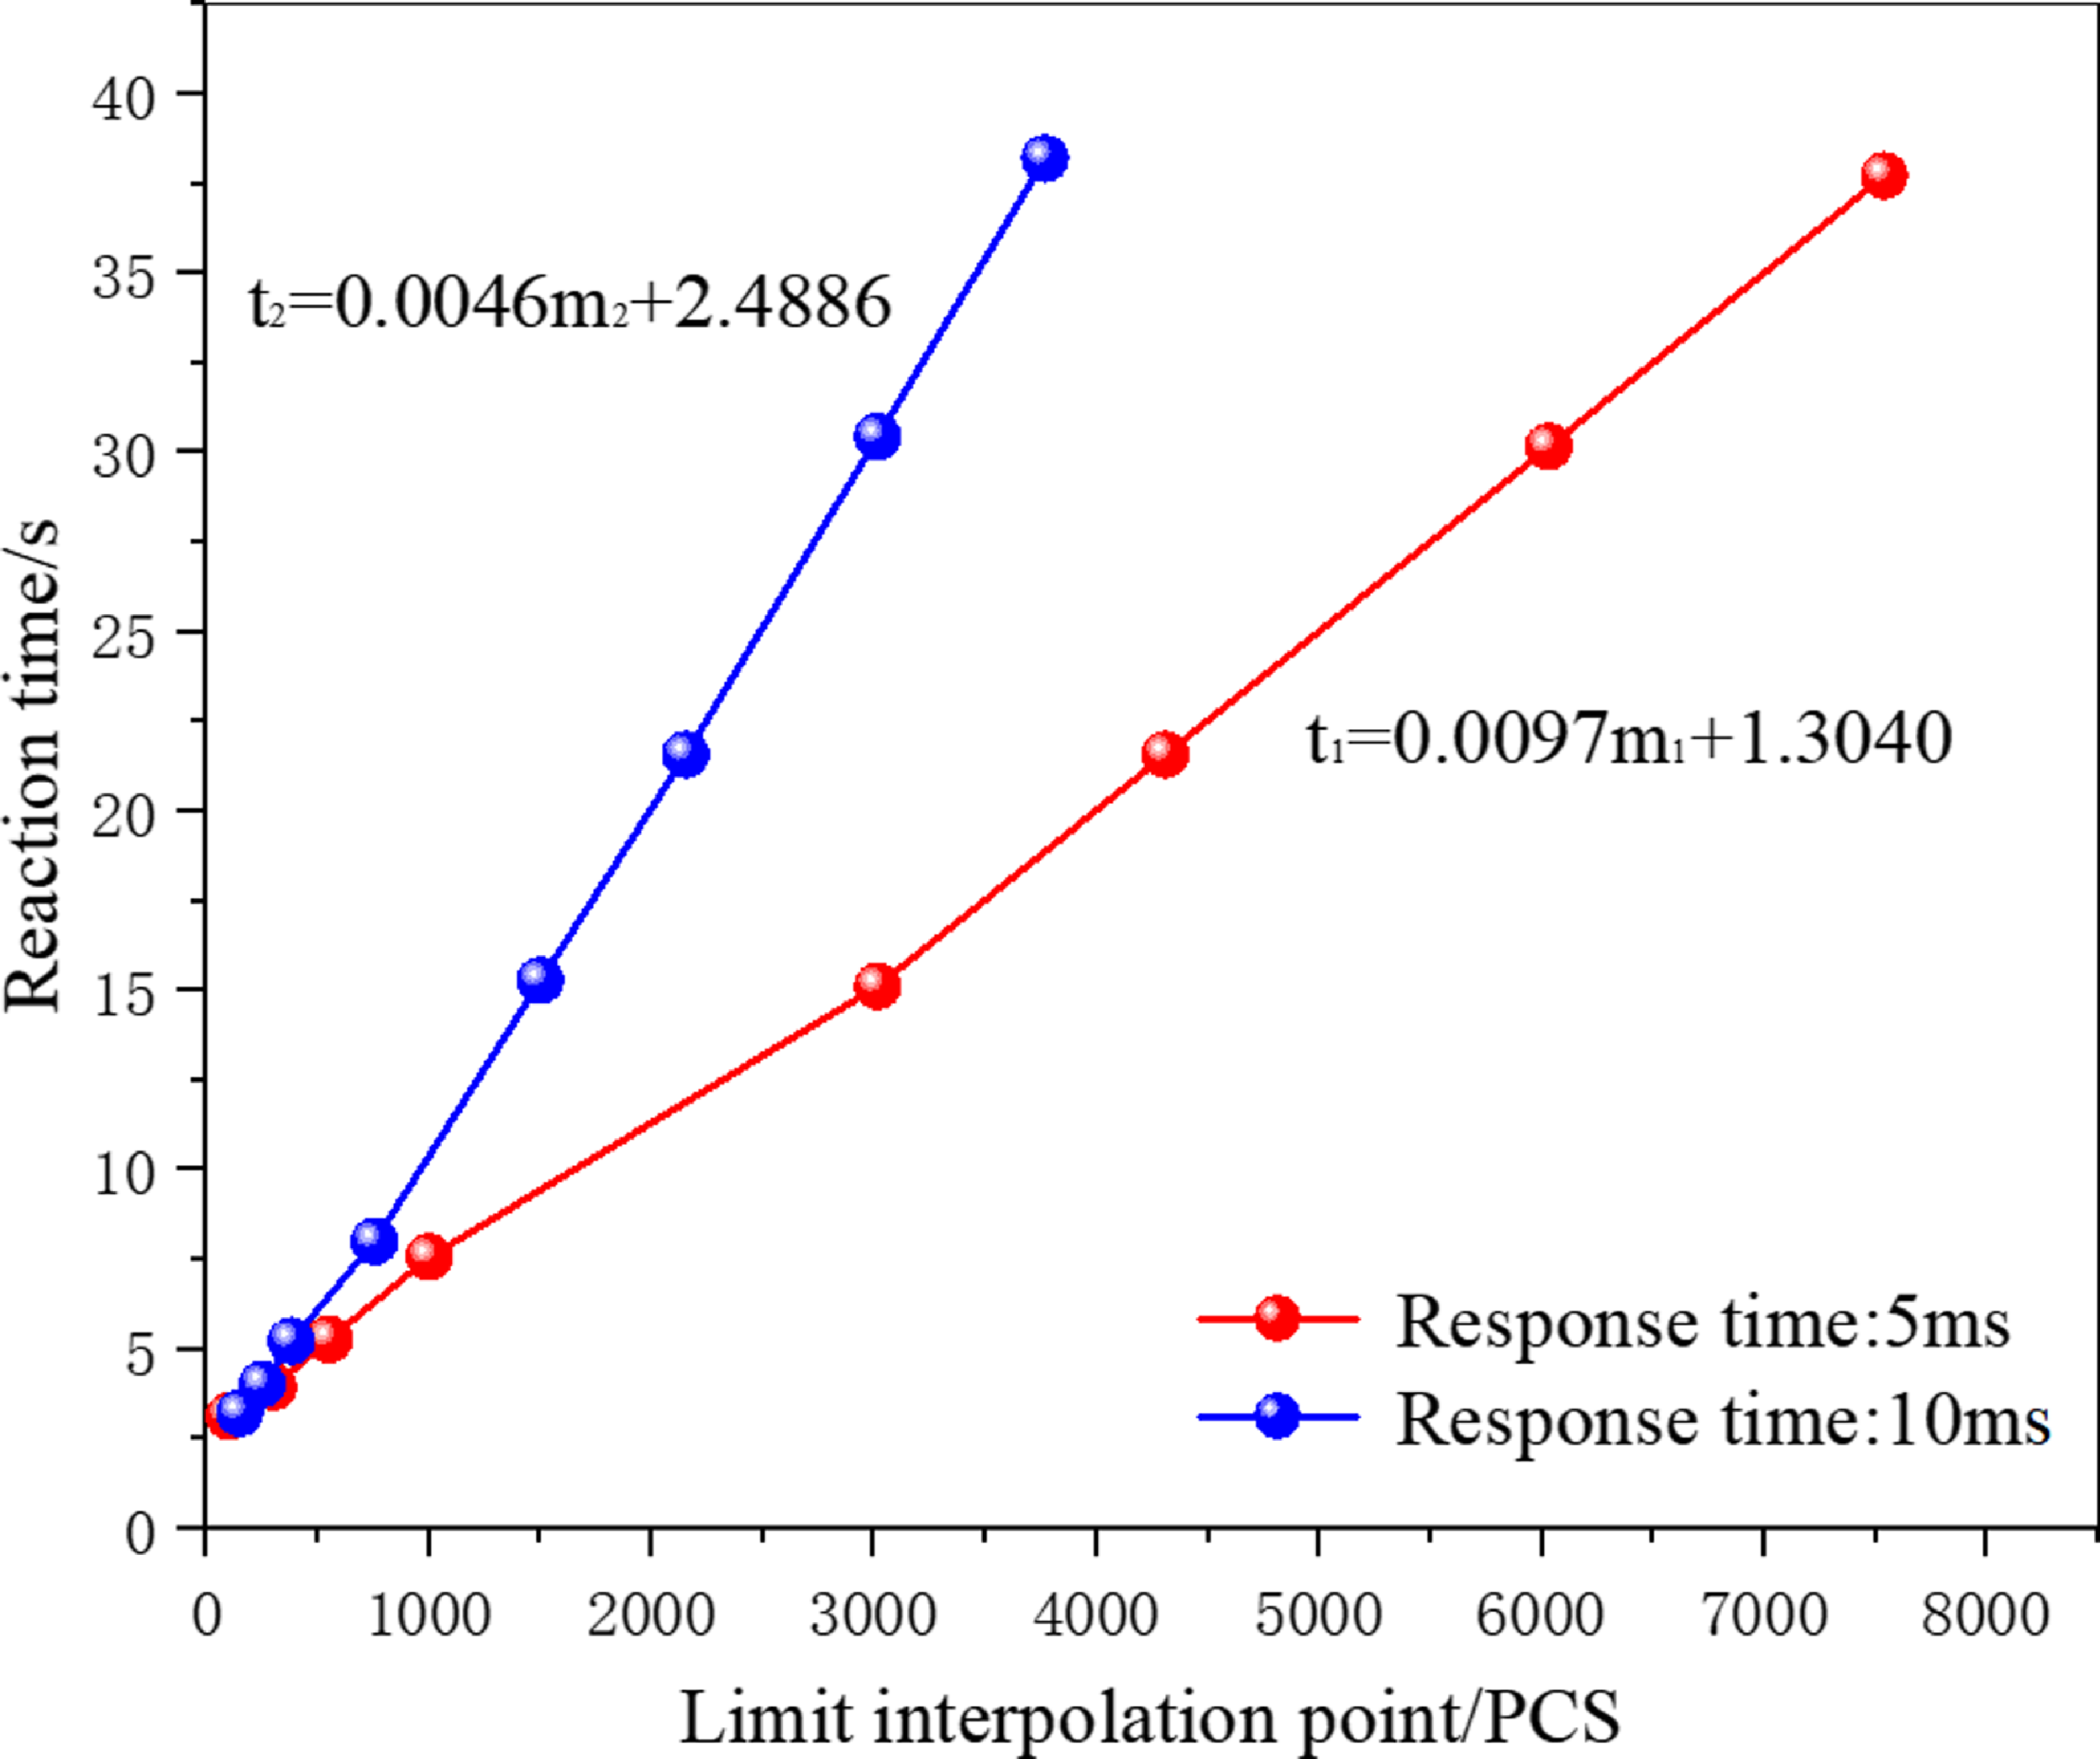
 \begin{align} \mathrm{t}_{1}=\mathrm{a}_{1}\mathrm{m}_{1}+\mathrm{b}_{1}\underset{}{\Rightarrow }\begin{cases} \mathrm{a}_{1}=0.0097\\ \mathrm{b}_{1}=1.3040 \end{cases} \underset{}{\Rightarrow }\mathrm{m}_{1}=\frac{\mathrm{t}_{1}-1.3040}{0.0097} \end{align}
 \begin{align} \mathrm{t}_{2}=\mathrm{a}_{2}\mathrm{m}_{2}+\mathrm{b}_{2}\underset{}{\Rightarrow }\begin{cases} \mathrm{a}_{2}=0.0046\\ \mathrm{b}_{2}=2.4886 \end{cases} \underset{}{\Rightarrow }\mathrm{m}_{2}=\frac{\mathrm{t}_{2}-2.4886}{0.0046} \\[8pt]\nonumber\end{align}
Linear fitting was performed on the trend curves for response times of 5 and 10 ms, respectively, as shown in Fig. 11.
Fitting curve of reaction time and limit interpolation point.

In order to facilitate engineering applications, particularly in real-time control of numerical control systems, the two fitting equations can be approximated using the linear equation from Eq. (17), considering the characteristics of the relationship between the control system’s response time, the robot’s terminal velocity, and the limit interpolation point.
 \begin{equation} \mathrm{m}=\frac{\mathrm{t}-0.2548\mathrm{k}}{0.0475/\mathrm{k}} \end{equation}
where k is the response time.
According to the relationship between the optimized control system’s response time, the robot’s terminal velocity, and the limit interpolation point, the following conclusions can be drawn:
(1) As the control system’s response time increases, the slope of the prediction line for the distribution of limit interpolation points becomes steeper, corresponding to a multiple of the response time.
(2) Within the same control system’s response time, as the number of motion interpolation points increases, the reaction time also increases.
(3) As the control system’s response time increases, the robot’s end effector moves along the same trajectory at the same velocity with fewer interpolation points.
(4) Within the same control system’s response time, there is a limit interpolation point for each robot’s terminal velocity. When this limit interpolation point is exceeded, the reaction time of the robot’s terminal velocity becomes variable and slows down.
(5) Within the same control system’s response time, the number of limit interpolation points at different velocities forms a straight line, indicating a linear distribution. Therefore, knowing the robot’s terminal velocity and the reaction time of the trajectory at this velocity allows us to predict the number of limit interpolation points.
5.2 Prediction model verification
When the control system’s response time is 10 ms and the robot’s terminal velocity is 500mm/min, the limit interpolation points can be derived from Eq. (17) as follows:
 \begin{equation*} m=\frac{t-0.2548\mathrm{k}}{0.0475/k}=\frac{3.222-2.548}{0.00475}=142 \end{equation*}
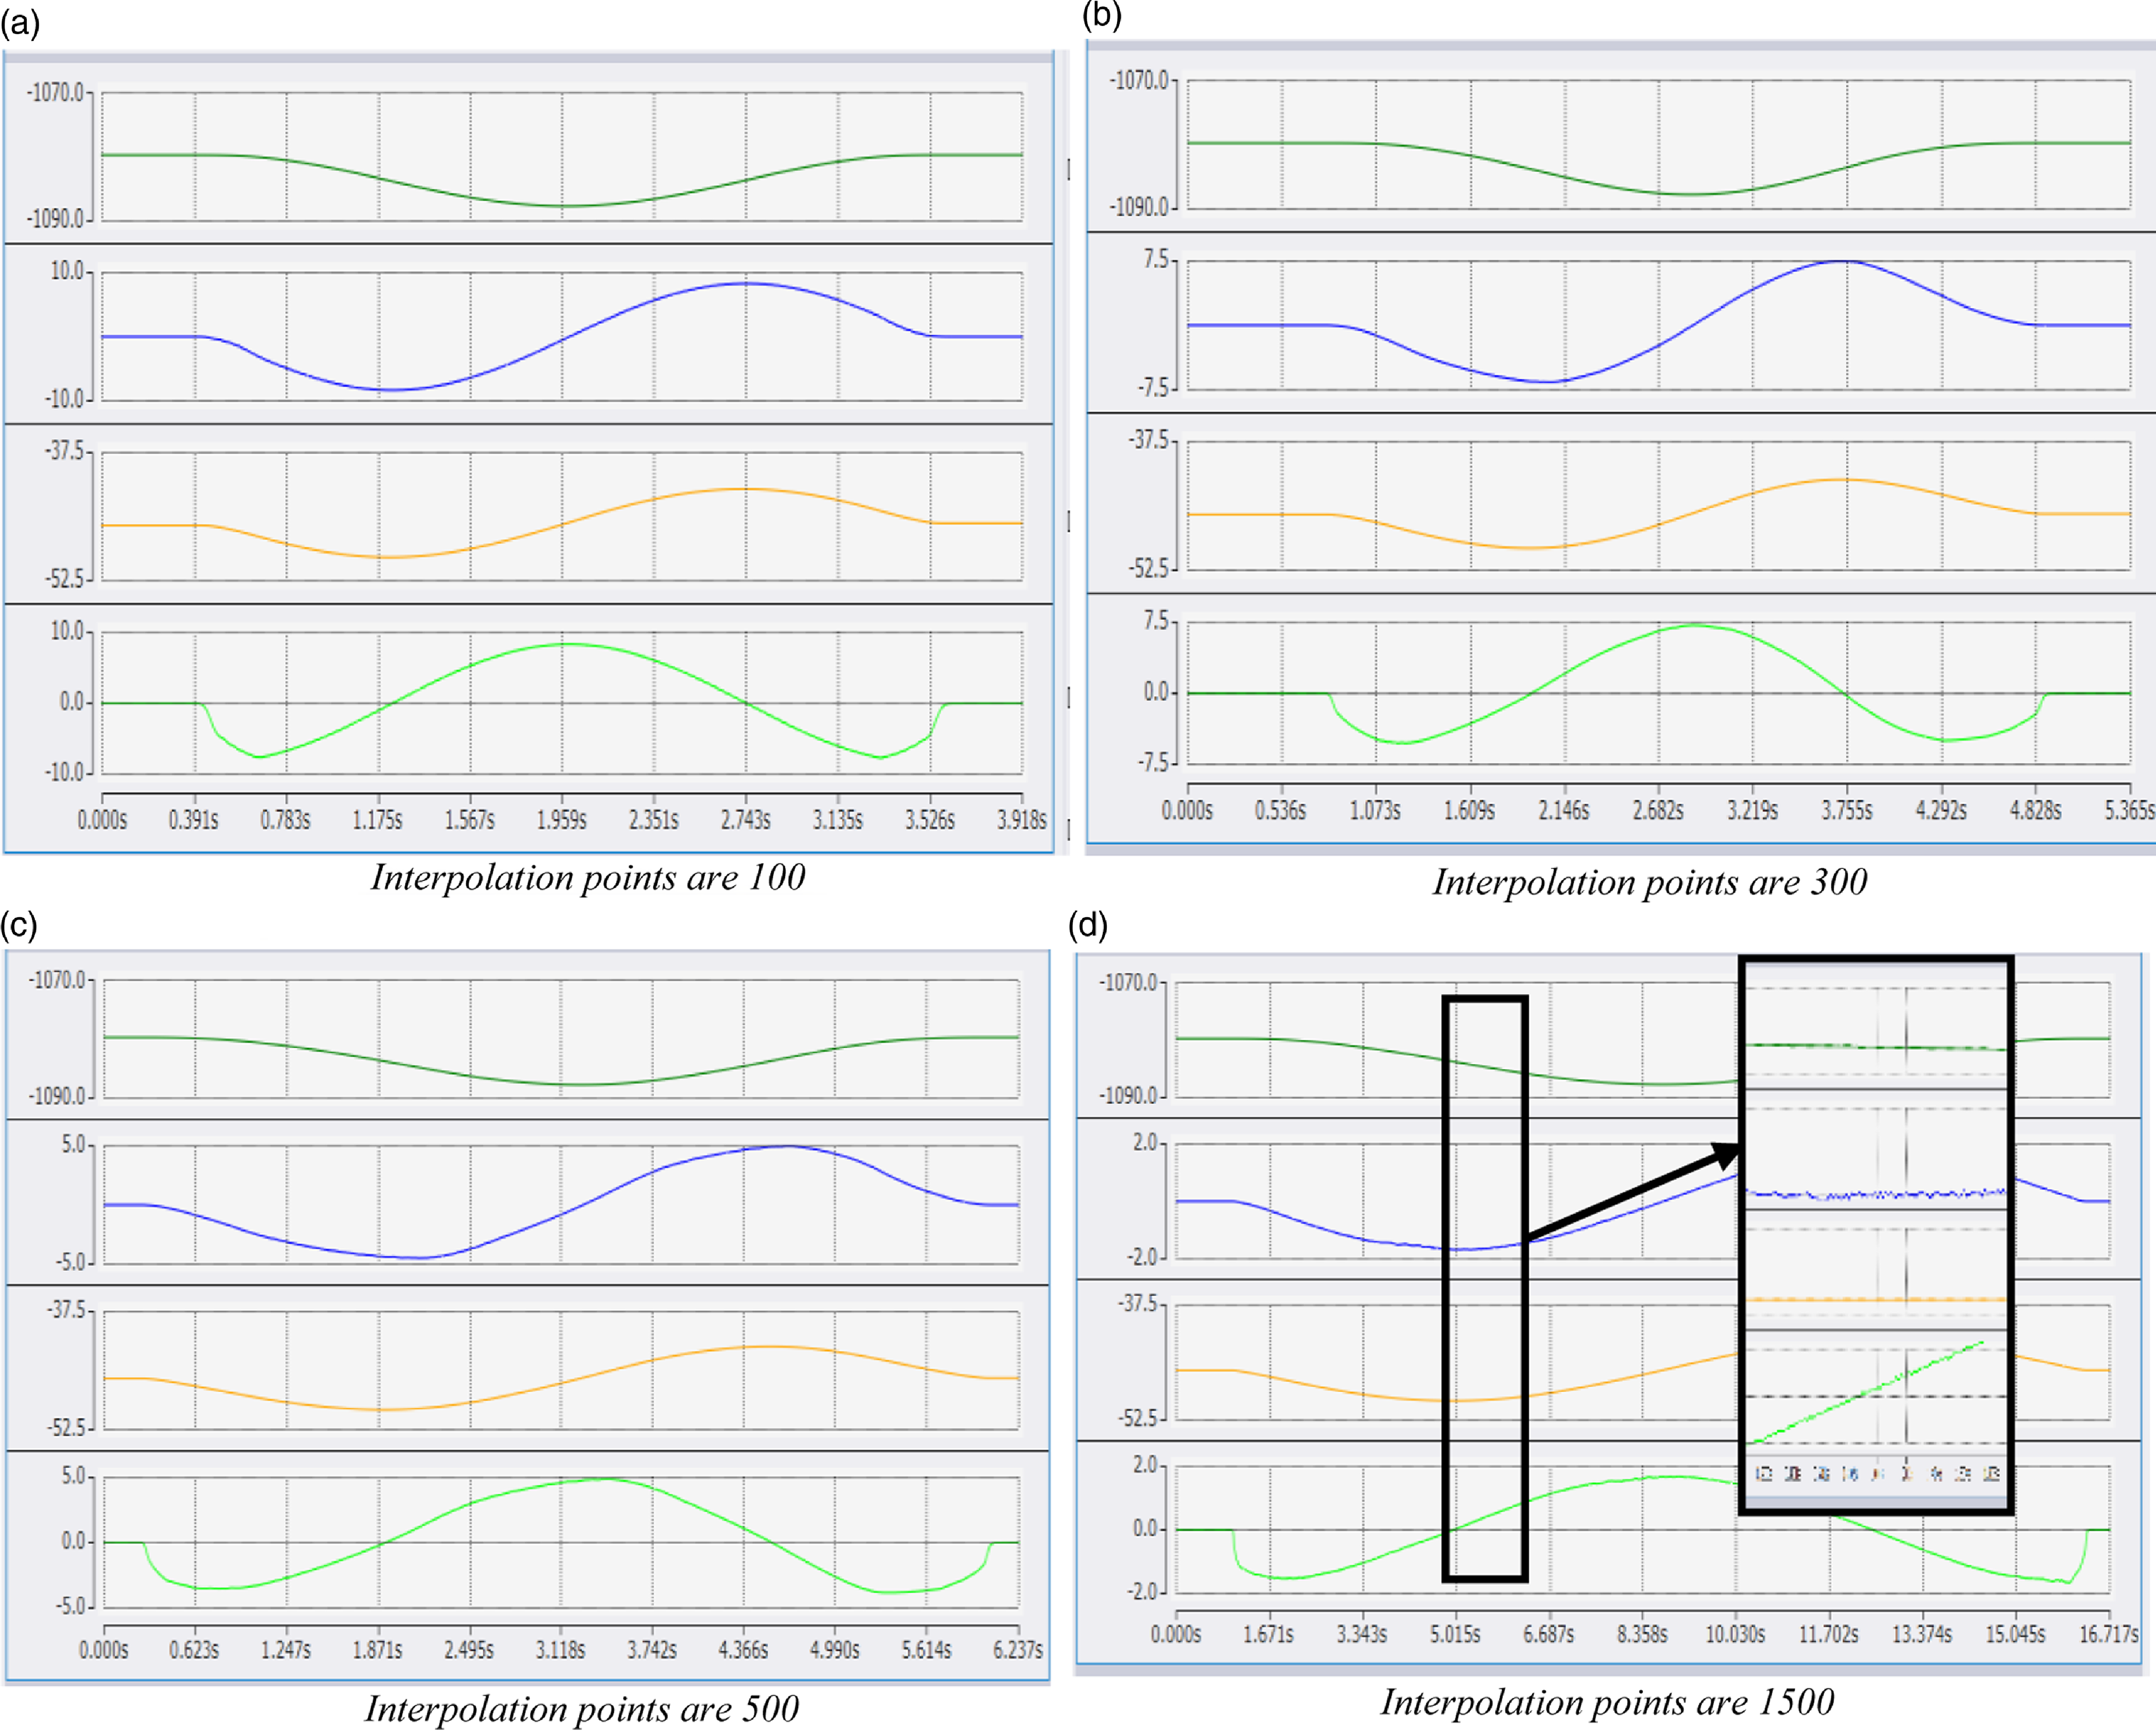
By setting the number of motion interpolation points to 100, 300, 500, and 1500, respectively, the speed and position of the manipulator’s end effector in the X and Y axes direction can be obtained, as shown in Fig. 12.
Experimental data recording when the response time is 10 ms and the robot’s terminal velocity is 500 mm/min.

From Eq. (17), it is calculated that when the control system’s response time is 10 ms and the robot’s terminal velocity is 500 mm/min, the number of theoretical limit interpolation points is 142. Consequently, the speed and position curves for X and Y axes in Fig. 12(a) are relatively smooth, indicating that the robot does not exhibit jitter during the experiment. In the locally enlarged view of Fig. 12(d), it is evident that the X and Y axes velocity curves exhibit jitter, as the number of interpolation points has exceeded ten times of the theoretical limit interpolation points, leading to noticeable jitter during motion and unstable velocity. Although the number of interpolation points in Fig. 12(b) and (c) exceeds the theoretical limit interpolation points, no jitter is observed in the velocity curve due to the set motion velocity. However, the reaction time of the robot’s terminal velocity in Fig. 12(b) and (c) is 4.073 and 5.552 s, respectively. Compared to the theoretical limit interpolation points, the reaction time is significantly increased, indicating that the control system’s response time has exceeded the limit, which will affect the stability of the system’s performance.
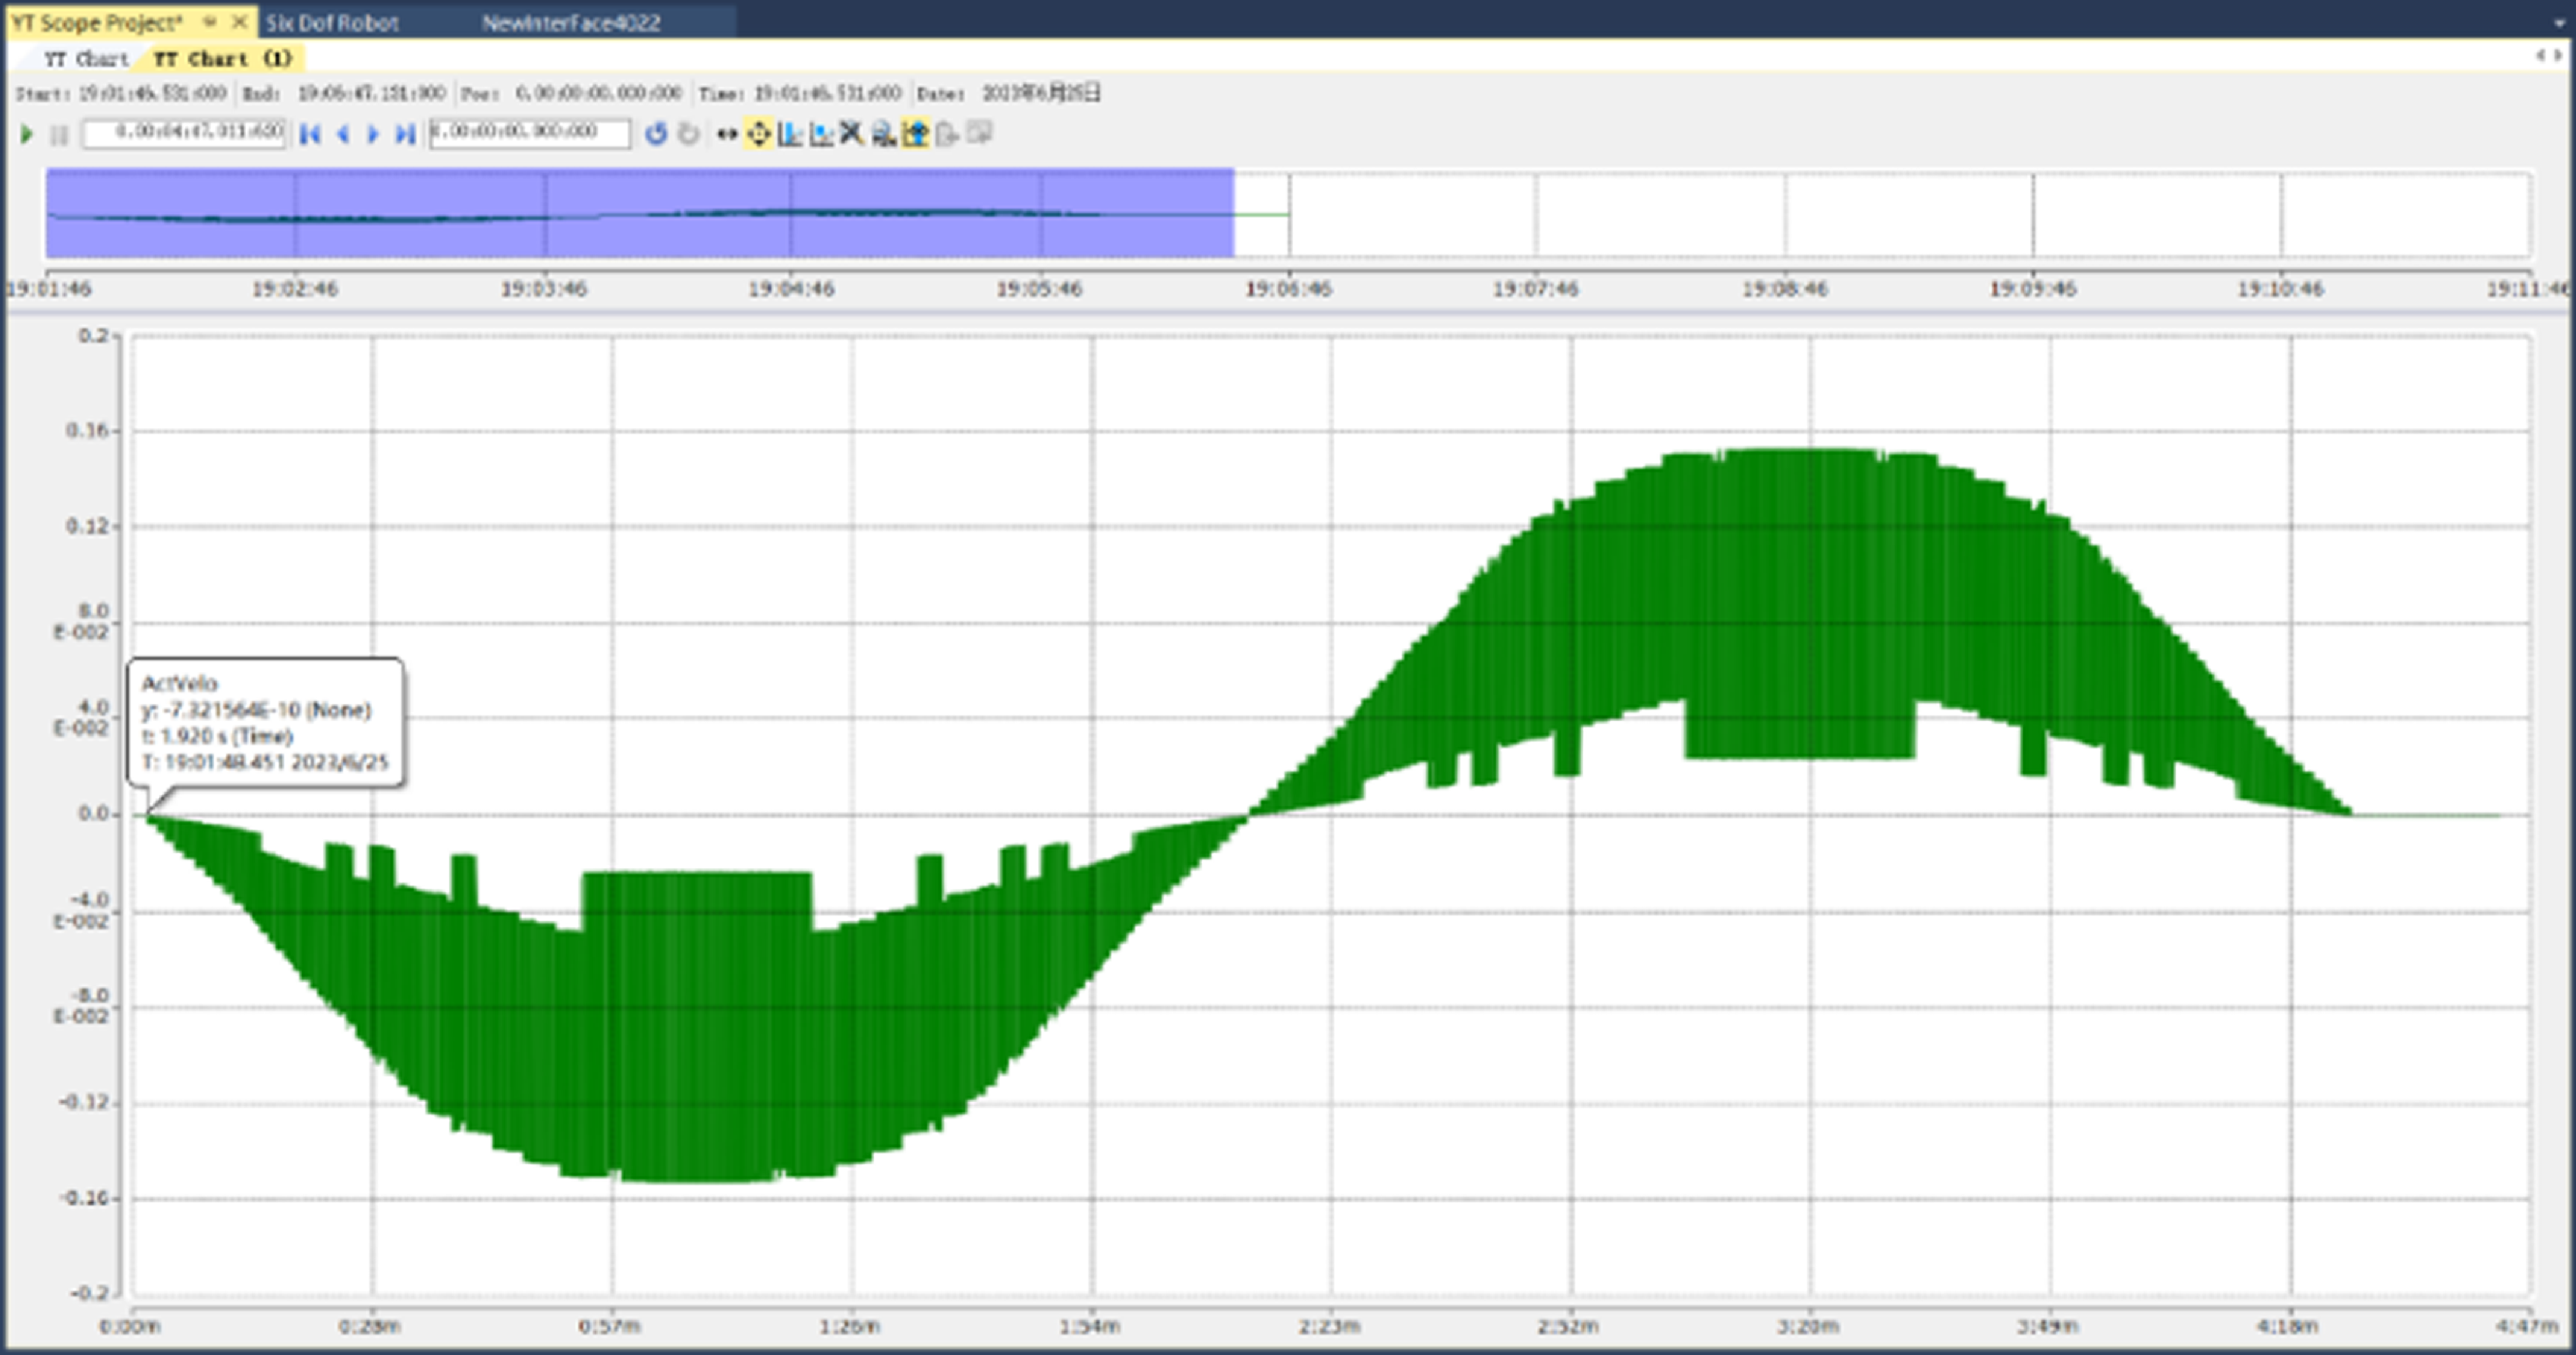
When examining the X axis velocity curve at 20,000 interpolation points, as shown in Fig. 13, the green area represents the overlapping portion of the velocity curve. At 20,000 interpolation points, the X axis velocity fluctuation curve exhibits violent jitter and lacks coherence, causing the control system’s response time to exceed the limit, resulting in the robot’s movement being out-of-step and fluctuating violently.
X axis velocity curve when interpolation point is 20,000.

6. Conclusion
In this paper, the number of limit interpolation points under different control system’s response time and robot’s terminal velocity is analyzed both theoretically and experimentally, and the theoretical calculations are optimized based on experimental data. The results demonstrate that the fitting prediction curve for limit interpolation points accurately calculates the number of limit interpolation points. The main conclusions are as follows:
(1) Based on the principle of arc interpolation, the relationship between the number of interpolation points and arc length is analyzed, and the calculation equation for limit interpolation points is derived, providing a basis for the theoretical calculation of limit interpolation points.
(2) Through experimental analysis of different control system’s response time and robot’s terminal velocity, it is verified that when the control system’s response time is 5 ms and the robot’s terminal velocity is within 100 mm/min, the theoretical calculation can more accurately predict the number of limit interpolation points.
(3) Using the least squares optimization theoretical calculation method, the prediction equation for limit interpolation points under different control system’s response time and robot’s terminal velocity was obtained:
 $m=\frac{t-0.2548k}{0.0475/k}$
, and the accuracy of the prediction model was verified through experiments.
(4) Other controllers can determine their limit interpolation points using the above experimental method and deduce the prediction equation for these limit interpolation points.
This study provides a theoretical basis for selecting an appropriate number of interpolation points under different control system’s response time and robot’s terminal velocity, which is essential for ensuring smooth and stable robot motion during path planning. In the future, we will further study and analyze the influence of the performance of AC servo motor and the ratio of load inertia to motor inertia on the dynamic response and stability of the system.
Author contributions
Yi Wang and Guangpeng Zhang conceived and designed the study. Zhenyang Lv and Xionghui Wang conducted data gathering. Xionghui Wang performed statistical analyses. Zhenyang Lv and Guangpeng Zhang wrote the article.
Financial support
The authors would like to thank the support of Shaanxi Province key research and development plan project (NO. 2017ZDXM-GY-133).
Conflicts of interest
The authors declare no conflicts of interest exist.
Ethical approval
Not applicable.