Implications
The results from this study support the genetic selection of several pig fat quality traits. The choice of rapid methods makes it possible to test a large number of animals and calculate genetic parameters with high accuracy at an acceptable cost.
Introduction
Subcutaneous fat of good quality in meat products is defined as firm and white, whereas poor fat quality yields problems with a soft texture, insufficient drying, an oily appearance, the development of rancidness and a separation between muscle and adipose tissue (e.g. belly and ham) when cutting. The quality of pig fat is influenced by its lipid content and fatty acid composition, with fatty acid composition being of importance in relation to human health. Currently, Western diets have an unfavourably high ratio between n-6 and n-3 fatty acids, which is typical for modern pig fat. N-6 and n-3 fatty acids compete with each other for incorporation into membrane lipids, attachment to several enzymes and in the production of eicosanoids. Furthermore, n-6 and n-3 fatty acids have the opposite effect on inflammation in the human body. N-6 fatty acids have an unfavourable effect on the incidence of several important diseases in the general human population (e.g. coronary heart disease, hypertension, type 2 diabetes, arthritis and other inflammatory diseases, autoimmune diseases and cancer; Simopoulos, Reference Simopoulos1999). Saturated fatty acids (SFAs) and monounsaturated fatty acids (MUFAs) are synthesised de novo in the pig. However, important polyunsaturated fatty acids (PUFAs) in pigs such as linoleic acid (C18:2n-6 is the n-6 fatty acid with the greatest volume) and α-linolenic acid (C18:3n-3 is the n-3 fatty acid with the greatest volume) cannot be synthesised de novo. As a result, the levels of these fatty acids in pig fat will reflect dietary changes (Enser et al., Reference Enser, Richardson, Wood, Gill and Sheard2000). Uncertainties exist as to what extent selection can change the ratio between n-6 and n-3 fatty acids. The degree of fatty acid unsaturation in mitochondrial membrane lipids has been documented as one of the biochemical parameters most strongly correlated with longevity. Oleic acid (C18:1n-9 is the n-9 fatty acid with the greatest volume) competes for incorporation into membrane lipids and triglycerides at the same positions as several n-6 and n-3 fatty acids. It is a stable fatty acid that does not trigger oxidative stress. This relationship between C18:1n-9 and n-6 fatty acids is thoroughly discussed in a paper by Haug et al. (Reference Haug, Olesen and Christophersen2010), who study human nutrition in relation to fatty acids in meat. Pig fat is rich in C18:1n-9, which is important for both good eating (Cameron et al., Reference Cameron, Enser, Nute, Whittington, Penman, Fisken, Perry and Wood2000) and the technological quality of fat (Suzuki et al., Reference Suzuki, Ishida, Kadowaki, Shibata, Uchida and Nishida2006). In contrast, 18:2n-6 is the primary reason for high iodine value and technological quality problems (Carnier et al., Reference Carnier, Sturaro, Noventa and Gallo2003).
Few estimates of the genetic parameters in terms of the percentage of fatty acids in subcutaneous fat analysed by chemical methods are reported in the literature, and actual studies all demonstrate high heritabilities for several fatty acids (Schwörer et al., Reference Schwörer, Morel and Rebsamen1988; Bout et al., Reference Bout, Girard, Runavot and Sellier1989; Cameron, Reference Cameron1990). The study by Clop et al. (Reference Clop, Ovilo, Perez-Enciso, Cercos, Tomas, Fernandez, Coll, Folch, Barragan, Diaz, Oliver, Varona, Silio, Sanchez and Noguera2003) was the first study of a genome scan detection of quantitative trait loci (QTL) affecting fatty acid composition in Iberian × Landrace crossbred pigs, in which they found several significant QTLs. Traditionally, fatty acids are analysed using labour-intensive methods such as gas chromatography (GC), which is both expensive and time-consuming. The near-infrared spectroscopy (NIRS) patterns of liquid fat contain information on fatty acid composition (Schwörer et al., Reference Schwörer, Lorenz and Rebsamen1999; Garrido-Varo et al., Reference Garrido-Varo, Perez-Marin, Bautista-Cruz and Guerrero-Ginel2008). NIRS has the advantage of being used for the analysis of a high number of samples at a relatively low cost. Rapid methods make it possible for a large number of animals to be tested, and genetic parameters can be calculated at an acceptable price for the fat quality traits recorded. Several Spanish studies have reported that NIRS technology is able to accurately predict the percentage of oleic, linoleic, palmitic and stearic acids in subcutaneous fat from the Iberian breed (de Pedro et al., Reference de Pedro, Garrido, Bares, Casillas and Murray1992; Garcia-Olmo et al., Reference Garcia-Olmo, Garrido-Varo and de Pedro2001; Fernandez et al., Reference Fernandez, de Pedro, Nunez, Silio, Garcia-Casco and Rodriguez2003), and one study has previously estimated the heritabilities for fatty acids predicted from NIRS equations (Fernandez et al., Reference Fernandez, de Pedro, Nunez, Silio, Garcia-Casco and Rodriguez2003). Medium high heritabilities were estimated for four fatty acids with a large impact on fat quality. In Spain, there is much ongoing research published in this field, but, to the authors’ knowledge, it is of no practical use in breeding. Suisag in Switzerland did previously use breeding values for iodine value estimated by NIRS, and they also have much experience on NIRS and fat quality. In the literature, we have not found any other works on NIRS technology for fat quality in practical breeding programmes.
The composition of fatty acids is correlated to other traits such as fat moisture and fat colour, and this is a part of the technological fat quality problem. In this study, fat moisture percentage in intact subcutaneous fat was predicted by NIRS using a new method designed by Gjerlaug-Enger et al. (Reference Gjerlaug-Enger, Kongsro, Aass, Ødegård and Vangen2010a), and fat colour was also measured with a spectroscopic method.
The aim of this study was to estimate the genetic parameters for new fat quality traits in pigs by the use of novel low labour-intensive methods and NIRS (developed by Gjerlaug-Enger et al., Reference Gjerlaug-Enger, Kongsro, Aass, Ødegård and Vangen2010a). The NIRS methods and their known performance enable untrained personnel to conduct routine analyses of numerous and extensive sample series. If these methods can detect significant genetic variations of a certain size, it would be possible to utilise them in the selection programme for pigs to improve both fat quality and fatty acid profile for the benefit of human health.
Material and methods
Animals
This study is an expansion of an earlier work on meat quality traits presented by Gjerlaug-Enger et al. (Reference Gjerlaug-Enger, Aass, Ødegård and Vangen2010b). Fat quality data were recorded between 2005 and 2008 in Norwegian Landrace (n = 3230 for fat quality, n = 4797 for lean meat percentage (LMP)) and Duroc (n = 1769 for fat quality, n = 2819 for LMP) pigs, with all animals included in the national pig breeding scheme. The carcass records available for these analyses originated from half-sib tested females and castrated males. In the two half-sib testing stations (one in central and one in southeastern Norway), 2800 females and castrates were tested annually. The animals were half-sib groups of station-tested boars and were kept in mixed-sex groups with 12 as the size of the pen. The breeds were kept in separate pens. The pigs started the test at an average weight of 29.8 (s.d. 3.3) kg and average age of 77.4 (s.d. 7.4) days, and finished at an average live weight of 113.1 (s.d. 6.7) kg and average age of 162.4 (s.d. 10.7) days. The pigs were slaughtered at two different abattoirs and all carcasses were transported to a partial dissection line at the Norwegian Meat and Poultry Research Centre (Animalia). More detailed information about the tests and slaughtering has been described by Gjerlaug-Enger et al. (Reference Gjerlaug-Enger, Kongsro, Aass, Ødegård and Vangen2010b).
All pigs were fed ad libitum on conventional concentrates containing 14.5% to 15.8% total protein and 9.33 MJ net energy/kg. The major feedstuff compounds were barley (48%), oats (22%), peas (5%), soy meal extract (16%) and rendering (animal) fat (2.4%). No fatty acid analysis of the feed was performed, although some changes in fat quality from different feed batches may have occurred. The model used for statistical analysis is robust for environmental changes such as this.
Carcass composition traits
One carcass composition trait was included in this study in order to obtain a measurement of the leanness of the pigs. LMP was chosen because it is an important trait in the breeding goal and has been so for many decades when breeding for leaner pigs. Carcasses were split into ham, shoulder and loin, and each part was dissected into lean meat, fat, bone and skin. The trim (mix of lean and fat) from between the primary cuts was analysed for fat percentage (Scanalyser, model S2, Scanbio, Aalborg, Denmark). The belly and neck were not dissected because of the time required for the dissection of those cuts, and a predicted fat percentage for those cuts was calculated from the fat percentage of the trim. These equations were: fat percentage neck = 0.48273 + (0.64847 × fat percentage of the trim) and fat percentage belly = 6.09748 + (1.2539 × fat percentage in the trim). In total, 114 registrations were made for each carcass. Finally, an equation using the weight of the different components with the percentage of fat and lean was used to predict an LMP for the entire carcass. This equation was based on a dissection study in 1987 of 120 pigs in which all cuts of the half carcass were dissected into lean meat, fat, bone and skin (Roe M, personal communication, 2010). All animals with fat quality traits recorded also had an LMP.
Fat quality traits
The determination of the various fatty acids, iodine value, fat moisture percentage and fat colour was carried out on samples of subcutaneous fat taken from the area between the loin and ham in the coxal region of the carcasses. The samples obtained from the carcass included the hide/skin, the fat between the hide and the lean, and some lean. The latter was carefully removed from the sample before the colour measurements were taken.
Colour of subcutaneous fat
The fat colour was measured using a Minolta Chroma Meter CR-400 (measurement area with an aperture of 8 mm), with a D65 illuminant calibrated against a white tile. The tristimulus parameters L*, a* and b* (also referred to as the CIELAB colour space), representing whiteness (L* = 0 is completely black and L* = 100 is completely white), redness (positive a* values mean red colours and negative a* values mean green colours) and yellowness (positive b* values mean yellow colours and negative b* values mean blue colours), were measured on three random spots of each fat sample surface in the inner fat layer free from any contamination of the lean. The average of three measurements for each sample was used for statistical analysis. With the Minolta instrument connected to a computer, a barcode scanner gave quick and accurate sample identification, and the operator identification and recording time were also automatically stored.
Moisture percentage of subcutaneous fat
The FoodScan near-infrared spectrophotometer (FOSS NIRSystems, Hillerød, Denmark) was used for determining the moisture percentage, with the same fat sample being used for the fat colour measurements. The samples with all fat layers represented were cut into small pieces (brick size: 3 to 5 mm) without further homogenisation. Approximately 12 g of these samples were placed in a 50 mm round plastic petri dish, and the NIRS scanning process took 1 min. The method and calibration development were described by Gjerlaug-Enger et al. (Reference Gjerlaug-Enger, Kongsro, Aass, Ødegård and Vangen2010a).
Fatty acids of subcutaneous fat
A microwave fat melting technique was used to prepare samples to obtain total lipids from the subcutaneous fat sample, previously cut into pieces for the analysis of the fat moisture percentage.
Transflection spectra of total lipids from subcutaneous fat samples were obtained using an XDS near-infrared rapid content analyser (FOSS NIRSystems, Hillerød, Denmark). Each sample was scanned once for 1 min using a circular quartz cuvette and gold-plated reflectors that provided optical path lengths of 0.2 mm. This method and the calibration development are described in the previous paper of this study (Gjerlaug-Enger et al., Reference Gjerlaug-Enger, Kongsro, Aass, Ødegård and Vangen2010a).
Prediction of fatty acids and fat moisture percentage
The regression results of NIRS equations for several fatty acids and the moisture percentage of subcutaneous fat were presented by Gjerlaug-Enger et al. (Reference Gjerlaug-Enger, Kongsro, Aass, Ødegård and Vangen2010a). In total, samples from 5006 and 5278 pigs were analysed in the FOSS XDS near-infrared rapid content analyser for fatty acid composition and in the FOSS FoodScan near-infrared spectrophotometer for moisture percentage in subcutaneous fat. Six fatty acids and fat moisture demonstrated sufficiently satisfactory results to be used as traits in this study. These were the Palmitic, C16:0; Palmitoleic, C16:1n-7; Steric, C18:0; Oleic, C18:1n-9; Linoleic, C18:2n-6 and α-linolenic, C18:3n-3 fatty acids, which accounted for 95% of the total amount of fatty acids found by chemical methods (GC). The other fatty acids in the subcutaneous fat of the pigs in this study had a concentration lower than 1% in the fat tissue. The ratio between C18:2n-6 and C18:3n-3 used in our study corresponds to the n-6 to n-3 ratio, which is usually calculated as the sum of all n-6 and n-3 fatty acids, although the long-chain PUFAs were too low in concentration for the NIRS equations used here.
A few samples with strange spectra were eliminated for the genetic analyses. Global H outliers (GH) are samples whose spectra differed notably from the mean sample spectrum. Samples with a GH value higher than 3 were eliminated from the data set for the prediction of fatty acids and moisture percentage.
Quantitative genetic analyses
In preliminary analyses, the fixed effects of sex, herd, abattoir × slaughter day, calibration, storage day and carcass weight were tested with SAS Proc GLM (SAS Inst., Inc., Cary, NC, USA). A herd was defined as the animals’ herd of origin until transfer to the test station. Animals from the two test stations were slaughtered at two different abattoirs, and thus the abattoir × slaughter day effect was confounded with the station. The effect of calibration was the effect for each time the Minolta instrument was started and calibrated. Every series of samples has one calibration, and some large shifts between series were detected without any explanation other than the error from the calibration. This effect was only relevant for the fat colour measurements. Calibration was confounded with the abattoir × slaughter day, and therefore only the calibration number was used. The storage time from slaughter to dissection ranged from 2 to 9 days, and the average carcass weights were 83 kg (Landrace) and 81 kg (Duroc) with standard deviations of 5.5 kg for both breeds.
The breeds were analysed separately, but the same method was used. The different traits (C16:0, C16:1n-7, C18:0, C18:1n-9, C18:2n-6, C18:3n-3, n-6/n-3 ratio, fat moisture percentage, L*, a* and b* values in fat and LMP) were analysed in different analyses and a general multi-trait animal model was used for the genetic analyses:

where Y is a matrix of observations, β, u and e are vectors of fixed, additive genetic and residual effects, respectively, and X and Z are known incidence matrices. An estimation of (co)variance components was performed using multi-trait animal models and analysed with restricted maximum likelihood (REML) methodology. The DMU 6.7 software package (Madsen and Jensen, Reference Madsen and Jensen2008) and the average information (AI) algorithm were used in the estimation. Asymptotic standard errors of (co)variance components were computed from the inverse average information matrix.
Owing to computational constraints because of linear dependency and high correlations between the fatty acids, all traits could not be analysed in the multi-trait analysis simultaneously. Two matrices of genetic parameters are presented for each breed. The first matrix with seven traits (C16:0, C16:1n-7, C18:0, C18:1n-9, C18:2n-6, C18:3n-3 in fat and LMP) was calculated from several analyses of three traits: the LMP and two fatty acids together, to cover all the combinations of fatty acids. In addition, the ratio between C18:2n-6 and C18:3n-3 was analysed and presented for Landrace pigs, whereas the correlation between this ratio and the other fatty acids could not be estimated for Duroc pigs, probably due to the low genetic variation for this trait. The average correlations are presented and the heritabilities are estimated from single trait analyses.
Subsequent analyses with three of the most important fatty acids for human health (C16:0, C18:1n-9, C18:2n-6), fat moisture percentage, L*, a* and b* values in fat and LMP were calculated simultaneously as one multi-trait model and reached convergence without any computational problems for both breeds. The three fatty acids in these analyses additionally represented the three fatty acids groups: SFA, MUFA and PUFA.
For traits containing estimates of heritabilities, standard errors and standard derivations from both sets of matrices (first and second), average estimates were presented. None of the estimates going into an average differed by more than two-tenths.
The pedigree file contained all tested animals and their ancestors born between January 2002 and February 2008. In total, five generations of animals were included, and the first generation was the base population. The base populations were 478 and 254 Landrace and Duroc pigs, respectively, born in the period from 1999 to 2001. The average coefficient of inbreeding was 0.06 for Landrace pigs and 0.07 for Duroc pigs. The final pedigree files for Landrace and Duroc pigs included 9140 and 5405 individuals (4797 and 2819 individuals with data), respectively.
In addition, the same model, with the additional breed × sex effect replacing the sex effect, was applied to the combined Landrace and Duroc data sets. An SAS Proc GLM was used to estimate least square means for the breed × sex effects. If an effect was significant for one of the breeds, it was included in the analysis for the breed × sex effects.
Results
Breed and sex differences
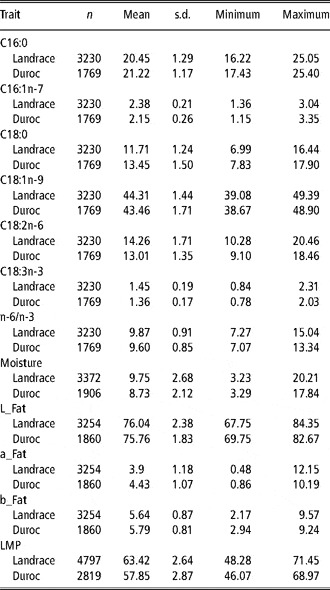
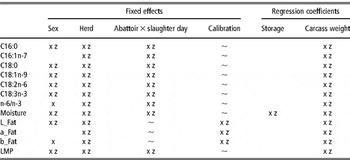
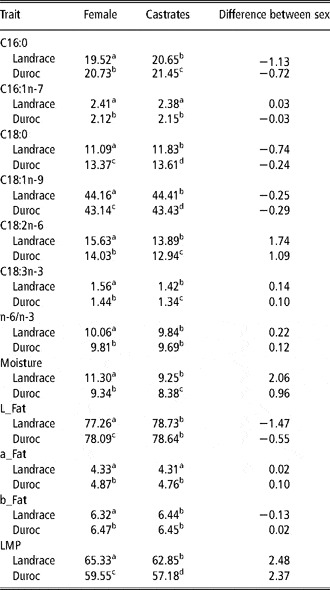
Basic statistics of the traits studied are included in Table 1 and the models for multi-trait analysis with their fixed effects are given in Table 2. The least square means for the breed × sex effects are given in Table 3 in which the models from Table 2 were used, except for the breed × sex effect replacing the sex effect.
Numbers of animals per traitFootnote a, mean, s.d. of means, minimum and maximum for Landrace and Duroc

LMP = lean meat percentage.
a C16:0 = palmitic; C16:1n-7 = palmitoleic; C18:0 = steric; C18:1n-9 = oleic; C18:2n-6 = linoleic; C18:3n-3 = α-linolenic; n-6/n-3 = ratio of C18:2n-6 and C18:3n-3; moisture = fat moisture percentage; L_Fat = L* value; a_Fat = a* value; b_Fat = b* value. All fat traits are measured in subcutaneous fat.
Fixed effects of the models for the analysed traitsFootnote a in Landrace and Duroc

LMP = lean meat percentage.
a See Table 1 for trait abbreviation definitions.
x = significant effect (P < 0.05) for Landrace.
z = significant effect (P < 0.05) for Duroc.
∼ = not tested.
Empty cells = non-significant (P > 0.05).
Least square means for effect of breed × sex for the analysed traitsFootnote a in Landrace and Duroc

LMP = lean meat percentage.
a See Table 1 for trait abbreviation definitions.
Probability of significance for each trait: different letters = P < 0.001, equal letters = non-significant (P > 0.001).
Landrace and Duroc pigs were significantly different for almost all fat quality traits measured. Females and castrates from the two breeds were also significantly different for the majority of the traits, and the difference between the two sexes had the same sign for significant differences. For the SFAs (C16:0 and C18:0), the Duroc pigs had a higher percentage than Landrace pigs, and castrates had a higher percentage than females. For the MUFAs (C16:1n-7 and C18:1n-9), Landrace pigs had a higher percentage than Duroc pigs and castrates had a higher percentage of C18:1n-9 than females, although no sex differences were found for C16:1n-7. For the PUFAs (C18:2n-6 and C18:3n-3), Landrace pigs had a higher percentage than Duroc pigs, and females had a higher percentage than castrates. Landrace pigs had more moisture in subcutaneous fat than Duroc pigs, and females had higher levels than castrates. There were no differences in L* value (whiteness) between castrates for the two breeds, and the castrates had generally whiter fat than the females. For a* and b* values (redness and yellowness, respectively), the differences between the sexes were small, whereas Landrace pigs had a lower a* value in the fat than Duroc pigs. Landrace pigs had a higher LMP than Duroc pigs and females were leaner than castrates.
Fixed effects
The fixed effects included in the models (sex, herd, abattoir × slaughter day, calibration, storage day and carcass weight) had various influences on the traits in this study, independent of breed (Table 2). The effect of abattoir × slaughter day (which includes the effects of the test station) was significant for all fat quality traits. Storage (the number of days of storage from slaughter to dissection) significantly decreased the moisture percentage in subcutaneous fat for both breeds (Table 2), but was not significant for any of the other traits. From days 3 to 9, the moisture percentage in subcutaneous fat decreased from 10.7% to 8.5% in Landrace pigs, and from days 2 to 8 the reduction was from 9.7% to 7.4% in Duroc pigs (data not shown in tables).
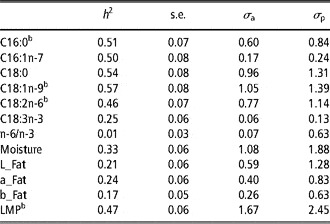
Heritability estimates for fat quality
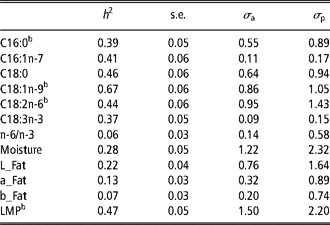
The fat quality evaluation methods used in this study gave moderate-to-high heritability estimates for several fatty acids and moisture percentage in subcutaneous fat predicted by the NIRS and low heritability estimates for fat colour measured with Minolta (Tables 4a and 4b). On average, the heritabilities were of the same size in Landrace and Duroc pigs, although Duroc pigs had larger phenotypic variation on average for these traits (Tables 4a and 4b). The heritabilities of C18:1n-9 were highest in both breeds, ranging from 0.57 in Duroc pigs to 0.67 in Landrace pigs. The estimated heritabilities of the ratio between C18:2n-6 and C18:3n-3, corresponding to the n-6/n-3 ratio, were low and not significantly different from zero in Duroc pigs. The standard errors for the heritability estimates were relatively low due to the large volume of data in this study.
Heritabilities (h 2) for the analysed traitsFootnote a with s.e., genetic and phenotypic s.d. (σ a, σ p) in Landrace

LMP = lean meat percentage.
a See Table 1 for trait abbreviation definitions.
b Traits included in more than one analyses, average values are presented.
Heritabilities (h 2) for the analysed traitsFootnote a with s.e., genetic and phenotypic s.d. (σ a, σ p) in Duroc

LMP = lean meat percentage.
a See Table 1 for trait abbreviation definitions.
b Traits included in more than one analyses, average values are presented.
Relationships among fatty acids and LMP
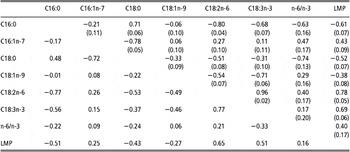
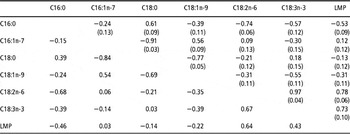
The genetic and phenotypic correlations among primary fatty acids and LMP are shown in Tables 5a and 5b. The sign and size of the parameters were similar for both breeds with only a few exceptions. LMP revealed negative genetic and phenotypic correlations to C16:0, C18:0 and C18:1n-9 and positive genetic and phenotypic correlations to C16:1n-7 (not significant for Duroc pigs), C18:2n-6 and C18:3n-3.
Phenotypic correlations (below diagonal) and genetic correlations (above diagonal; s.e. between brackets) for main fatty acids and LMPFootnote a in Landrace

LMP = lean meat percentage.
a See Table 1 for trait abbreviation definitions.
The parameters came from 21 multi-trait analyses.
Phenotypic correlations (below diagonal) and genetic correlations (above diagonal; s.e. between brackets) for main fatty acids and LMPFootnote a in Duroc

LMP = lean meat percentage.
a See Table 1 for trait abbreviation definitions.
The parameters came from 15 multi-trait analyses.
The genetic and phenotypic correlations between C16:0 and C18:0 were positive, whereas the correlations between C16:0 and MUFAs and PUFAs were all negative (not significant for C18:1n-9 in Landrace pigs). C16:1n-7 and C18:0 were strongly negatively, genetically and phenotypically correlated, whereas C16:1n-7 was positively correlated to C18:1n-9 (not significant for Landrace pigs) and C18:0 was negatively correlated to C18:1n-9. The PUFAs (C18:2n-6 and C18:3n-3) showed high phenotypic correlations to each other and genetic correlations close to one.
The genetic correlations between the ratios C18:2n-6 and C18:3n-3 and SFA were high and positive, whereas the correlations were medium-to-low and negative between this ratio and the MUFA and PUFA. A positive genetic correlation was estimated between LMP and the C18:2n-6 to C18:3n-3 ratio.
Relationships between fatty acids, fat quality traits and LMP
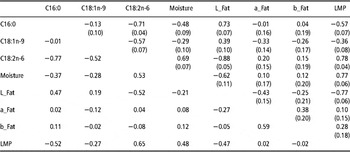
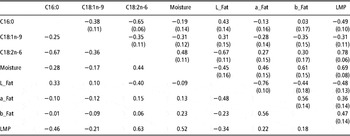
Genetic and phenotypic correlations between fat quality traits and LMP are shown in Tables 6a and 6b. The parameters were similar for both breeds with only small exceptions. The moisture percentage in subcutaneous fat was negatively correlated to C16:0 and C18:1n-9 and positively correlated to C18:2n-6. Strong relationships were observed between the L* value of subcutaneous fat and the fatty acids, with positive genetic and phenotypic correlations to C16:0 and C18:1n-9 and negative correlations to C18:2n-6. Lower correlations were estimated between the fatty acids and a* and b* values. The moisture percentage in subcutaneous fat was negatively correlated to the L* value and positively correlated to a* and b* values (not significant in Landrace). The L* value was negatively correlated to a* and b* values, whereas a* and b* values were positively correlated with each other. LMP was positively correlated to the fat moisture percentage and a* and b* values, and negatively correlated to the L* value.
Phenotypic correlations (below diagonal) and genetic correlations (above diagonal; s.e. between brackets) for the analysed traitsFootnote a in Landrace

LMP = lean meat percentage.
a See Table 1 for trait abbreviation definitions.
All parameters came from one multi-trait analysis.
Phenotypic correlations (below diagonal) and genetic correlations (above diagonal; s.e. between brackets) for the analysed traitsFootnote a in Duroc

LMP = lean meat percentage.
a See Table 1 for trait abbreviation definitions.
All parameters came from one multi-trait analysis.
Discussion
The inner and outer fat layers were mixed together when preparing samples for analyses of fat moisture and fatty acids. This was done in order to make the sample preparation quick, but previous studies have found different concentrations of fatty acids in the inner and outer fat layers, with more SFA in the inner layer (Schwörer et al., Reference Schwörer, Morel and Rebsamen1988; Suzuki et al., Reference Suzuki, Ishida, Kadowaki, Shibata, Uchida and Nishida2006) and higher iodine value in the outer layer (Schwörer et al., Reference Schwörer, Rebsamen and Lorenz1994). It is well documented that the degree of saturation of fatty acids increases from the outside to the inside of the body. The temperature differences in different fat depots may affect the activity of the delta-9 desaturase enzyme (Sellier et al., Reference Sellier, Maignel and Bidanel2010). For both the meat industry and consumers, subcutaneous fat is handled as one piece.
Breed and sex differences
No previous studies using NIRS for the prediction of fatty acids have looked at differences between the sexes. While analysing fatty acids with chemical methods, other studies found significantly higher concentrations of PUFA and 18:3n-3 in backfat from females than from castrates (Suzuki et al., Reference Suzuki, Ishida, Kadowaki, Shibata, Uchida and Nishida2006; Tikk et al., Reference Tikk, Tikk, Aaslyng, Karlsson, Lindahl and Andersen2007), in addition to higher female concentrations of 18:1n-9 and lower concentrations of C16:0 and C18:0 (Suzuki et al., Reference Suzuki, Ishida, Kadowaki, Shibata, Uchida and Nishida2006). This is in agreement with our studies. As reported by de Smet et al. (Reference de Smet, Raes and Demeyer2004), differences in fatty acid composition between the sexes are found in several studies. Schwörer et al. (Reference Schwörer, Morel and Rebsamen1988) found significant differences between fatty acids from GC for Landrace and Yorkshire pigs, and Fernandez et al. (Reference Fernandez, de Pedro, Nunez, Silio, Garcia-Casco and Rodriguez2003) reported breed differences between fatty acids predicted by NIRS for some Iberian breeds. In a study including Belgian Landrace and Duroc pigs of equal leanness, the Duroc pigs had a significantly higher percentage of C16:0 and PUFA, C18:2n-6 and C18:3n-3, and a lower content of C18:1n-9 in backfat than Landrace pigs (Raj et al., Reference Raj, Skiba, Weremko, Fandrejewski, Migdał, Borowiec and Poławska2010). Sellier et al. (Reference Sellier, Maignel and Bidanel2010) found more 18:1n-9 in Landrace than in Large White pigs. For C16:0 and 18:1n-9, we observed similar differences, but for PUFAs this was not in agreement with our results. In our study, Duroc pigs had more SFA, whereas Landrace pigs had more MUFA and PUFA. For the de novo synthesised fatty acids, Duroc pigs store more fatty acids as SFA, whereas to a larger degree Landrace pigs transform the SFA to MUFA. C16:0 is the first finite product from fatty acid de novo synthesis, and Duroc pigs store more of this acid than Landrace pigs. A larger activity of delta-9 desaturase enzyme in Landrace pigs could have caused the breed difference observed in C16:1n-7 and C18:1n-9 concentrations (both C16:1n-7 (c9) and C18:1n-9 (c9) have the double bound in the ninth position for the carboxyl end of the fatty acid). The higher percentage of PUFA in Landrace pigs is probably an effect of the lower level of backfat in this breed than in Duroc pigs.
Differences in the moisture percentage of subcutaneous fat for different sexes or breeds are not reported in the literature, but our results were as expected in view of the higher level of fatness and lower percentage of PUFA in castrates and in Duroc pigs. Fat from females had lower L* and a* values, but was comparable with castrates in b* values (Winzig and Beutling, Reference Winzig and Beutling2006). In our study, the females had lower L* and b* values (not for Duroc) and equal a* values. For C18:2n-6, fat moisture and L* value, the differences between the sexes were much larger for Landrace pigs than for Duroc pigs in spite of similar differences in LMP for the two breeds. Duroc had both lower fat moisture and whiter fat, although the higher value for redness might be a breed characteristic, despite expectations.
Heritability estimates of the fat quality traits
Few studies have reported estimated heritabilities for fatty acids. Sellier (Reference Sellier1998) reported pooled average values of 0.51 for C18:0 and 0.58 for C18:2n-6 in subcutaneous fat. Schwörer et al. (Reference Schwörer, Morel and Rebsamen1988) and Suzuki et al. (Reference Suzuki, Ishida, Kadowaki, Shibata, Uchida and Nishida2006) reported heritability estimates of fatty acids in the inner and outer layers of subcutaneous fat. In view of the standard errors, the size of the heritabilities was similar for the pair of parameters for a particular fatty acid, and the heritabilities were very high for some of the highest quantity fatty acids and low for fatty acids with low concentrations (e.g. C14:0 and C16:1). For the chemical methods used in the studies referred to above, measuring fatty acid composition on a large number of animals for breeding value estimation is, at present, not possible at a reasonable cost (de Smet et al., Reference de Smet, Raes and Demeyer2004). Fernandez et al. (Reference Fernandez, de Pedro, Nunez, Silio, Garcia-Casco and Rodriguez2003) presented one of the first studies reporting heritabilities for fatty acids measured by NIRS. An optic fibre probe was applied on intact subcutaneous fat using the FOSS-NIRSystem 6500 instrument. The estimated heritabilities in their study were 0.31 (C16:0), 0.41 (C18:0), 0.30 (C18:1) and 0.29 (C18:2). The estimated heritabilities for fatty acids in our study were intermediate to the values from the chemical and NIRS methods, except for the high estimates for C18:1n-9 in both breeds. In the study by Fernandez et al. (Reference Fernandez, de Pedro, Nunez, Silio, Garcia-Casco and Rodriguez2003), the use of an optic fibre probe might be the reason for the decreased accuracy of NIRS equations and lower heritabilities than in our study, though the use of an optic fibre probe has the advantage of needing very little sample preparation. The XDS instrument in our study is also a newer NIRS instrument from FOSS than the NIRSystem 6500 used by Fernandez et al. (Reference Fernandez, de Pedro, Nunez, Silio, Garcia-Casco and Rodriguez2003), but with similar properties. The Iberian pigs used in their study were different from the pigs in our study with regard to feeding, carcass weight, fatness and age.
The low-estimated heritabilities of the ratio between C18:2n-6 and C18:3n-3 were low and not significantly different from zero in Duroc pigs. This shows that very few, if any, enzymes or uptake mechanisms in a pig's body can distinguish between these fatty acids.
Cameron (Reference Cameron1990) reported a heritability estimate of moisture percentage in subcutaneous fat of 0.27, which is of the same size as in our work, whereas Sellier et al. (Reference Sellier, Maignel and Bidanel2010) found a higher value (0.59). As expected, the moisture percentage in pig fat measured by NIRS was not found in the literature, as this method was designed for our study.
Heritability estimates for the fat colour of subcutaneous fat were also not reported in the literature, and the heritabilities estimated in our study were quite low. The method was not laboratory intensive, and the estimated heritabilities could possibly be increased if the sample preparation was improved. In addition, measurement errors could be large if the lean was not properly removed for the fat sample, with another problem possibly being the thickness of the fat layer. Since the lights from the Minolta instrument penetrate several millimetres of fat, the chopping board under the samples needs to be white. The outer fat layer has more PUFA than the inner layer, and thus it may have been better to measure the outer layer. However, this would increase problems with the backfat thickness. Suisag (a Swiss pig breeding company) also has some experience with this method in the Swiss pigs performance testing station (Schwörer D, personal communication, 2006).
Relationships among fatty acids and LMP
In pigs and other one-stomached animals, glucose is broken down into pyruvate, and in the de novo synthesis the pyruvate is converted into Acetyl-CoA, which is used to make C16:0. The concentrate used in this study is a conventional feed used for slaughtered pigs in Norway. This feed is high in carbohydrates and low in fat (4% to 5%), which stimulates a relatively high de novo synthesis of fatty acids from carbohydrates. This situation affects the relationships among the fatty acids.
The genetic and phenotypic correlations between various fatty acids demonstrated that the concentration of the dominant C18:1n-9 fatty acid in the pig's subcutaneous fat (43% to 44% of the total fatty acid content) was positively correlated to MUFA 16:1n-7 (not significant for Landrace pigs). All these fatty acids are produced by desaturation through the delta-9 desaturase enzyme. In addition, a negative association between C18:1n-9 and C18:0, and between C16:1n-7 and C16:0 was observed. This could be explained by the fact that C16:0 and C18:0 are converted to C16:1n-7 and C18:1n-9 by the delta-9 desaturase enzyme. Since C16:0 goes either to C16:1n-7 or C18:0, this gives a strong negative correlation between those fatty acids.
The essential fatty acids, C18:2n-6 and C18:3n-3, are not synthesised by de novo synthesis and reflect dietary composition. These and longer chain n-6 and n-3 fatty acids compete with each other for incorporation into membrane lipids, as well as binding to several enzymes and eicosanoid production. As shown in Tables 5a and 5b, the genetic correlations between C18:2n-6 and C18:3n-3 were 0.96 to 0.97, meaning they are almost the same trait. The phenotypic correlations between C18:2n-6 and C18:3n-3 were 0.67 and 0.77 in Landrace and Duroc pigs, respectively, which was similar to the ratio between these two fatty acids in animals having the desired fatty acid composition (used for NIRS calibration). This is positive since NIRS technology can give unreliable estimates of the correlations because of the correlations between fatty acids and spectral characteristics of the fatty acids (Gjerlaug-Enger et al., Reference Gjerlaug-Enger, Kongsro, Aass, Ødegård and Vangen2010a).
Genetic correlations between 18:2n-6 and the C18:2n-6 to C18:3n-3 ratios were positive. Selection for a lower C18:2n-6 percentage can decrease the ratio between C18:2n-6 and C18:3n-3. Selection for a better ratio is not efficient in view of the low heritability for this ratio, but the selection of a lower C18:2n-6 can be favourable for improved eating quality, improved human nutrition (Haug et al., Reference Haug, Olesen and Christophersen2010) and technological quality (Suzuki et al., Reference Suzuki, Ishida, Kadowaki, Shibata, Uchida and Nishida2006).
Only one study has previously presented genetic correlations between primary fatty acids analysed with NIRS, and it has reported a very large positive correlation between C18:1 and C18:2 in Iberian pigs (Fernandez et al., Reference Fernandez, de Pedro, Nunez, Silio, Garcia-Casco and Rodriguez2003). This is not in agreement with our work, which estimated a negative correlation in both breeds. The explanation for this difference might be the feed given to the Iberian pigs because one of the highest quantity components of the fattening diet was acorns, which have a high concentration (66%) of C18:1n-9. In our work, the pigs were fed a typical modern pig diet rich in cereals, containing a relatively high percentage of C18:2n-6 and low percentage of C18:1n-9.
The concentrations of dietary fatty acids (C18:2n-6 and C18:3n-3) are larger in pigs that have a high LMP with a smaller contribution of de novo fatty acid synthesis. This could be an explanation for the association between leaner carcasses and a higher C18:2 percentage of subcutaneous fat, also described by Wood et al. (Reference Wood, Wiseman and Cole1994). Cameron (Reference Cameron1990) and Suzuki et al. (Reference Suzuki, Ishida, Kadowaki, Shibata, Uchida and Nishida2006) reported that C16:0, C18:0 and C18:1n-9 were positively correlated to backfat, whereas C18:2n-6 was negatively correlated (both phenotypically and genetically) to backfat. These findings were confirmed in our study.
Fatty acids from feed can yield a better ratio between the fatty acids, and with regard to the ratio between C18:2n-6 and C18:3n-3, this must be solved through dietary changes in view of the genetic parameters. There are several oils with a more favourable n-6 and n-3 ratio than those traditionally used for pig concentrates, and there does not need to be a large amount of additives to make a favourable ratio (Enser et al., Reference Enser, Richardson, Wood, Gill and Sheard2000). For the n-9 and n-6 ratio, breeding could be a better strategy since the concentration of C18:1n-9 in the feed has to be very high before the uptake mechanism for this fatty acid becomes more efficient than de novo synthesis, as well as the fact that this concentrate would be too expensive for the commercial production of pigs for slaughter.
Relationships between fatty acids, fat quality traits and LMP
Cameron (Reference Cameron1990) reported negative phenotypic and genetic correlations between the moisture percentage in subcutaneous fat and C16:0, C18:0 and C18:1n-9, and positive correlations to C18:2n-6. This is in agreement with our work, although their method for measuring fat moisture percentage was probably different from ours since the average fat moisture percentage in their study was about twice the level as the one in our work.
A study of pigs that were fed fish oil did not reveal any significant relationship between the colour of fat and the fatty acid composition, despite significant changes in the hardness of the fat and the iodine value (Irie and Sakimoto, Reference Irie and Sakimoto1992). Another study reported noticeable differences in fat colour (L* and a* values) among pigs with different fatty acid profiles (Jaturasitha et al., Reference Jaturasitha, Srikanchai, Chakeredza, ter Meulen and Wicke2008), which is in agreement with our results. SFA, MUFA and PUFA have very different structures and melting temperatures, and the fat colour is related to fat firmness. SFA, and to some degree MUFA, give a firm white fat, whereas PUFA give a softer fat with more colour (a lower L* value and higher a* and b* values). The fat moisture is not clean water, but probably more like the water inside the other cells, containing organic molecules as well as common organelles, which is a part of all cells. The genetic parameters for these relationships are not found in the literature.
A lean weight and carcass lean percentage were positively correlated (both phenotypically and genetically) to the fat moisture percentage (Cameron, Reference Cameron1990; Sellier et al., Reference Sellier, Maignel and Bidanel2010). Schwörer (2006, personal communication) found negative correlations between the moisture percentage in subcutaneous fat and backfat thickness, and positive correlations between fat moisture percentage and iodine value. Correlations between fat colour and LMP are not found in the literature, but the correlations in our study show that selection of a higher LMP gives subcutaneous fat with more colour, which is to be expected since the PUFA and fat moisture percentage increase with increased leanness.
Several of the fat parameters, particularly the fatty acids, showed a large genetic variation. These fatty acids can be seen as a direct trait of fat quality, whereas the fat moisture and fat colour are more like indirect traits. The high heritabilities for SFA and MUFA show that it is a genetic variation in the de novo synthesis of fatty acids, since most of these fatty acids are probably synthesised from carbohydrates with the feed used in our study. C18:2n-6 and C18:3n-3 are essential fatty acids and the genetic variation in these fatty acids indicate that genetic differences may exist in the uptake mechanisms of these PUFAs.
Conclusion
When aiming at measuring fat quality traits on a larger scale, it is important to find methods that are inexpensive, rapid, environmentally friendly, safe and user-friendly. The NIRS technologies used in our study facilitate the large-scale recording of fat quality at an acceptable cost. The high heritabilities for C18:1n-9 and C18:2n-6 and other fatty acids in the subcutaneous fat estimated in our study suggest the possibility for the genetic improvement of fatty acid composition. The direct selection of fatty acids makes it possible for favourable changes in terms of eating quality, in addition to improved human nutrition and technological quality. Increased concentrations of C18:1n-9 and decreased concentrations of C18:2n-6 will meet this requirement. A high heritability was estimated for the fat moisture percentage, and heritability estimates for this trait measured with NIRS have not been previously reported. Our study estimates the correlations between the fatty acids and fat moisture percentage, and clarifies in which direction the selection for a reduced fat moisture percentage will affect the fatty acids. For all fat quality traits in this study, it is clear that selection for increased LMP will result in decreased fat quality. With rapid methods, it is possible to select for both LMP and fat quality. The correlations are unfavourable, but improvement in both traits is possible if the selection is efficient. The perfectly slaughtered pig of the future should have the leanness of modern pigs and a good fat quality high in 18:1n-9 and low in 18:2n-6 fatty acids.
Acknowledgements
This project was funded by the Foundation for Research Levy on Agricultural Products, the Research Council of Norway and Norsvin (Norwegian Pig Breeders Association). Animalia (the Norwegian Meat and Poultry Research Centre) and Biobank AS are gratefully acknowledged for their goodwill and help with the introduction of novel fat quality equipment and recordings. Thanks to Jakob Jøns, FOSS for help with the NIRS equipment and the WinSIS-software, and to Daniel Schwörer for receiving and showing me Suisag's meat research laboratory.