





Childhood obesity has grown as a global public health epidemic over the past decades and now affects every country worldwide(Reference Phelps, Singleton and Zhou1). It is a leading contributor to the global burden of preventable diseases that impacts children from a young age, and it is carried into adulthood(Reference Phelps, Singleton and Zhou1,Reference Zhang, Liu and Ni2) . Aotearoa New Zealand (NZ) has one of the leading prevalence of child obesity worldwide, with the most recent New Zealand Health Survey showing that 1 in 3 children under 14 years were classified as having overweight or obesity(3). Over the years, this annual national survey has also highlighted relevant ethnic and socio-economic inequities in child obesity prevalence. Children of Māori and Pacific ethnicities (compared to non-Māori and non-Pacific children) were 45 % and 110 % more likely to be affect by overweight/obesity, respectively. Similarly, those living in the most deprived neighbourhoods were 46 % more likely to experience overweight/obesity compared with those living in the least deprived neighbourhoods(3). NZ’s Before School Check (B4SC) programme monitors anthropometric data on 4-year-olds, enabling the tracking of weight trends for preschool children(Reference Daniels, Taylor and Taylor4–Reference Schluter, Ahuriri-Driscoll and Mohammed6). B4SC registered that between 2010 and 2016, the prevalence of children with overweight, obesity and extreme obesity decreased by 2·2 %, 2·0 % and 0·6 %, respectively(Reference Shackleton, Milne and Audas5), followed by further declines of 2·7 %, 1·5 % and 0·4 % between 2016/17 and 2018/19(Reference Daniels, Taylor and Taylor4). However, after the introduction of COVID-19 restrictions in 2020, rates in all three categories rose sharply(Reference Schluter, Ahuriri-Driscoll and Mohammed6). By 2023, the prevalence of child overweight/obesity had returned to pre-COVID levels, though prevalence of extreme obesity remained slightly higher(Reference Schluter, Ahuriri-Driscoll and Mohammed6). Although these declines in weight trends have been observed, obesity in young children remains a prevalent epidemic that requires immediate intervention.
Given the role of diet in the development of child excess adiposity, the establishment of healthy diets in early life represents one of the recommended platforms for maximising reduction and prevention of child obesity(Reference Hawkes, Ruel and Salm7,8) . Recent UNICEF reports have indicated a world crisis in diet quality in childhood, especially in the first 1000 days of life, when insufficient dietary intake of nutrients can irreversibly harm a child’s rapidly growing body and brain(9,10) . However, NZ has limited information on children’s whole diet quality and its associations with healthy weight. The only national information on children’s eating patterns and nutrient intakes is from the National Child Nutrition Survey, which was conducted over two decades ago and involved children from 5 years of age(11).
In the past few years, data from the Growing Up in New Zealand, a nationally generalisable birth cohort in the preschool years(Reference Morton, Ramke and Kinloch12), have been used to help fill some of the national gaps in the overall diet quality of under-5-year-olds. Diet quality was described for 9-, 24- and 54-month-olds using dietary index scores measuring the cohort’s adherence to National Food and Nutritionguidelines(Reference Gontijo de Castro, Gerritsen and Teixeira13–15) and using principal component analyses to identify dietary patterns (DP)(Reference Gontijo de Castro, Lovell and Santos16). Notably, relevant ethnic and sociodemographic inequities in diet quality were observed. Suboptimal diets affected many children, where 4 in 10 children scored below 50 % on the indexes measuring adherence to national food guidelines in early childhood(Reference Gontijo de Castro, Gerritsen and Teixeira13–15). Two DP were identified. A pattern characterised by high intakes of fruit, vegetables and sources of animal and vegetal protein, and a DP characterised by high intakes of refined foods and foods high in sugar, salt and unhealthy fats(Reference Gontijo de Castro, Lovell and Santos16). The identification of this latter DP since infancy is of particular concern and reflects the current food environment in NZ, where energy-dense and nutrient-poor foods are widely available and heavily marketed to children(Reference Eyles, Dodd and Garton17–Reference Gontijo de Castro, Eyles and Ni Mhurchu21). NZ children from lower socio-economic groups are also inequitably more affected by both food insecurity(3,Reference Gerritsen, D’Souza and Goodsell-Matthews22) and food environments with higher exposure to energy-dense and nutrient-poor foods(Reference Sushil, Vandevijvere and Exeter23–Reference Vandevijvere, Molloy and Hassen de Medeiros25). Thus, understanding how this DP in early childhood may be driving excess adiposity in NZ children is paramount. Compared with the assessment of intakes of individual foods and nutrients, DP analyses represent a holistic assessment of population diets that summarises the combined and potentially synergistic effects of different foods that contribute to usual dietary intake(Reference Liberali, Kupek and Assis26–Reference Ambrosini, Emmett and Northstone29). DP can also be easily translated into guidelines(Reference Liberali, Kupek and Assis26) and are useful for investigating associations between diet quality and health outcomes, including child obesity(Reference Liberali, Kupek and Assis26,Reference Ambrosini28–Reference Pala, Lissner and Hebestreit32) .
This study explored the associations between DP and indicators of excess adiposity at 54 months within the Growing Up in New Zealand cohort. It aims to provide nationally generalisable, evidence-based findings to support strategies for child obesity prevention.
Methodology
Population study and data collection waves
This cross-sectional study used data from the Growing Up in New Zealand cohort, which enrolled 6853 children from birth. A total of 6822 pregnant women were included in the cohort based on two criteria; if they were living within the Auckland, Counties-Manukau or Waikato District Health Boards during the study’s enrolment, and if they were expecting to deliver between 25 April 2009 and 25 March 2010. These criteria ensured that the birth characteristics of this cohort were widely generalisable at birth to the NZ population born between 2007 and 2010(Reference Morton, Ramke and Kinloch12). Reference Morton, Ramke and Kinloch The Growing Up in New Zealand study was conducted in accordance with the Declaration of Helsinki. Ethical approval was obtained from the Ministry of Health’s Northern Y Regional Health and Disability Ethics Committee (NTY/08/06/055).
Data on maternal and child sociodemographic and health behaviours were sourced from the maternal antenatal computer-assisted personal interview and from the maternal and child computer-assisted personal interview at 54 months. Information on the anthropometric indicators of body mass index/age (BMI/A) and waist-to-height ratio (WtHR) and DP (as described in ref.16), was sourced from the child interview at 54 months.
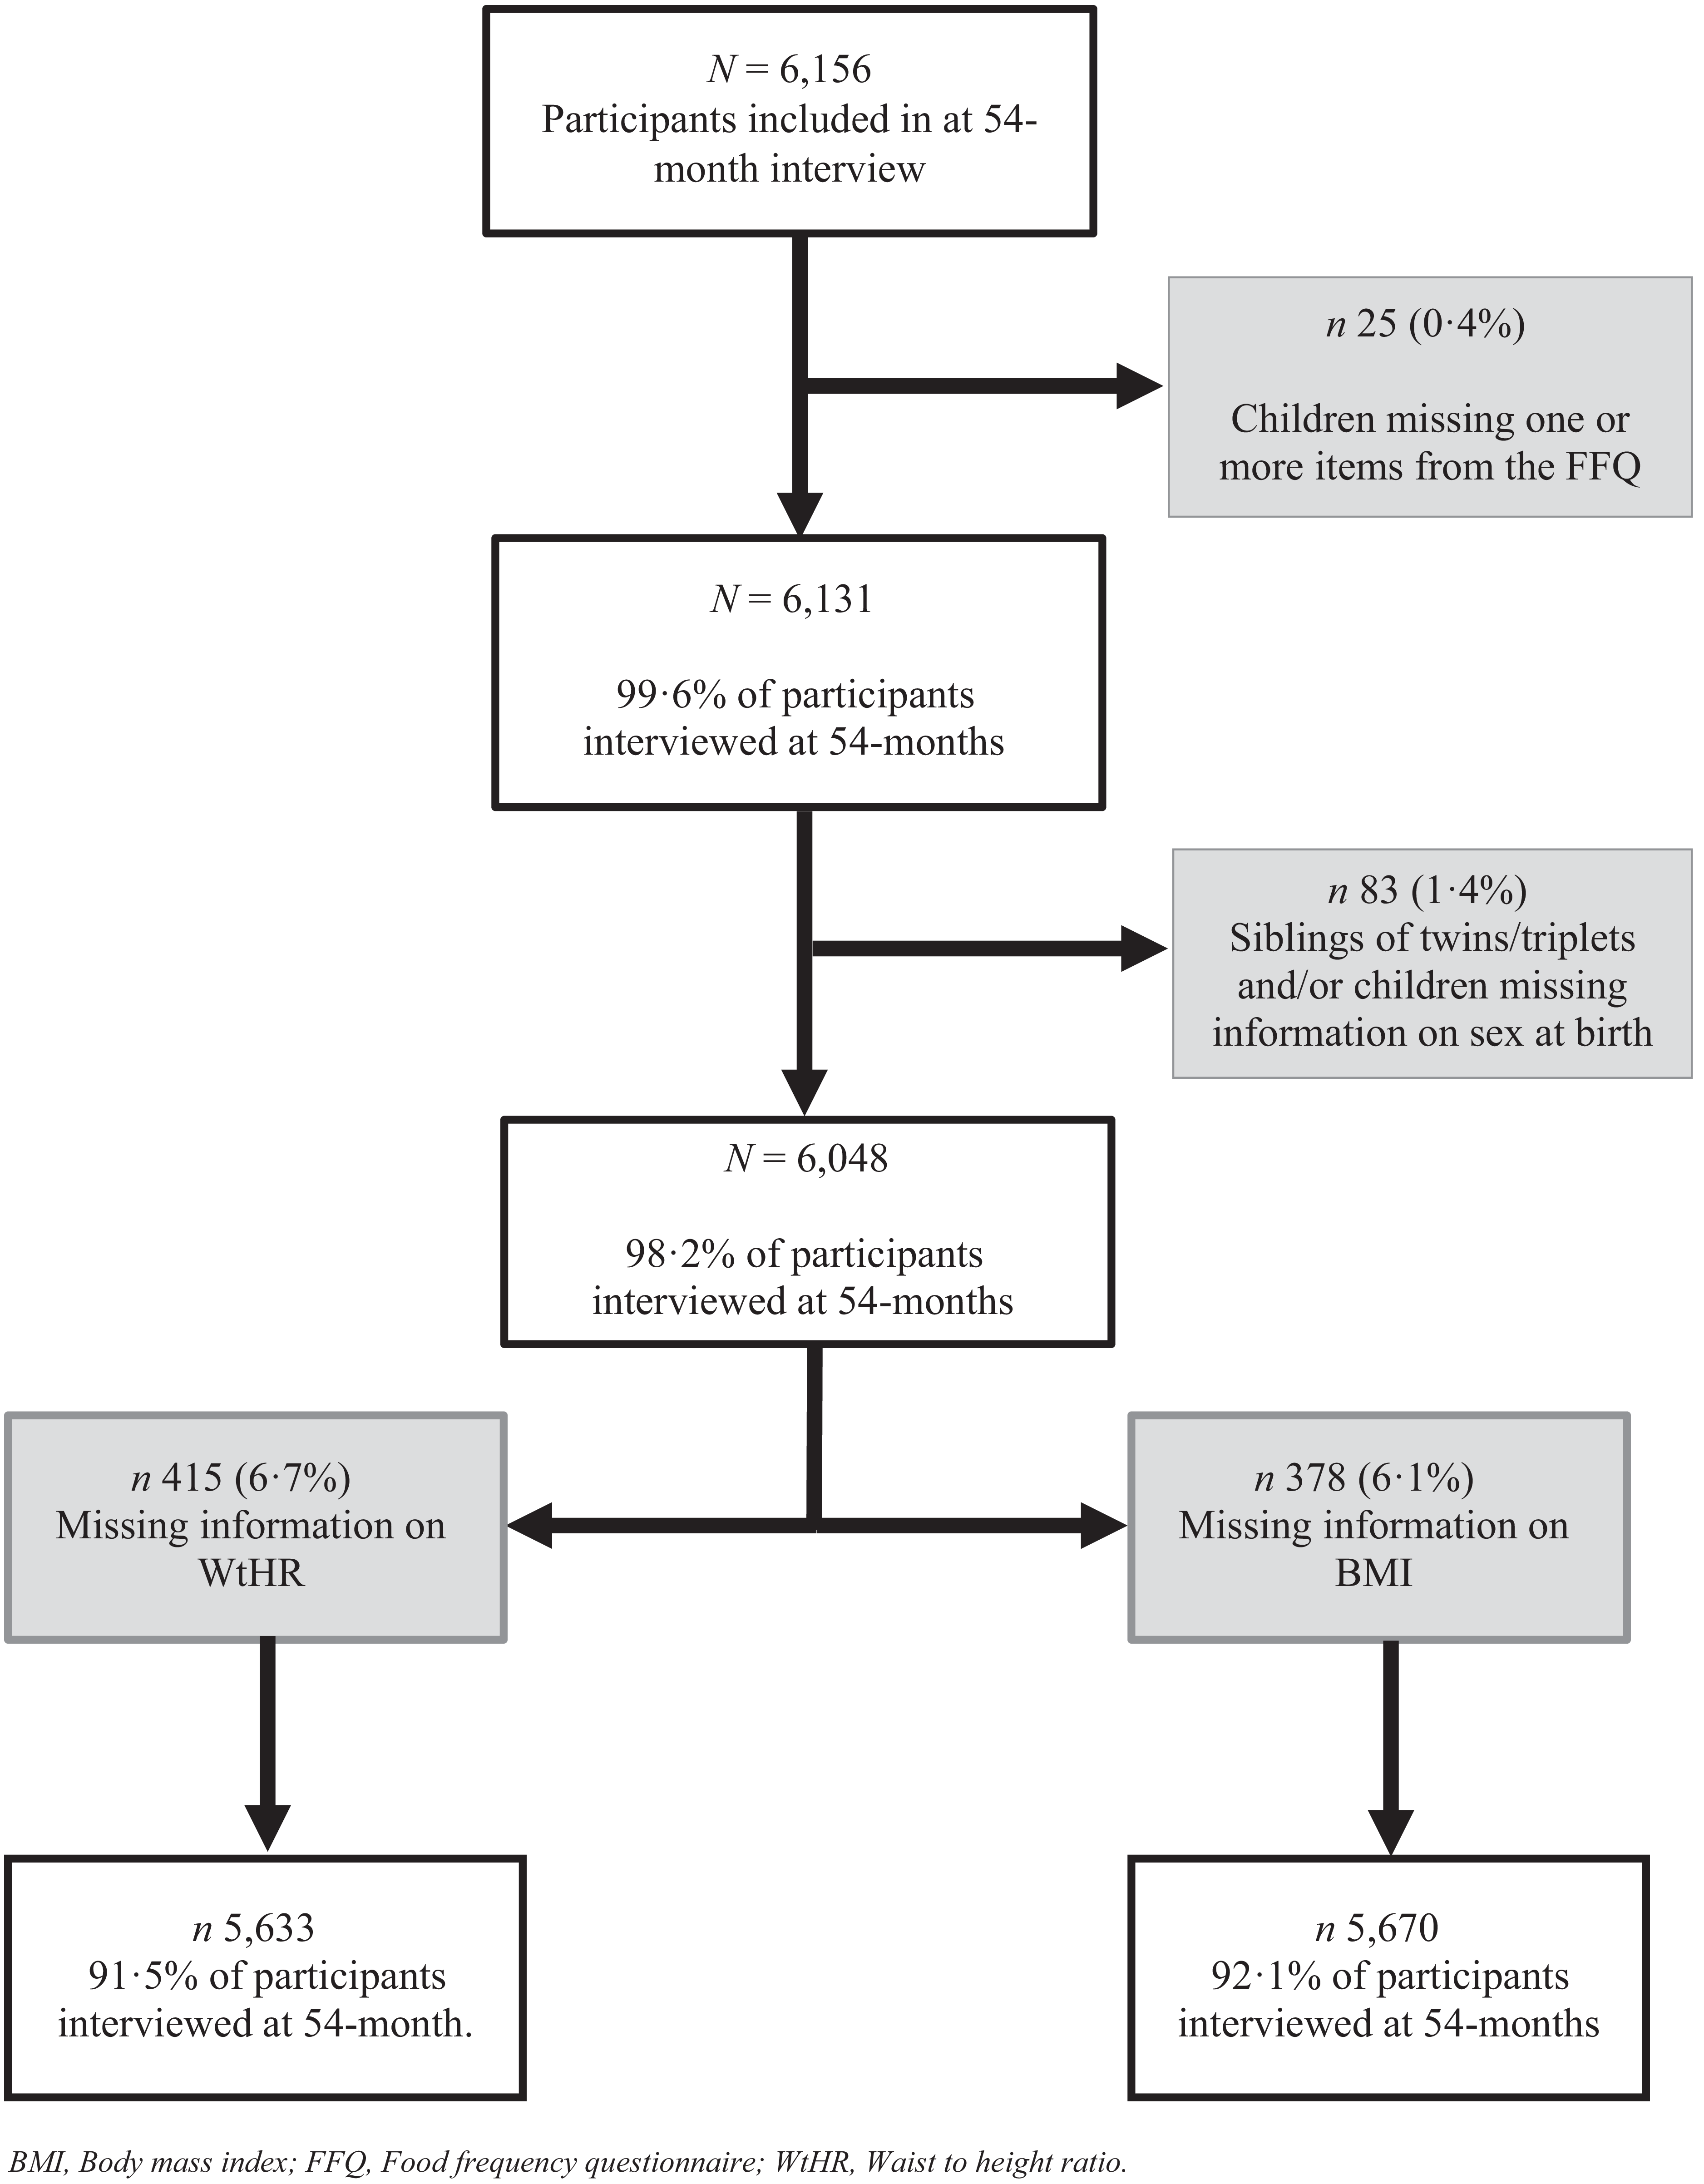
A total of 6156 children participated in the 54-month interview, corresponding to 89·8 % of the 6853 children originally enrolled in the cohort (Figure 1).
Flowchart showing the number of children included in the analysis at 54-months.

Twenty-five (0·4 %) children were excluded from this study because no dietary information was available for them. To examine the associations intended in this study, an additional 1·4 % (n 83) of participants were excluded because they had missing information for biological sex at birth or were siblings of twins/triplets. Siblings were randomly excluded to guarantee the independence of observations in the regression models. Of the 6048 remaining participants, 378 (6·1 %) had missing information either for weight and/or height and were excluded from the analyses examining the associations between children’s DP and BMI/A. Similarly, of the 6048 participants, 415 (6·7 %) had missing data on waist circumference and/or height and were excluded from analyses examining associations with WtHR. In total, 5670 and 5633 children were included in the analyses of associations with BMI/A and WtHR as outcomes (92·1 % and 91·5 % of participants at the 54-month interview – Figure 1).
Children’s dietary patterns at 54 months
Children’s DP were previously derived(Reference Gontijo de Castro, Lovell and Santos16) from information collected in the semi-qualitative FFQ at the 54-month computer-assisted personal interview. The sixty-two-item FFQ was administered to the children’s caregivers, aided by showcards with photos of usual portions of the foods and food groups listed in the FFQ. The dietary tool was designed to capture the children’s usual eating patterns over the 4 weeks preceding the interview and to measure the cohort’s adherence to nationally recommended intakes of foods and food groups for preschoolers at the time of the interview(15). Thus, the FFQ does not provide a full portrait of children’s usual intakes, nor does it estimate total daily energy intake(Reference Gontijo de Castro, Gerritsen and Santos14,Reference Gontijo de Castro, Lovell and Santos16) . To ensure the inclusion of foods commonly consumed by preschoolers, the food list contained in the FFQ was revised based on dietary intake findings from a study conducted in Auckland (NZ) involving 6–23-month-olds(Reference Wall, Brunt and Grant33) and from a nationally representative survey on diets of 5-to-14-year-olds(34). Data from the FFQ at 54 month-interview were previously used to develop a dietary index measuring the cohort’s adherence to the National Food and Nutritionguidelines in place at that time. The index demonstrated face and content validity, as well as convergent construct validity, as evidenced by its ability to discriminate dietary intakes by sociodemographic characteristics(Reference Gontijo de Castro, Gerritsen and Santos14).
As previously described(Reference Gontijo de Castro, Lovell and Santos16), to identify children’s DP at 54 months, the food items and groups included in the FFQ were grouped into thirteen food groups according to the National Food and Nutritionguidelines(15). Then, food intake was estimated as daily servings and used in the principal component analysis which was standardised using a correlation matrix. To decide which factors to retain, rotated factor solutions ranging from 2 to 4 were generated. The number of patterns (components) identified was based on (i) factors with components with eigenvalues > 1·5, breaks in the scree plots, and (ii) the interpretability and meaningfulness of the matrix after varimax rotation. Food items with factor loadings >0·45 or <–0·45 were considered to have moderate to large correlations with the identified DP. Each DP was named according to the food groupings with higher positive factor loading. Thus, two distinct DP were identified and explained 33·6 % of the variability in children’s intake at 54 months. The Refined high in sugar, salt, and fat DP was characterised by high positive loadings on white/refined breads and cereals, as well as on items with high sugar, salt and unhealthy fat content. The Fruit and vegetables DP was characterised by high positive loadings on fruit and vegetables, as well as high loadings on protein food groups, which included lean meats, poultry, fish, shellfish, eggs, legumes, nuts and seeds(Reference Gontijo de Castro, Lovell and Santos16).
Anthropometric indicators at 54 months
At 54 months, weight and height were measured according to international guidelines(35), and the waist circumference was measured according to a national protocol(36). Weight was measured using a Tanita Digital scale (Model HD-351), with a maximum capacity of 200 kg and a precision of 0·1 kg. Height was measured using a laser stadiometer (Precaster CA600) with a capacity of 50 cm and a precision of 0·2 cm. Waist circumference was measured in cm at the midpoint of the child’s torso using a standard flexible measuring tape. Children wore light clothes for all three measurements, with shoes, heavy jackets and head ornaments removed. Two measurements of each, weight, height and waist circumference were taken. A third measurement was taken when the difference between the two measurements exceeded 0·5 kg for weight and 1 cm for height and waist circumference. The final measurements were calculated as the average of the two closest measurements. Children’s BMI/A z-scores were calculated according to the WHO 2006 Growth Standards, where children with scores greater than 2 SD were classified as with overweight/obesity(Reference de Onis37). Children’s BMI/A values below –5 z-scores and above +5 z-scores were considered outliers(Reference de Onis37). Children’s WtHR was calculated by dividing the measurement values of the waist circumference and the height. There is an internationally recommended threshold for classifying central adiposity and cardiometabolic risk based on values of WtHR in adults and paediatric populations (WtHR ≥ 0·5)(Reference Ashwell and Hsieh38). There is ongoing debate on whether sex-, age- and ethnicity-specific thresholds should replace a universal cut-off(Reference Reisinger, Nkeh-Chungag and Fredriksen39,Reference Noubiap, Nansseu and Lontchi-Yimagou40) . Pooled multi-country paediatric data (6–18 years) indicate that the international WtHR threshold falls between the 75th and 95th percentiles across age and ethnic distributions, supporting its use for identifying central obesity and cardiometabolic risk while enabling cross-population comparisons(Reference Eslami, Pourghazi and Khazdouz41–Reference Zong, Kelishadi and Hong43). However, its sensitivity in preschool children remains under-studied, with emerging evidence suggesting a higher age-specific threshold may be required(Reference Munoz-Hernando, Escribano and Ferre44–Reference Taylor, Jones and Williams46). In the Growing Up in New Zealand cohort, at 54 months, the median value for WtHR was 0·51, with approximately 60 % of the cohort classified as having WtHR ≥ 0·5 (data not shown in tables). For this reason, in this study, it was opted to use the >90th percentile value of the WtHR distribution within the cohort, corresponding to a WtHR ≥ 0·55. This treshold was chosen because of its higher probability of identifying central adiposity amongst the 54-month-olds within the cohort.
Mother and child covariates
The selection of maternal and child sociodemographic and health behaviour characteristics influencing child excess adiposity and DP was based on prior literature(3,Reference Shackleton, Milne and Audas5,Reference Gontijo de Castro, Gerritsen and Santos14,Reference Gontijo de Castro, Lovell and Santos16,Reference Flynn, Thompson and Dalrymple47–Reference Mannino, Sarapis and Moschonis54) . Thus, the following variables were adjusted in the models examining the associations between child excess adiposity and DP: (i) children [biological sex at birth (males/females), exact age in months and screen-time usage at 54 months]; (ii) mothers [antenatal: age, education level, prioritised ethnicity, DP, pre-pregnancy BMI; 54 months: smoking habits and New Zealand Index of Deprivation deciles (NZDep)].
At 54 months, children’s caregivers reported the number of minutes per usual weekday their children spent ‘watching television programming including free-to-air, online, and paid TV or DVDs’ and ‘using electronic media e.g. computer or laptop, including children’s computer systems such as Leapfrog, iPads, tablets, smart phones, and any electronic gaming devices’. The total number of minutes spent on these activities each day was classified as either < 60 min of screen time or ≥ 60 min, in accordance with international guidelines(55). Maternal antenatal age was classified as younger than 20 years, between 20 and 34 years inclusive, and 35 years and older. Maternal level of education was classified according to the highest level of education obtained: no secondary school qualification; secondary school qualification (National Certificate of Educational Achievement NCEA 1–4); Diploma (NCEA 5–6); Bachelor’s degree or higher. Maternal ethnicity was prioritised based on the Statistics NZ level 1 ethnicity identification and classification: Māori, Pacific Peoples, Asian, Middle Eastern, Latin American and African (MELAA), Other and European(56). In this study, the groups MELAA and Other were combined for analysis. Maternal pre-pregnancy BMI was calculated from self-reported weight and height measurements, and their BMI values were classified according to the WHO cut-offs: less than 25 kg/m2 as ‘normal weight’; 25 kg/m2 or more but less than 30 kg/m2 as ‘overweight’; and 30 kg/m2 or more as ‘obese’(35). Maternal antenatal DP were derived in a previous study where most interviews took part in the third trimester of pregnancy(Reference Wall, Gammon and Bandara57). Information on maternal antenatal diet was derived from a forty-four-food item FFQ, and the food categories were based on the New Zealand Ministry of Health Guidelines for Healthy Pregnant Women(58). Using principal component analysis, the study identified four distinct DP, which explained 23·4 % of the total variance in dietary intake. The Junk DP was characterised by high positive loadings for confectionery, snacks, takeaways, hot chips, processed meats, soft and energy drinks, battered fried fish or seafood, ice-cream, and cakes or biscuits. The Health Conscious DP had high positive loadings for vegetables, cheese, brown wholemeal bread, non-citrus fruits, yogurt, dried fruits, high-fibre cereal and Vegemite™ or Marmite™. The third DP was named Traditional/White Bread and was characterised by high positive loadings for whole or standard milk, white bread, margarine, jam, honey, marmalade, peanut butter, Nutella™ and low fibre and/or high sugar cereals. Finally, the Fusion/Protein DP had high positive loadings for noodles, rice, pasta, seafood, chicken, green leafy vegetables, eggs and red meat(Reference Wall, Gammon and Bandara57). For the analyses presented in this study, maternal scores in the antenatal DP were ranked and categorised in tertiles.
At 54 months, maternal smoking habits were determined based on the question that enquired if mothers were smoking at least one cigarette a day (yes/no). The information on NZDep deciles at 54 months was used to indicate the level of neighbourhood deprivation the child belonged to. Home addresses were used to determine the level of neighbourhood deprivation based on the NZDep2013(Reference Atkinson, Salmond and Crampton59). The NZDep2013 is presented in deciles from 1 to 10, with deciles 1–2 representing the least deprived neighbourhood and deciles 9–10 representing the most deprived. The index is classified into deciles based on nine socio-economic characteristics from the 2013 census data(Reference Atkinson, Salmond and Crampton59). In this study, the NZDep deciles were categorised into three groups: deciles 1–3, deciles 4–7 and deciles 8–10, with the latter representing the most deprived neighbourhoods.
Statistical analyses
Descriptive statistics were used to report proportions (categorical variables) and means, SD, medians and value ranges (continuous variables). Proportions were compared using Pearson’s χ 2 tests, and means were compared using Student’s t tests. For the overall analyses presented, children’s scores in the DP at 54 months were ranked and categorised in tertiles. When applicable, sex-specific analyses were performed. In these analyses, sex-specific ranking was applied to categorise the children within tertiles of the DP scores at 54 months and to categorise them as ≤90th percentile and >90th percentile of the WtHR distribution. Poisson regression with robust variance was used to examine the associations between BMI/A and WtHR (indicators of excess adiposity; dependent variables) and child DP (independent variables), adjusted for maternal and child covariates as described in the previous section. It was used Poisson regression with robust variance instead of OR, given the cross-sectional design and high outcome prevalence (>10 %). Logistic regression in such settings can substantially overestimate prevalence ratios (PR) and mislead interpretation when outcomes are common. As confounding adjustment depends on the effect measure, OR-based adjustment in cross-sectional analyses may not reflect true PR and is therefore considered inappropriate(Reference Zou60,Reference Barros and Hirakata61) .
Unadjusted and adjusted models were fitted, and associations were presented as PR with 95 % CI. Sensitivity analysis was performed on the models examining the associations between BMI/A and children’s DP by excluding children with outlier BMI/A values. All analyses were performed in R Studio Software (version 4.4.1)(62).
Results
Participant characteristics
Table 1 presents the characteristics of all participants and stratified by sex. Overall, the mean (sd) age of the children was 53·95 (1·6) months, and 51·6 % were boys. Approximately one in seven children were classified with overweight or obesity, as determined by their BMI/A values. One in ten were ranked above the 90th percentile for WtHR. One-third of the children belonged to the most deprived neighbourhoods, and approximately four-fifths were reported to have daily exposure to screens for 60 min or more on average. Antenatally, most mothers (69·9 %) were between 20 and 35 years of age, with only 4·0 % being under 20 years of age. Approximately half of the mothers (51·5 %) were of European ethnicity, four in ten had a Bachelor’s degree or higher level and less than two-thirds had a pre-pregnancy BMI in the healthy range (below 25 kg/m2). At the time of the 54-month interview, 13·1 % of the mothers reported smoking one or more cigarettes a day.
Child and mother sociodemographic and health behaviour characteristics: all cohort and by child sex.

Table 1. Long description
The table presents data on child and mother sociodemographic and health behavior characteristics, stratified by child sex. It includes 14 rows and 10 columns. Column headers are: Participant characteristics, All cohort (n 6048), Females (n 2920), Males (n 3120), and p***. Row labels include Child characteristics at 54 months, Child dietary patterns, BMI/A, Screen time usage, Maternal characteristics - antenatal and at 54 months, and Smoking habits of 54 months. Each row provides specific data points for each category. Notable trends include the distribution of child age, dietary patterns, BMI/A categories, screen time usage, maternal age, education level, ethnicity, pre-pregnancy BMI, and smoking habits. The table highlights differences and similarities between female and male children in various characteristics.
BMI/A, Body mass index/age; WtHR, waist:height ratio; NCEA, National Certificate of Educational Achievement; MELAA, Middle Eastern, Latin American or African; NZDep, Neighbourhood Deprivation Index; NZ, New Zealand.
Missing (all): BMI/A (378); WtHR (415); screen time (¶); child age (¶); maternal age (47); maternal education (61); maternal ethnicity (54); maternal BMI (707); maternal antenatal dietary patterns (1004); NZDep (333); maternal smoking (¶).
Missing (females): BMI/A (177); WtHR (188); maternal age (19); maternal education (27); maternal ethnicity (22); maternal BMI (330); maternal antenatal dietary patterns (478); NZDep (164); maternal smoking (¶).
Missing (males): BMI/A (201); WtHR (227); screen time (¶); maternal age (28); maternal education (34); maternal ethnicity (32); maternal BMI (377); maternal antenatal dietary patterns (526); NZDep (169); maternal smoking (¶).
a Dietary patterns are previously derived(Reference Gontijo de Castro, Lovell and Santos16).
1 Characterised by high factor loadings (>0·45) in refined foods and those high in sugar, salt and unhealthy fats.
2 Characterised by high factor loadings (>0·45) in fruit, vegetables and protein foods (lean meats, poultry, fish, shellfish, eggs, legumes, nuts and seeds).
b Classified according to Statistics New Zealand’s Level 1 classification of ethnicity (Statistics New Zealand, 2020).
c Antenatal maternal dietary patterns previously derived(Reference Wall, Gammon and Bandara57).
d Neighbourhood Deprivation Index 2013.
** Pearson χ 2 tests.
¶ As per the Growing Up in New Zealand study anonymity requirement, ‘<10’ represents greater than 0 and less than 10 children in the cell.
There were significant differences between males and females for the mean BMI/A (mean (sd): females 0·86 (1·17); males 1·03 (1·24); p < 0·001) and the prevalence of overweight/obesity (16 % in males v. 12·1 % in females) (Table 1). There were no significant differences in the means of WtHR between sexes (mean (sd): females 0·51 (0·04); males 0·51 (0·04); p = 0·638), nor between the proportions of children above the 90th percentile (Table 1). There were no significant differences in the distributions of the other child and maternal characteristics by sex (Table 1).
Associations between dietary patterns and indicators of excess adiposity at 54 months
Supplementary Tables 1 and 2 present the distribution of BMI/A >+2 scores-z and WtHR>90th percentile across each independent variable and the results of the univariate analyses. Table 2 presents the findings from the adjusted models for the entire cohort on the outcomes of BMI/A and WtHR. Compared with children ranked in the lowest tertile of the Refined high in sugar, salt, and fat DP, those in the highest tertile had a 51% higher prevalence of overweight/obesity (BMI/A). Analysis of sensitivity excluding children with BMI/A outlier values (Supplementary Table 3) confirmed this independent association (PR = 1·49; 95 % CI 1·18–1·89). However, sex-specific analyses showed that the significant associations between BMI/A + 2 z-scores and the tertiles of the Refined high in sugar, salt, and fat DP were significant only among females, but not among males. Compared with females in the lowest tertile of adherence to this DP, those in the second tertile had a 56 % higher prevalence of overweight/obesity, while those in the third tertile had a 2·14 times higher prevalence of overweight/obesity (Table 3). There was no significant association between children‘s scores in the Refined high in sugar, salt, and fat DP and the outcome of WtHR examined (Table 2).
Adjusted prevalence ratios and respective 95 % CI for the associations between the BMI/A > +2z and WtHR > 90th percentile and the dietary pattern tertiles at 54 months

Table 2. Long description
A table with 22 rows and 10 columns comparing dietary patterns at 54 months with BMI/A and WtHR percentiles. Columns include covariates, Adjusted PR, 95% CI, and p-values for BMI/A and WtHR. Rows detail child dietary patterns, child age, child sex, child screen time, maternal age group, maternal education, maternal ethnicity, maternal pre-pregnancy BMI, maternal antenatal dietary patterns, neighborhood deprivation, and maternal smoking. Notable trends include higher prevalence ratios for overweight/obesity with higher tertiles of refined high in sugar, salt, and fat diets, particularly among females.
BMI/A, Body mass index/age; WtHR, waist-to-height ratio; PR, prevalence ratio; MELAA, Middle Eastern, Latin American or African; NCEA, National Certificate of Educational Achievement; NZDep, Neighbourhood Deprivation Index; NZ, New Zealand.
* N 5670. Missing: maternal age (45); maternal education (59); maternal ethnicity (52); maternal BMI (675); maternal antenatal dietary patterns (947); NZDep (32); maternal smoking (¶).
** N 5633. Missing: maternal age (44); maternal education (58); maternal ethnicity (51); maternal BMI (669); maternal antenatal dietary patterns (935); NZDep (32); maternal smoking (¶).
a Dietary patterns are previously derived(Reference Gontijo de Castro, Lovell and Santos16).
1 Characterised by high factor loadings (>0·45) in refined foods and those high in sugar, salt and unhealthy fats.
2 Characterised by high factor loadings (>0·45) in fruit, vegetables and protein foods (lean meats, poultry, fish, shellfish, eggs, legumes, nuts and seeds).
b Classified according to Statistics New Zealand’s Level 1 classification of ethnicity (Statistics New Zealand, 2020).
c Antenatal maternal dietary patterns are previously derived(Reference Wall, Gammon and Bandara57).
d Neighbourhood Deprivation Index 2013.
¶ As per the Growing Up in New Zealand study anonymity requirement, ‘<10’ represents greater than 0 and less than 10 children in the cell.
Sex-specific adjusted prevalence ratios and respective 95 % CI for the associations between the BMI/A > +2z and the dietary pattern tertiles at 54 months

Table 3. Long description
A table comparing dietary patterns and BMI/A z-scores in females and males. The table has 21 rows and 18 columns. Column headers include Covariates, Females (N 2087), BMI/A > +2z, %, Adjusted PR, 95% CI, p, Males (N 2195), BMI/A > +2z, %, Adjusted PR, 95% CI, p. Row labels include Child dietary patterns at 54 months, Child screen time (average min/weekday) at 54 months, Child age group (years), Maternal highest level of education, Maternal prioritized ethnicity, Maternal pre-pregnancy BMI (kg/m^2), Maternal antenatal dietary patterns, Neighborhood deprivation (INZDep deciles) at 54 months, Maternal smoking at 54 months. Each row provides specific data points for females and males across different covariates.
BMI/A, BMI/age; PR, prevalence ratio; MELAA, Middle Eastern, Latin American or African; NCEA, National Certificate of Educational Achievement; NZDep, Neighbourhood Deprivation Index; NZ, New Zealand.
* N 2087. Missing: maternal age (19); maternal education (27); maternal ethnicity (22); maternal BMI (330); maternal antenatal dietary patterns (478); NZDep (164); maternal smoking (¶).
** N 2195. Missing: maternal age (28); maternal education (34); maternal ethnicity (32); maternal BMI (377); maternal antenatal dietary patterns (526); NZDep (169); maternal smoking (¶).
a Dietary patterns are previously derived(Reference Gontijo de Castro, Lovell and Santos16).
1 Characterised by high factor loadings (>0·45) in refined foods and those high in sugar, salt and unhealthy fats.
2 Characterised by high factor loadings (>0·45) in fruit, vegetables and protein foods (lean meats, poultry, fish, shellfish, eggs, legumes, nuts and seeds).
b Classified according to Statistics New Zealand’s Level 1 classification of ethnicity (Statistics New Zealand, 2020)(56).
c Antenatal maternal dietary patterns are previously derived(Reference Wall, Gammon and Bandara57).
d Neighbourhood Deprivation Index 2013.
¶As per the Growing Up in New Zealand study anonymity requirement, ‘<10’ represents greater than 0 and less than 10 children in the cell.
There was no significant association between children’s overweight/obesity (BMI/A) and central adiposity (WtHR) and their scores in the Fruit and vegetables DP, characterised by high loadings in fruit, vegetables and protein foods: lean meats, poultry, fish, shellfish, eggs, legumes, nuts and seeds(Reference Gontijo de Castro, Lovell and Santos16) (Table 2).
Discussion
In this cross-sectional study conducted within a NZ multiethnic and nationally generalisable cohort of 54-month-olds, female preschoolers with higher scores on a DP characterised by high intake of refined foods and foods high in sugar, salt and unhealthy fats had a higher prevalence of overweight/obesity (BMI/A) when compared with those with lower scores in this pattern. Scores in this DP were not associated with BMI/A > +2 z in males, nor with WtHR > 90th percentile in either sex. There were no associations between children‘s scores in a DP characterised by high intake of fruit, vegetables and protein foods and the two indicators of excess adiposity examined.
Findings from both cross-sectional and prospective studies have shown that high scores in DP that load high on energy-dense nutrient-poor foods are associated with a higher prevalence of child obesity(Reference Liberali, Kupek and Assis26,Reference Ambrosini28,Reference Fernández-Alvira, Bammann and Eiben31,Reference Flynn, Thompson and Dalrymple47,Reference Verduci, Bronsky and Embleton63–Reference Boushey, Ard and Bazzano65) . The naming of DP differs across studies, but they are often characterised by high intakes of energy-dense, processed foods, and those high in fat, sugar, salt and low in fibre(Reference Johnson, Mander and Jones64). Within the Growing Up in New Zealand cohort, the food items that loaded high on the Refined, high in sugar, salt, and fat DP at 54 months also represent a proxy for ultra-processed food intake, as defined by the NOVA classification system(Reference Monteiro, Cannon and Lawrence66). There is a growing number of studies that have demonstrated that higher intake of ultra-processed foods in early childhood is associated with an increased risk of childhood overweight/obesity(Reference Chen, Mousavi and Mandhane67–Reference Popkin and Laar71).
A novel finding in our study was that higher scores on the Refined high in sugar, salt, and fat DP were associated with overweight/obesity (BMI/A) among females, but not among males. Some studies suggest sex heterogeneity in the association between DP and excess adiposity in childhood and recommend sex-specific analyses when examining the influence of diet quality on child obesity(Reference Song, Kim and Lee72–Reference Bahreynian, Paknahad and Maracy76). There is, however, a scarcity of studies examining sex-specific associations between child obesity and DP in the preschool years(Reference Durão, Severo and Oliveira73,Reference Chen, Jacobson and Reyna74) . Findings from two previous cohort studies have reported sex-specific associations similar to those of the Growing Up in New Zealand cohort. The Portuguese population-based birth cohort Generation XXI (N 3823) has shown that a DP with high loading in energy-dense foods (sweet, sugar-sweetened beverages, savoury pastry and processed meat) at 4 years was associated with a higher likelihood of overweight/obesity only among females at 10 years, as measured by the indicator of BMI/A (WHO Growth Standards)(Reference de Onis37,Reference Durão, Severo and Oliveira73) . The prospective, population-based Canadian CHILD Cohort Study (N 2219) has also identified that among females, higher scores in the DP ‘Refined Grain-Snack’ (high in refined grains, dairy, and salty snacks) at 3 years of age were associated with higher odds of obesity (BMI/A, WHO Growth Standards)(Reference de Onis37) and with higher waist circumference z-scores at the age of 5 years(Reference Chen, Jacobson and Reyna74).Findings from the present study align with previous observations from the Growing Up in New Zealand cohort which examined the associations between overall adherence to National Food and Nutritionguidelines during the preschool years (measured via dietary indexes) and excess adiposity at 54 months(Reference Gontijo de Castro, Gerritsen and Teixeira13,Reference Gontijo de Castro, Gerritsen and Santos14) . In adjusted models, females with lower adherence to the guidelines at 9 months had a higher prevalence of overweight/obesity at 54 months (BMI/A), while males had a higher prevalence of values of WtHR > the 90th percentile(Reference Gontijo de Castro, Gerritsen and Teixeira13). In adjusted models, lower adherence to the guidelines at 54 months was associated with a higher prevalence of overweight/obesity (BMI/A) in females but not with WtHR in either sex(Reference Gontijo de Castro, Gerritsen and Teixeira13)
Higher prevalence of child obesity among males has been shown globally, particularly in high- and upper-middle-income countries(Reference Phelps, Singleton and Zhou1,Reference Shah, Cost and Fuller77) . Potential explanations include sex differences in health behaviours associated with childhood obesity, such as sleep, physical activity and screen time, as well as sociocultural, genetic and hormonal factors(Reference Chen, Jacobson and Reyna74,Reference Shah, Cost and Fuller77,Reference Bae and Choi78) . From early life, females generally have higher relative fat mass and circulating leptin levels, both key regulators of appetite and energy balance(Reference Song, Kim and Lee72,Reference Chen, Jacobson and Reyna74,Reference Shah, Cost and Fuller77) . Sex hormones, including oestrogen, also influence insulin sensitivity and fat distribution, contributing to sex-specific metabolic responses to dietary exposures(Reference Song, Kim and Lee72,Reference Power and Schulkin79) . More broadly, evolutionary hypotheses suggest that females may preferentially store lipid. In contrast, males may rely more on glucose and protein metabolism, potentially contributing to the observed differences in susceptibility to obesogenic DP(Reference Power and Schulkin79). In the present study, no sex differences were observed in the distribution of covariates adjusted for in models examining the association between BMI/A > +2z and the Refined high in sugar, salt, and fat DP. However, sex differences were evident in the strength of associations between certain confounders (e.g. screen time) and BMI/A > +2z, which may partly explain the null associations with diet quality observed among males.
Potential underlying mechanisms may explain the associations between higher scores on the Refined high in sugar, salt, and fat DP and overweight/obesity (BMI/A) in this study. This DP was characterised by high loading on foods typically energy-dense, highly palatable, low in fibre and designed to be highly rewarding, which may promote high energy intake and passive overconsumption by overriding normal appetite regulation(Reference Valicente, Peng and Pacheco80–Reference Lane, Gamage and Du82). Another potential mechanism may be the impact of this DP on the gut microbiome. More recently, studies have shown that diets high in saturated fats, simple sugars, additives and ultra-processed foods and inadequate amounts of fibre, fruit and vegetables are associated with a marked reduction in gut microbiome diversity(Reference Ross, Patangia and Grimaud83). Evidence has also shown that child weight status in early childhood is linked with gut microbial biomarkers and metabolic pathways, which may prove relevant to understanding early obesity development(Reference Vázquez-Bolea, Mora-Martínez and Cuervo84–Reference Luo, Li and Luo87). However, further studies illustrating how diet may contribute to gut microbial abundance and measures of adiposity during the preschool years are needed(Reference Ross, Patangia and Grimaud83,Reference Vander Wyst, Ortega-Santos and Toffoli88) . Early childhood represents a critical period of development for the establishment of a healthy gut microbiome, once most of it is developed in the early years, being stabilised approximately at 5 years of age(Reference Ross, Patangia and Grimaud83).
The non-significant adjusted of association between the Refined high in sugar, salt, and fat DP scores and high WtHR values in Growing Up in New Zealand may be explained by the nature of the adiposity measures examined. While BMI/A reflects overall adiposity, WtHR is a marker of central adiposity and cardiometabolic risk(Reference Browning, Hsieh and Ashwell89,Reference Ashwell and Gibson90) . Findings from this cross-sectional analysis suggest that the Refined high in sugar, salt, and fat DP may be more strongly associated with overall adiposity than central adiposity in early childhood. However, further studies within the cohort are needed to elucidate the longitudinal influence of trajectories of dietary quality in early childhood on WtHR values at 54 months and at later time points, as well as sex differences in these associations. Another potential explanation for the lack of association between children‘s WtHR values and scores in the Refined high in sugar, salt, and fat DP may be related to the threshold adopted in this study to classify central adiposity at 54 months (>90th distribution within the cohort, which corresponded to the threshold of 0·55 for both sexes). This analytical approach was used once the international threshold classified approximately 60 % of the cohort as having central adiposity at age 54 months. Further studies are warranted to identify an appropriate threshold for identifying central adiposity during the preschool years.
The non-significant associations between children’s excess adiposity at 54 months and scores on the DP high in fruit, vegetables, and protein sources corroborate with (76–78) and differ from other cohorts(Reference Liberali, Kupek and Assis26,Reference Flynn, Thompson and Dalrymple47,Reference Boushey, Ard and Bazzano65,Reference Warkentin, Stratakis and Fabbri91) . Across the literature, DP similar to the Fruit and vegetables pattern identified within the Growing Up in New Zealand cohort are often regarded as ‘healthy’ DP, with high loadings in one or more food groups such as fruit, vegetables, fish, grains, meat, poultry and legumes. However, variation in the food groups that load higher in these ‘healthy’ DP across studies can offer a possible explanation for differences in the findings reported. For example, in an Australian cross-sectional study of children aged 1–4 years, a positive association between the Traditional DP (high loadings in fruits, vegetables, red meat and grains) and increased risk of childhood obesity was explained by the high consumption of red meat, as the association became non-significant once protein intake was adjusted for(Reference Shi, Makrides and Zhou92). The Fruit and vegetables DP examined in the present study was characterised by high loadings of fruit and vegetables, as the name suggests, as well as in protein foods (lean red meat, poultry, fish, eggs, legumes, nuts and seeds). Thus, children’s high loadings in protein foods, particularly red meat, could partially explain the lack of association observed. Similarly, another Australian prospective cohort study assessed the association between DP at 12 months and childhood obesity among 1170 24–36-month-olds(Reference Bell, Schammer and Devenish93). The study found no significant association between a Family DP (with high loadings of vegetables, fresh fruit, non-white bread, cheese and non-discretionary red meat and poultry) and BMI z-score(Reference Bell, Schammer and Devenish93).
There are some limitations to this study that are worth noting. First, childhood obesity is a multifactorial and complex condition influenced by a wide range of variables that revolve around the child’s and parents’ lifestyle and health behaviours, as well as sociodemographic factors, genetics and other environmental aspects(Reference Ang, Wee and Poh94). This was a cross-sectional study that accounted for a large number of maternal and child sociodemographic and health behaviour characteristics that influence childhood obesity. However, some other variables known to be associated with child obesity were not adjusted for in the models, such as birthweight(Reference Kapral, Miller and Scharf95), breast-feeding duration(Reference Zheng, D’Souza and Atkins96), sleep duration(Reference Hashemi, Ghasemi and Schlichting97) and antibiotic use(Reference Leong, McLay and Derraik98), among others. Thus, the possibility of residual confounding due to failing to adjust for other variables cannot be excluded. Another limitation is that the DP scores used in the analyses employed in this study were derived by principal component analysis(Reference Gontijo de Castro, Lovell and Santos16), which involves a number of subjective decisions made by researchers on aspects such as data grouping and determining criteria for retaining DP, which have the potential to introduce bias(Reference Zhao, Li and Gao99). Additionally, the dietary data used to derive the DP within the cohort were collected via FFQ administered to the children’s mothers. As FFQ collect retrospective information on dietary intake, there is potential for some measurement error due to recall bias(Reference Naska, Lagiou and Lagiou100). This study‘s strength includes that, to our knowledge, this is the first nationally generalisable investigation in New Zealand to examine the influence of DP on unhealthy weight among preschoolers. Assessment of whole-diet quality such as DP provides a holistic overview of dietary intake by considering nutrient interactions and other factors that influence dietary habits, offering a more accurate reflection of true dietary intake than assessing a single nutrient or food group(Reference Johnson, Toumpakari and Papadaki101,Reference So, Kim and Joo102) .
While this study showed significant associations between whole diet quality and overweight/obesity among female individuals, these findings should not be translated into targeting interventions for female preschoolers, as this would have unintended consequences. In New Zealand, there are no mandatory government-led initiatives to improve the healthiness of the NZ food environments(Reference Mackay, Eyles and Gontijo de Castro19), and multiple studies have benchmarked and demonstrated the widespread availability of foods with high content of negative nutrients (including sodium, added sugars and unhealthy fats) and children’s high exposure to marketing of these foods(Reference Garton, Gerritsen and Sing18–Reference Gontijo de Castro, Eyles and Ni Mhurchu21). This study thus calls for inclusive interventions in the food environments to limit children‘s exposure and consumption of energy-dense foods, high in sugar, salt and fat and low in fibre(103). Other strategies include the expansion of the Healthy School Lunches Programme (Ka Ora, Ka Ako)(Reference Aragi, Mackay and Swinburn104) in early childhood education centres and the realisation of periodic national child nutrition surveys to aid evaluation of public health interventions tackling child obesity.
Conclusion
Observations from this multiethnic NZ cohort of preschoolers showed that higher scores on the Refined high in sugar, salt, and fat DP were associated with a higher prevalence of overweight/obesity among females. Further research is warranted to examine the longitudinal impact of early childhood diet on trajectories of healthy weight and sex differences in these associations. Findings call for national strategies to prevent child obesity in early childhood, including mandatory, government-led measures to reduce the availability and marketing of foods high in salt, sugar and unhealthy fats to children.
Supplementary material
For supplementary material/s referred to in this article, please visit https://doi.org/10.1017/S0007114526108356
Data availability statement
The anonymised data that support the findings of this study are available from the Growing Up in New Zealand cohort study, but restrictions apply to the availability of these data, which were used under licence for the current study and so are not publicly available. Data are however available from the corresponding author (Dr Teresa Gontijo de Castro) upon reasonable request and with permission of the Growing Up in New Zealand Data Access Committee (email: dataaccess@growingup.co.nz)
Acknowledgements
The authors thank the participating families in the Growing Up in New Zealand cohort study for their time and for sharing the information that enabled this research. The authors also thank the interviewers and researchers who designed, collected, cleaned and prepared the data for use.
The Growing Up in New Zealand study has been funded by: the New Zealand Ministries of Social Development, Health, Education and Justice; the former Ministry of Science Innovation and the former Department of Labour (now both part of the Ministry of Business, Innovation and Employment); the former Ministry of Pacific Island Affairs (now the Ministry for Pacific Peoples); the former Ministry of Women’s Affairs (now the Ministry for Women); the Department of Corrections; the Families Commission and the former Social Policy Evaluation and Research Unit); Te Puni Kokiri; New Zealand Police; Sport New Zealand; Housing New Zealand Corporation; and the former Mental Health Commission (now part of the Office of the Health and Disability Commissioner); and The University of Auckland and Auckland UniServices Limited. The Growing Up in New Zealand study has been designed and conducted by the Growing Up in New Zealand team, led by the University of Auckland. The authors would like to acknowledge the contributions of the original study investigators: Susan M.B. Morton, Polly E. Atatoa Carr, Cameron C. Grant, Arier C. Lee, Dinusha K. Bandara, Jatender Mohal, Jennifer M. Kinloch, Johanna M. Schmidt, Mary R. Hedges, Vivienne C. Ivory, Te Kani R. Kingi, Renee Liang, Lana M. Perese, Elizabeth Peterson, Jan E. Pryor, Elaine Reese, Elizabeth M. Robinson, Karen E. Waldie and Clare R. Wall. Other support for the study has been provided by the Health Research Council of New Zealand, Statistics New Zealand, the Office of the Children’s Commissioner and the Office of Ethnic Affairs (now the Office of Ethnic Communities).
This work was developed as the content of the master’s thesis of FI. TGC received salary support from the Department of Nutrition & Dietetics of the University of Auckland. The other authors did not receive any specific grant from funding agencies in the public, commercial or not-for-profit sectors.
TGC and CRW designed this study. FI and TGC prepared and analysed the data. FI, TGC, CRW and AL contributed to the data interpretation. FI and TGC drafted the manuscript. CRW and AL critically revised the manuscript draft. All listed authors reviewed and approved the final version of the manuscript.
There are no conflicts of interest to declare.


 Open access

