Introduction
Clinical disorders and environmental stresses compromising headward blood flow generally reveal that loss of vision (LOV) precedes loss of consciousness (LOC) (Middlemore, Reference Middlemore1835; White, Reference White, Gauer and Zuidema1961; Meyer, Reference Meyer2009). The temporal relationship between loss of function in the eye (retina) resulting in LOV and the cephalic nervous system (CPNS) resulting in LOC is considered dependent on the temporal onset of ischemia in each system and the neurologic tissue functional tolerance time [functional buffer period (FBP)] of each system. If the retina and the CPNS have the same time of ischemic onset and the same neurologic tissue time tolerance (FBP) to ischemia, then they should have the same time to the onset of loss of neurologic function. For LOV to precede LOC indicates that there are differences in the time of onset of ischemia and/or the neurologic tissue tolerance (FBP) between the two systems.
In upright humans, gradual application of +Gz-stress, which slowly decreases CPNS level arterial blood pressure (ABP), does result in retinal perfusion compromise with the resulting visual symptoms (LOV) occurring at a lower systolic ABP compared to the remainder of the CPNS resulting in LOC (Lindberg & Wood, Reference Lindberg, Wood and Brown1963; Howard, Reference Howard and Gillies1965). The retina and CPNS are both considered neurologic tissues having similar, if not the same, ischemic neurologic time tolerances (FBP's). Retinal sensitivity to +Gz-induced ischemia is buttressed by its energy requirements demanding the highest rate of oxygen consumption in the body (Anderson, Reference Anderson1968; Toole, Reference Toole1990; Wong-Riley, Reference Wong-Riley2010) and the existence of intraocular pressure (IOP) that opposes ophthalmic systolic ABP at eye level within the CPNS. Rapid onset and offset +Gz-stress above +Gz-tolerance appears to make the temporal onset of ischemia in both retina and CPNS almost coincident thereby negating any effect of IOP differences. With coincident ischemic onset times, the close neurologic time tolerances (FBP's) of the retina and the CPNS result in overlapping times to their loss and recovery of function.
+Gz-stress coincidently affects both the retina and the CPNS. LOV and LOC are induced when +Gz-time neurologic tolerance is exceeded in the retina and CPNS, respectively. Pressure induced retinal ischemia affects only the retina with LOV resulting from an externally increased IOP exceeding retinal level systolic ABP. Investigation of the temporal kinetics of LOV and ROV induced by rapidly increased and decreased IOP was conducted to enable comparison of the kinetics of LOV with LOC and ROV with ROC. This strategy for temporal analysis comparison was selected because retinal ischemic responses to +Gz-stress and increased ocular pressure have been shown to be equivalent in terms of their effects on visual function. Andina (Andina, Reference Andina1937) and Lambert (Lambert, Reference Lambert1945; Lambert & Wood, Reference Lambert and Wood1946) utilized ocular pressure induced ischemia as proof of the retinal origin of LOV induced by +Gz-stress. Stewart indicated that LOV in aviation (+Gz-stress) was intrinsically similar to that produced by external pressure upon the eyeball and “the time taken for the visual field to disappear is proportional to acceleration, the curve being a rectangular hyperbola” (Stewart, Reference Stewart1952). Palena later experimentally demonstrated the rectangular hyperbolic relationship of visual function compromise based on increased IOP changes and time (Palena et al., Reference Palena, Jaeger, Behrendt and Duane1970).
Based on the experimentally defined +Gz-time tolerance curves for +Gz-induced LOC (G-LOC) and +Gz-induced ROC (G-ROC) developed by Whinnery and Forster, very rapid onset and offset +Gz-stress above +Gz-level tolerance defined a limiting minimum induction time of 9.10 s to 9.56 s for loss of CPNS function (Whinnery & Forster, Reference Whinnery and Forster2013) and 8.29 s for recovery of CPNS function (Whinnery et al., Reference Whinnery, Forster and Rogers2014). The current study of the temporal kinetics of LOV and ROV induced by rapidly increased IOP was conducted in a subset of the population used for defining the G-LOC and G-ROC curves. The purpose of the investigation was to define +Gz-time neurologic tolerance (FBP) of the retina during LOV/ROV and apply retinal neurologic tolerance times to develop +Gz-time tolerance curves for retinal (LOV) and CPNS (LOC) tolerance to +Gz-stress. Normalization of the +Gz-induced ischemia kinetics to the time from the onset of ischemia rather than the onset of +Gz-stress was required for comparison with pressure induced ischemia kinetics. Normalization of +Gz-induced loss and recovery of retinal and CPNS function results, along with normalization of other clinical and environmental stresses inducing LOC/LOV and ROC/ROV, provided validation and the opportunity to compare the values of neurologic time tolerance (FBP) found in a variety of clinical and experimental studies.
Materials and methods
During initiation of the fighter pilot high +Gz centrifuge training program (Gillingham, Reference Gillingham1988; Gillingham & Fosdick, Reference Gillingham and Fosdick1988), a short session prior to centrifuge training exposures was included to familiarize those undergoing sustained high +Gz stress exposure with the visual symptoms anticipated to be experienced during their forthcoming centrifuge runs. Demonstration of visual symptoms using self-induced ocular pressure was utilized. The increase in self-applied ocular pressure was well above ophthalmic systolic arterial blood pressure and considered to immediately reduce retinal artery perfusion pressure to zero. Most aircrews were considered likely to have experienced visual symptoms during their actual flying; however, the technique refreshed trainees with the experience and kinetics of visual loss immediately prior to their upcoming high +Gz exposure. Pressure induced retinal ischemia and +Gz-stress induced ischemia measurements were made within approximately 1 h of each other. The occurrence of photopic visual symptoms induced by application of increased ocular pressure was considered to be near the final visual endpoint at which they would be expected to abort their upcoming centrifuge +Gz exposures, if necessary, should they approach their +Gz-tolerance limit to prevent the occurrence of G-LOC.
Aeromedical technicians were responsible for preparing aircrew for their centrifuge training exposures. This included proper fitting of their anti-G equipment, instrumentation such as electrocardiographic lead placement if employed, instruction and practice of an optimal anti-G straining maneuver, and utilizing self-applied ocular pressure to experience the temporal aspects of limiting visual symptoms. The procedures utilized for inducing ocular pressure induced visual symptoms have been previously described (Whinnery, Reference Whinnery1979).
For the visual light loss demonstration, trainees were seated upright approximately 91 cm in front of a smooth surfaced, off-white wall with a single small white light positioned at approximately eye level. Two black lines with a width of 0.5 cm were located on the wall at approximately 45° left and right from and level with the central white light. The single white light served as the focus point and as the extinction light for determining the onset of photopic complete visual BO. Photopic peripheral light loss (PLL) was considered present when the black lines were no longer visible. Ambient room fluorescent lighting was maintained throughout the procedure. The trainees were adapted to this ambient light for a minimum of 1 h prior to the visual light loss demonstration. The central white light was provided by a single, 5 W/120 V (C-7 opaque white), Christmas tree light bulb. The trainees were instructed to maintain gaze directly forward at the light while rapidly applying firm, constant pressure to their right eye.
The aeromedical technician instructed the trainees individually in terms of what visual symptoms would be observed and when to say “now.” The individuals all gently covered their left eye with their left hand and utilized their right index finger to rapidly apply very firm pressure on the inferior eyelid near the lateral epicanthus of the fully opened right eye. Trainees sequentially signaled, by saying “Go” followed by “Now” upon: (1) application of eye pressure, “Go”; (2) the onset of full loss of peripheral vision (loss of the black lines), “Now”; (3) the onset of complete BO, “Now,” along with the immediate release of pressure application; and (4) the onset of a completely normal visual field after instantly releasing eye pressure, “Now.” The individuals did not signal the release of eye pressure since it was coincident with the onset of the complete BO “Now.” There was therefore only momentary maintenance of a complete visual blacked out state. The sequence is shown in Fig. 1. The aeromedical technician utilized a training set stopwatch to record the trainee responses. Trainees generally executed the maneuver once or twice for practice and then performed the maneuver for timing by the aeromedical technician. The duration between the practice runs and the data run for timing was always separated by at least 1 min based on the previous finding of reactive hyperemia lasting at least 30 s from release of a 10 s application of pressure application (Hickam & Frayser, Reference Hickam and Frayser1966). IOP changes of the magnitude (amount and duration) previously reported when conducting repetitive trials were unlikely to have been of sufficient magnitude to alter the current experimental measurements (Gaton et al., Reference Gaton, Ehrenberg, Lusky, Wussuki-Lior, Dotan, Weinberger and Snir2010).
Schematic of the visual compromise events and the time sequence (kinetics) resulting from abrupt self-induced increased ocular pressure. Exact visual fields as mapped with a visual field grid are not shown. The general visual field compromised represents the subjective appearance associated with visual compromise. The grayout period with the onset of dimming is the time from the onset of any visual loss through to the OPLL; the time from OPLL to the OBO and is referred to as TV; coincident with BO immediate release of ocular pressure begins the BO recovery period ending with a completely full visual field with (normal) vision (ROV).

The trainees generally were keenly interested in their time to PLL and BO as a rough estimation of the time to visual loss they might expect if exposed to a very rapid onset +Gz exposure above their tolerance when in-flight. The overall high +Gz-training program was very time sensitive (requiring a relative high daily numerical pilot throughput) and if the trainee did not master the technique quickly the light loss demonstration could be passed over. Over 90% of the trainees were successful in obtaining their visual tolerance loss and recovery times. The response times from 104 trainees, almost all fighter pilots, were available for analysis. Because of additional time and manpower requirements for the procedure, it was not adopted and utilized for all high +Gz-training sessions. The opinion of the trainees relative to their visual compromise experiences was recorded following their centrifuge training runs. This assessment included comparisons that could be made between the self-induced visual compromise (application of pressure) and any visual symptoms experienced during the centrifuge (+Gz) exposures or any in-flight visual symptoms recollected from past experience.
Statistical analysis
The mean, standard deviation (SD), range (minimum–maximum), standard error (SE), mode, and median for the measurements were calculated for the entire group.
All fighter pilots and volunteer human subjects had completed military flying physical examinations and were qualified for flying duties and centrifuge exposure. The inclusion of the pressure induced visual blackout demonstration was conducted at the Naval Air Warfare Center; Warminster, PA. All experimental human research exposure to acceleration related activities was approved by the Advisory Committee for Human Experimentation. All data were included in a database along with the parameters associated with G-LOC if it occurred during the training (Whinnery & Forster, Reference Whinnery and Forster2013; Whinnery et al., Reference Whinnery, Forster and Rogers2014). Data obtained from required military training were not attributable and did not require experimental consent. Subsequent database analyses were exempt in accordance with 45 CFR 46.101.
Safety considerations
No adverse experiences occurred during the studies. Safety aspects related to performing pressure induced BO included the following three precautionary concerns.
1) Limiting the duration of retinal ischemia to prevent retinal tissue integrity compromise (self-induced pressure application was limited to 30 s or less with actual maximum pressure application duration never exceeding 25 s and most trials requiring less than 15 s).
2) Preparation for potential cardiac rate and rhythm disturbances associated with the oculocardiac reflex. (A flight surgeon certified to respond to cardiovascular emergencies with crash cart was always available. The oculocardiac reflex can produce vagal related bradycardia, junctional rhythm, A-V block, and cardiac asystole. No presyncopal or syncopal episodes occurred.)
3) Exclusion of anyone with retinal pathology and in otherwise healthy individuals anyone with high myopia.
Stress normalization
The current study results providing the kinetics of loss and recovery of visual function induced by rapid application and withdrawal of external ocular pressure were integrated with the kinetics of loss and recovery of conscious function induced by rapid onset/offset +Gz-stress, as previously determined (Whinnery & Forster Reference Whinnery and Forster2013; Whinnery et al., Reference Whinnery, Forster and Rogers2014). Integration required normalization of the two stress responses by elimination of the time required to induce/reduce tissue ischemia for each stress. Once the time for each stress to induce/reduce critical ischemia was eliminated, the neurologic time tolerances (FBPs) of retinal and CPNS tissue for induction and recovery could be compared.
Stress normalization for different types of clinical and experimental ischemic induced stresses was also accomplished. This provided the opportunity to compare a variety of stress induction times as well as validate the equivalence of neurologic time tolerance (FBP) associated with different ischemic stresses. The available results from different types of ischemia inducing stresses were normalized and compared with available results from +Gz-stress induced LOV/LOC and ROV/ROC. Only studies in humans with rapid onset induction of retinal and CPNS ischemia were included. With the exception of the cardiac arrest results, the data reflected the response of healthy individuals. Direct comparisons with the past research were challenging based on different experimental methods and lack of common definition for loss of function in the retina and CPNS. Available data for normalization included strangulation, cardiac arrest, increased IOP, and acceleration (+Gz).
+Gz-time tolerance curve development
With knowledge of neurologic tissue time tolerance (FBP), the response of the retina and CPNS to +Gz-stress was integrated to define a general +Gz-time tolerance curve. An integrated +Gz-time tolerance curve describes the neurologic symptoms (visual loss) and sign (LOC) endpoints (x = +Gz-level, y = time of +Gz-exposure) resulting from exposure to continuously linear ramp +Gz-stress profiles exceeding tolerance. Such an approach for integrated +Gz-time tolerance curve development was necessary due to difficulties of coincidentally defining retinal and CPNS endpoints using +Gz-stress alone. +Gz-stress alone induces close and overlapping neurologic time tolerances (FBPs) of the retinal and CPNS tissues during loss and recovery of function. The final approach required independent retinal and CPNS curve development. Consistent with treating the visual system (LOV/ROV) and the CPNS (LOC/ROC) separately, the integrated curves consist of the overlay of the retinal and CPNS tolerance curves.
Results
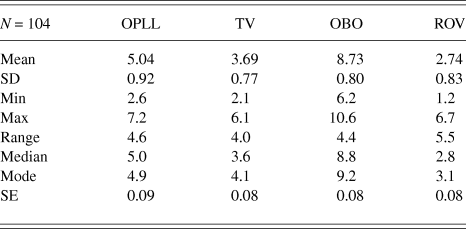
A total of 104 individuals successfully performed the visual loss demonstration prior to their centrifuge training session. All subjects who completed the visual loss demonstration subsequently completed the centrifuge training session. The results, as shown in Table 1, included a single response for each subject with means representing the complete group. Fig. 1 provides the overall schematic of the kinetics of visual compromise and recovery events.
Descriptive statistics for response times (seconds) to rapid onset, self-induced increased IOP producing PLL and BO followed by ROV upon immediate release of ocular pressure. The time from the onset of increased IOP to the OPLL, the duration of the progression through TV, the cumulative time from onset of increased IOP to the OBO, and the time from offset of pressure during BO to recovery of a full visual field (ROV)
Subjective description of vision kinetics
Description of the visual compromise was consistent across all subjects. Subjective descriptions provided further depiction of the initial onset of visual compromise and what has generally been described as grayout. Grayout has been associated with the time from initial visual loss (dimming) through the onset of complete PLL. The general form of the visual field is shown in Fig. 1. Exact visual field pattern compromise quantitation was not accomplished with the patterns shown in the figure representing the qualitative appearance of visual field loss. Only the kinetics and characteristics of the light loss pattern induced was investigated. There was no attempt to fully evaluate the visual acuity aspects resulting from retinal ischemia.
Onset of pressure to initial light loss
Subjects described a period with full and uncompromised visual field and light perception after pressure application. The first indication of light loss (dimming) was suddenly observed within the most peripheral visual field symmetrically progressing inward toward the visual field center. This was considered to be the beginning of PLL and frequently described as slight dimming of the visual field. Most considered they were late in recognizing this point as it developed. Although the earliest peripheral field loss, reproducible measurement in this type of operational demonstration proved unrealistic. This observation (illustrated in steps 2 and 3 of Fig. 1) of the earliest compromise of the most peripheral field of vision (loss of retinal function) occurred at approximately 3 s or about 2.04 s prior to what was considered full compromise of the peripheral visual field (PLL).
Onset of PLL
The visual field smoothly contracted inward in a relatively symmetrical pattern down to a central oval or round island of vision (step 4 in Fig. 1), which was considered the onset of full peripheral light loss (OPLL). This was a reproducible endpoint (considered to be the onset of tunnel vision) and marked the loss of the two vertical black lines located at 45° from the central light.
Induction of tunnel vision
At the end of the peripheral “coning in” period, the remaining oval or round island of visible light initially was associated with the ability to have adequate acuity to see an object (in the remaining island) and was considered to be tunnel vision (TV) by the individuals. This is represented by step 5 in Fig. 1. The oval or round island then appeared to symmetrically contract to a smaller and smaller area with coincident darkening of the remaining field. The coning in of TV to the onset of complete blackout (OBO) was considered the period of progressive TV.
Induction of blackout
Finally, there was an even smaller oval or round island remaining with only the capability to discern a sense of light in that island but visual acuity was loss. Total closure of the perceived light in the very small central island was then lost with a state of complete BO existing (step 6 in Fig. 1). This was considered the OBO.
Recovery of vision
Release of pressure was immediate and coincident with the OBO. Most individuals indicated that immediately upon release of the pressure at complete visual BO, there was an almost instant recovery of the complete oval or round island such that both light and acuity coincidentally returned. It did not slowly “cone out” appearing as a small, full visual island with “normal” acuity and light sensitivity. This is represented by step 7 in Fig. 1. This was followed by a rapid and symmetrical coning out of the visual field to normal light discrimination and full acuity, step 8 in Fig. 1. The onset of a normal visual field without any vestige of dimming was considered the recovery of full vision (ROV), step 9 in Fig. 1.
The individuals considered that the visual blackout sequence produced by the ocular pressure demonstration was qualitatively similar to that associated with the centrifuge +Gz-stress runs having a gradual onset rate (<1.0 G/s) of acceleration taken to their visual tolerance endpoint. The principal reason for making only qualitative comparisons of visual alterations was because the centrifuge runs were not designed to rapidly take the individuals well above their protected +Gz-level tolerance and induce complete LOC during the centrifuge training. The standard acceleration visual endpoint in +Gz-exposure was generally equivalent to the OPLL endpoint in the visual loss demonstration for centrifuge exposures. The majority of individuals either did not report having observable visual loss during the rapid onset runs or were too busy with other tasks (over the short +Gz-exposure period) to make accurate comparison with the ocular pressure demonstration. Light loss symptoms were not measured during +Gz-training. In addition, Ham's experience with tilt-board related syncope resulted in his consideration that confusion resulting from neurologic compromise preceding LOC made visual symptom reporting (recollection of BO) unreliable on the centrifuge or in-flight (Ham, Reference Ham1943).
Alternate visual light loss patterns, such as initial grayout over the complete visual field and other patterns, have been previously reported by some individuals exposed to +Gz-stress (Green, Reference Green, Rainford and Gradwell2006). None of the 104 individuals reported in this study indicated that they had alternate visual compromise patterns. Such individuals may have been in the less than 10% of individuals not able to master the self-induced visual loss expected in the light loss demonstration or such alterations may be less likely to occur with pressure induced retinal ischemia.
Stress normalization
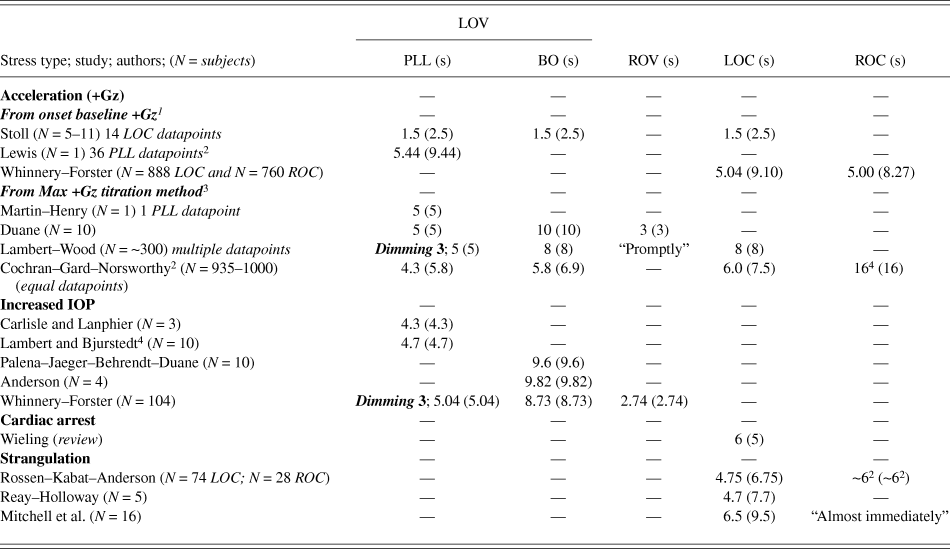
Normalization of the LOV/ROV results from the current study and other types of ischemia inducing stress producing LOV/LOC and ROC/ROV is provided in Table 2 along with specific study characteristics and normalization requirements. The available data were separated by the type of stress including strangulation, increased IOP, cardiac arrest, and acceleration (+Gz). The acceleration results were further separated into two groups based on the +Gz-stress profiles utilized to determine tolerance.
List of studies utilizing different types of stress with measurement of LOV that includes dimming, PLL, and BO; ROV; LOC; and ROC. Within each study band, the normalized values are given with the original reported values given above in parentheses
1 Data generated using linear ramp profiles for rapid onset rate data.
2 Reanalysis of original data required to accomplish normalization.
3 Data generated from ramp to plateau titration profiles for rapid onset rate data.
4 Lack of precise definition for measurements terms.
Acceleration +Gz-stress
Acceleration results were separated by whether the neurologic time tolerance measurements were made utilizing +Gz-stress profiles titrating the +Gz-exposure to a tolerance level (ramp to plateau exposures) or were measured from the onset of base +Gz-level with the exposure taken to a tolerance endpoint (linear ramp to endpoint exposures). The titration method utilizes a series of ramp to plateau exposures with similar ramp onset rates and a constant time plateau. The ramps were not always linear. The titration method to determine +Gz-level cardiovascular tolerance begins with exposures well below +Gz-level cardiovascular tolerance and progress with small +Gz-level plateau increases (0.2–0.5 G) to plateau levels where LOV and LOC endpoints occur. The total time at the tolerance plateau to an endpoint (PLL, BO, and LOC) is considered +Gz-time neurologic tolerance (FBP) with the lowest plateau +Gz-level inducing symptoms (LOV) or signs (LOC) considered the +Gz-level cardiovascular tolerance for each system (eye and CPNS). The time from onset at base +Gz to the plateau was not frequently included in the reported times for the titration method.
Utilizing continuously linear ramp onset rate profiles to an endpoint, the time from base +Gz to the time of endpoint occurrence is considered the loss of consciousness induction time (LOCINDTI). Tolerance endpoints are determined by the LOCINDTI and the +Gz-level where symptoms or signs occur. When comparing the two +Gz-tolerance methods, the LOCINDTI consists of the ramp time plus the plateau time when employing the titration method. The titration method assumes that the symptom or sign endpoint occurs at a measured time during the plateau (not during deceleration after the plateau). The titration method, with lower maximum +Gz-level plateaus, is more frequently utilized for rapid onset +Gz-exposures to avoid exposure to very high +Gz-levels that would induce G-LOC. Linear ramp profiles to endpoints were predominantly utilized for gradual onset exposures taking individuals to lower +Gz-levels with less risk of LOC.
No normalization was required when utilizing the titration tolerance method and assuming that the ramp was approximately linear. Martin–Henry found the time to PLL to be 5 s (Martin & Henry, Reference Martin and Henry1951a; Martin & Henry, Reference Martin and Henry1951b). Duane found the time to PLL (5 s), BO (10 s), and ROV (3 s) (Duane, Reference Duane1953; Duane, Reference Duane1954; Duane, Reference Duane1966; Duane, Reference Duane1967). Lambert et al. (Lambert & Wood, Reference Lambert and Wood1946), Wood et al. (Wood et al., Reference Wood, Lambert, Baldes and Code1946), and Lindberg et al. (Lindberg & Wood, Reference Lindberg, Wood and Brown1963) reported their cumulative experimental results of dimming (approximately 3 s), PLL (5 s), BO (8 s), and LOC (8 s) with ROC designated as occurring “promptly” upon +Gz-offset. A linear ramp could not be assumed for the Cochran et al. exposures with reported times to PLL (5.8 s), BO (6.9 s), and LOC (7.5 s). Recovery, although not defined as ROC and with no offset profile characteristics provided, was stated to be 16 s (Cochran et al., Reference Cochran, Gard and Norsworthy1954). The Cochran et al. titration method exposure profiles had one onset rate profile for generating all data. Their data were included because of the large number of datapoints even though rapid onset criteria were not met. If a linear, rapid onset rate of 1.4 G/s is considered to be used in their exposures, then the results have the following values: PLL (4.3 s), BO (5.8 s), and LOC (6.0 s).
Normalization, separating the time to induce ischemia and the time from onset of ischemia to the endpoint, was required for data utilizing LOCINDTI. Stoll utilized LOCINDTI to define a +Gz-time tolerance curve currently considered to be the standard (Gauer & Henry, Reference Gauer and Henry1953; Stoll, Reference Stoll1956; Gillingham, Reference Gillingham1988; Gillingham & Fosdick, Reference Gillingham and Fosdick1988; Acceleration, 2002; Woodrow & Webb, Reference Woodrow and Webb2011). Caution must be taken to ensure that the actual Stoll curve is utilized in subsequent publications. The Martin–Henry curve (Martin & Henry, Reference Martin and Henry1951a; Martin & Henry, Reference Martin and Henry1951b) is frequently displayed and referred to as the Stoll curve (Gillingham, Reference Gillingham1988; Gillingham & Fosdick, Reference Gillingham and Fosdick1988). The Martin–Henry curve was based on the tolerance titration method rather than the time from the onset from base +Gz to endpoint (LOCINDTI). Endpoints for the Stoll curve included grayout, BO, confusion-possibly unconsciousness, and unconsciousness with a limiting (minimum) LOCINDTI of 2.5 s. The induction time for the Stoll rapid onset rate data was considered to be 1.0 s resulting in a normalized neurologic tolerance time of 1.5 s. The Stoll method of employing the LOCINDTI was utilized in defining the previously reported Whinnery–Forster +Gz-LOC curves (Whinnery & Forster, Reference Whinnery and Forster2013) with the limiting (minimum) LOCINDTI time to LOC being 9.10 s. The normalized time for ROC was 5.29 s from the Whinnery–Forster data. The Lewis experimental data utilizing the titration method provided adequate experimental data to determine the loss of vision induction time (the endpoint being PLL) such that the times for both methods could be calculated. The 4 s to maximum +Gz-plateau haversine ramp exposures (N = 36 exposures) were converted to linear onset rates (0.75 G/s to 1.5 G/s) and the resulting times to PLL calculated with the rapid onset rate data utilized. The Lewis induction time for PLL utilizing LOCINDTI methods was 9.44 s with the time at plateau (titration method) being 5.44 s (Lewis, Reference Lewis1955).
Strangulation
The results for strangulation included the cervical neck cuff occlusion experiments of Rossen et al. (Rossen et al., Reference Rossen, Kabat and Anderson1943) and the law enforcement method of neck compression (Reay & Holloway, Reference Reay and Holloway1982; Mitchell et al., Reference Mitchell, Roach, Tyberg, Belenkie and Sheldon2012). Both techniques are considered to result in head level trapping of a volume of oxygenated blood, which prolongs onset of ischemia (Rossen et al., Reference Rossen, Kabat and Anderson1943; Howard, Reference Howard and Gillies1965). Rossen et al. induced cervical neck compression to 600 mmHg within 0.125 s with the subjects taken to LOC requiring 6 s. Mitchell et al. found the time to be 9.5 s with the lower level of neck compression pressure of 200–400 mmHg to eye fixation. Reay and Holloway found the time from onset of neck compression to release as the subjects began to lose consciousness to be 7.7 s. The manual neck compression studies were noted to take the subjects to near LOC and/or eye fixation without specific mention of loss of postural motor control. Howard considered that the amount of trapped blood available in the brain in such procedures would prolong consciousness for approximately 2.5–3.0 s compared to sudden +Gz-induced anemia (Howard, Reference Howard and Gillies1965). Normalization therefore included a compression onset time requirement of 1 s for the manual application of neck compression and consideration of the trapped blood adding 2 s within the measured induction time. Recovery time from Rossen et al. was found to range from 5.9–6.4 s with no numerical values reported from neck compression (Forster & Whinnery, Reference Forster and Whinnery1992).
Increased ocular pressure
All increased ocular pressure experiments were considered to require less than one second for ischemia induction, therefore no normalization was required. The increased ocular pressure studies of Carlisle et al. (Carlisle et al., Reference Carlisle, Lanphier and Rahn1964) and Lambert et al. (Lambert & Bjurstedt, Reference Lambert and Bjurstedt1952) both lacked rigorous definition of the visual endpoint; however, based on other studies by the respective authors, the visual endpoints were not BO endpoints and were considered to be PLL endpoints. Overall, the increased ocular pressure studies indicate that the approximate neurologic time tolerance to PLL is 5 s and the time to BO from an onset of pressure of 9 s. ROV time is not frequently reported with the Whinnery–Forster ROV time being 2.74 s from immediate offset of pressure and ischemia.
Cardiac arrest
The review of cardiac arrest and dysrhythmia studies provided by Wieling and his research group (Krediet et al., Reference Krediet, Parry, Jardine, Benditt, Brignole and Wieling2011; Wieling et al., Reference Wieling, Krediet, Solari, de Lange, van Dijk, Thijs, van Dijk, Brignole and Jardine2013) indicated the neurologic tolerance time for LOC to be approximately 5 s. Normalization provided for 1 s associated with measurement of the onset of ischemia beginning after the final cardiac contraction as measured from the last QRS complex on the electrocardiogram. Comparisons should be made with individuals in the upright (+1 Gz) position.
Summary
The above results, comparatively presented in Fig. 2, provide normalization results of the available responses for PLL, BO, LOC, ROV, and ROC. The time for stress induction of critical loss of arterial blood flow (time to onset of critical ischemia) is separated from the neurologic time tolerance (FBP) for the retinal and CPNS tissues supporting visual and conscious function.
Normalization of experimental and clinical study results determining neurologic time tolerance in the eye (retina) and CPNS supporting visual and conscious function separated by the stress type, specific study, and endpoints. Experimental stress is separated by the time to induce critical ischemia in the neurologic tissue in green and the time the neurologic system (eye or CPNS) continues normal function until symptoms or signs occur in black (PLL), red (BO and LOC). ROV is given in blue and ROC in yellow. Component and overall experimental times are also provided in each study band. PLL(NG) = PLL value not reported.
+Gz-time tolerance curve development
The neurologic time tolerance (FBP) for the retina in the current pressure induced LOV studies was found to be 5.04 s for PLL and 8.73 s for BO. In addition, visual dimming was found to occur at approximately 3 s. The +Gz-time neurologic tolerance (FBP) for the CPNS, based on the Whinnery–Forster G-LOC curves, was found to be 5.10 s based on a LOCINDTI time of 9.10 and a 4 s time to attain the +Gz-level cardiovascular tolerance level of +5 Gz using rapid onset rates of ≥ 1.0 G/s (Whinnery & Forster, Reference Whinnery and Forster2013). These values were considered to represent +Gz-time neurologic tolerance (FBP) for +Gz-time tolerance curve development.
For curve construction, a value of +3 Gz was chosen for the retinal +Gz-level cardiovascular tolerance with the +Gz-level cardiovascular tolerance for the CPNS considered to be +4 Gz based on the difference due to IOP being approximately +1 Gz. The resulting +Gz-time tolerance curves for continuously linear onset ramp profiles taken to retinal tolerance (dimming, PLL, and BO) are shown in Fig. 3. The resulting +Gz-time tolerance curve for CPNS tolerance (LOC), also based on continuously linear onset ramp profiles, is overlaid on the retinal tolerance curves and included in Fig. 3. It should be emphasized that the curves of Fig. 3 represent the maximum +Gz-tolerance curves resulting from linear onset rate profiles taken to the respective endpoints. Minimum +Gz-tolerance curve limits can be drawn based on utilizing the ramp to tolerance plateau titration method that provides only the neurologic time tolerances (FBPs). Although not recognized in previous curve development, the +Gz-time tolerance is dependent on the experimental profile utilized with tolerance being predicted by the +Gz-tolerance envelope between the minimum (ramp to plateau profiles taken to an endpoint) and maximum (linear ramp to an endpoint) curves. The minimum and maximum curves do approach each other asymptotically as onset rate increases (vertical arm) and decreases (horizontal arm).
+Gz-time tolerance curves based on +Gz-level cardiovascular tolerance of +3 Gz in the retina (supporting visual function) and +4 Gz in the cephalic nervous system (supporting conscious function). +Gz-time neurologic tolerance for visual dimming was 3.00 s, PLL 5.04 s, BO 8.73 s, and LOC 5.10 s. The dashed line separates rapid onset +Gz-stress (≥1.0 G/s) from gradual onset rate stress. Above dashed line, the onset rate (rapid onset) symptom and sign onset times have reached their limiting response times. Below that onset rate (gradual onset), the curves depend on the combination of +Gz-level cardiovascular tolerance (+3 Gz for the retina and +4 Gz for the cephalic nervous system) in association with their respective +Gz-time neurologic tolerance.
Discussion
Review of data from the current and other available studies reveals good agreement between studies having different methods of ischemia induction with the approximate neurologic time tolerance (FBP) for the retina supporting vision (dimming 3 s, PLL 5 s, BO 9 s, and ROV 3 s) and the CPNS supporting conscious function (LOC 5 s and ROC 5 s). The exception is that of Stoll where all +Gz-time tolerance endpoints (from both visual and conscious function compromise endpoints) are considered equal and limited by the normalized value of 1.5 s for rapid onset +Gz-stress if the onset from base +Gz-level to critical ischemia is considered to be only 1 s. The rapid onset rate component of the +Gz-time tolerance curve of Stoll therefore conflicts (too short) with all other experimental and clinical data in healthy humans.
The difference in the +Gz-time tolerance metrics using the titration method (ramp to plateau) and onset time from a base +Gz-level to endpoint (linear ramp using LOCINDTI) has been reason for confusion in acceleration physiology. This is evident when the results of Martin–Henry (Martin & Henry, Reference Martin and Henry1951a; Martin & Henry, Reference Martin and Henry1951b) are considered. They utilized the titration method to determine PLL tolerance with retinal neurologic time tolerance (FBP) found to be 5 s based on the time at plateau only. Stoll appears to have utilized the Martin–Henry ABP response curve with a slight time offset (increased time) to define the low +Gz-level portions of her curve without specifically noting any method or time difference between the titration method utilized by Martin–Henry and the LOCINDTI method employed in her curve development (Gauer & Zuidema, Reference Gauer, Zuidema, Gauer and Zuidema1961). The Martin–Henry curve is consistent with other data if the curve is represented by plotting only the time at plateau (x-axis) and +Gz-level (y-axis). It is not interchangeable with the Stoll curve, which used LOCINDTI to define the x-axis of the curve. The Martin–Henry curve appears to be simply based on the head level ABP response to a single individual taken to PLL, since additional supporting data were not published (Martin & Henry, Reference Martin and Henry1951a; Martin & Henry, Reference Martin and Henry1951b; Gauer & Henry, Reference Gauer and Henry1953).
Both intracranial pressure (ICP) (Magnaes, Reference Magnaes1976; Klarica et al., Reference Klarica, Radoš, Erceg, Petošić, Jurjević and Oreškovic2014) and IOP (Jorge et al., Reference Jorge, Ramoa-Marques, Lourenco, Silva, Nascimento, Queiros and Gonzalez-Meijome2010; Lee et al., Reference Lee, Yoo, Jung, Hwang and Kim2012) are known to change with +Gz-stress and the +Gz protective methods employed (Vieira et al., Reference Vieira, Oliveira, De Andrade, Bottaro and Ritch2006; Murgatroyd & Bembridge, Reference Murgatroyd and Bembridge2008). Hydrostatic pressures models generally neglect ICP with retinal perfusion pressure and CPNS differing only by IOP which is also not considered to change significantly (Howard, Reference Howard and Gillies1965; Burton, Reference Burton1986; Burton, Reference Burton2000a; Burton, Reference Burton2000b; Green, Reference Green, Rainford and Gradwell2006; Banks et al., Reference Banks, Brinkley, Allnut, Harding, Davis, Johnson, Stepanek and Fogarty2008). These assumptions result in retinal ischemia onset at a lower eye level systemic ABP than the CPNS at the same level in the +Gz-field. If the neurologic time tolerance of the retina and CPNS is the same, visual symptoms precede symptoms or signs within the CPNS. Gradual onset (<1 G/s) ischemia with its slower systolic ABP reduction provides differential ischemic induction between the retina and the tissues above and at the same level as the retina within the CPNS. Rapid onset (≥1 G/s) ischemia appears to almost coincidently result in retinal and CPNS ischemia with visual symptoms (PLL) and LOC occurring coincidently.
LOV occurs over a time band period (PLL to BO = 3 s; Dim to BO = 5 s) whereas LOC is considered to occur at a point in time. ROC is also measured as a point in time but evidence of other signs (such as myoclonic convulsions) occurring during recovery suggests that CPNS components recover function over a time band with measurable endpoints (Whinnery & Whinnery, Reference Whinnery and Whinnery1990) within the LOC to ROC time period. LOC has not been parsed into symptoms or sign endpoints during induction; however, the symptoms of what has been considered almost loss of consciousness (A-LOC) (McGowan, Reference McGowan1997; Morrissette & McGowan, Reference Morrissette and McGowan2000) investigated by near infrared spectroscopy (NIRS) (Shender et al., Reference Shender, Forster, Hrebien, Ryoo and Cammarota2003; Ryoo et al., Reference Ryoo, Sun, Shender and Hrebien2004) may provide clues into the CPNS component system temporal failure sequence during +Gz-onset induced ischemia as part of the complete G-LOC syndrome (Whinnery, Reference Whinnery1990).
+Gz-level cardiovascular tolerance is required to define both retinal and CPNS tolerance for +Gz-time tolerance curves; however, defining a single value is challenging for a variety of reasons. +Gz-level cardiovascular tolerance has considerable individual difference and is altered by physiologic (muscular and respiratory) and psychologic (including severe in-flight stress) changes, as well as protective technology application (anti-G suits with pressure breathing and anatomic positioning in the +Gz-field). Basic +Gz-level cardiovascular tolerance also changes as +Gz-stress is applied based on cardiovascular reflex responses which are considered additive to other modes of protection that increase heart level ABP. +Gz-time neurologic tolerance is also required to define +Gz-time tolerance curves; however, the neurologic tolerances, as defined in this study, appear to be considerably less variable.
The curves in Fig. 3 differ from the Stoll curve and other previously developed curves (Martin & Henry, Reference Martin and Henry1951a; Martin & Henry, Reference Martin and Henry1951b; Gauer & Zuidema, Reference Gauer, Zuidema, Gauer and Zuidema1961; White, Reference White, Gauer and Zuidema1961). The curves for LOV (dimming, PLL, and BO) and LOC, based on linear onset ramp profiles to endpoints, are rectangular hyperbolas with the vertical arms degenerating into the vertical asymptote based on the limiting (minimal) time to their respective endpoints. The horizontal arms are predicted to decrease asymptotically approaching their respective +Gz-level cardiovascular tolerance levels. Additional modification to these curves, including definition of the horizontal arms, may be possible based on a detailed understanding of the +Gz-level cardiovascular tolerance both early (during the period of cardiovascular reflex response) and late (when prolonged stress may reduce tolerance based on fatigue or vascular pooling altering venous return). No early cardiovascular reflex based dip in the horizontal arm of the curve was defined based on the existing mean data from population-based studies having considerable variation in +Gz-level cardiovascular tolerance. The existence of a BO-LOC rollover point between the retinal and CPNS curves is based on the combination of a lower +Gz-level cardiovascular tolerance for the retina compared to the CPNS combined with a longer +Gz-time neurologic tolerance for retinal BO compared to CPNS LOC. For an integrated +Gz-time tolerance curve covering both LOV and LOC, the BO-LOC rollover point represents the curve coordinates during more gradual onset rates where CPNS function determines the overall symptoms and signs associated with ischemic stress. Visual symptoms become determined by the functional state of the CPNS along the LOC curve. The curves should be applicable to various experimental and clinical situations that involve alteration of the body position within gravitational or acceleration fields. Loss and recovery kinetics provide the temporal relationships between neurologic symptoms and signs in clinical populations having syncopal episodes associated with different rates of ischemia induction in the retina and CPNS.
Although curves integrating ROV and ROC were not included, the relationship between functional recovery of the retina and CPNS, each with distinct endpoints (ROV and ROC), was defined. For rapid offset (≥1 G/s) continuously linear ramp +Gz-profiles, the retina would be predicted to recover function 2.74 s after +Gz-cardiovascular tolerance is attained. The CPNS recovers conscious function 8.29 s after LOC onset generally occurring at the maximum +Gz-level of the exposure. Recovery +Gz-level cardiovascular tolerance is based on the combination of a completely relaxed physiologic state (unconscious state; loss of postural motor control) and compensatory increases in ABP that occur during +Gz-exposures. The time from offset of ischemia to ROC was 5.29 s with convulsive muscular contractions occurring during this period of recovery (Whinnery & Whinnery, Reference Whinnery and Whinnery1990) prior to ROC. Normalization of the recovery FBPs for retinal ROV (2.74 s) and CPNS ROC (5.29 s) predicts that the retina is functional and capable of providing visual input to the CPNS upon its recovery that fully reintegrates conscious function of the human organism.
Conclusions
+Gz-induced ischemia of the CPNS is dependent on the rate of onset/offset of +Gz-stress as well as the environment (pressure) and location of the component systems within the CPNS. Symptoms (LOV/ROV) and signs (LOC/ROC) signify functional failure in CPNS component systems. Stress normalization can be utilized to establish when component system ischemia is initiated. With the exception of the Stoll curve, when experimental and clinical data are normalized, there is agreement in neurologic tissue ischemic tolerance (FBP). When retinal and other CPNS components experience coincident onset of ischemia, the time to their functional failure is equivalent. If regional ischemic differences exist, functional CPNS component failure is manifested by signs and symptoms signifying which CPNS component systems exceed neurologic tolerance. The relationship of ischemic onset and component system functional failure can be defined by +Gz-time tolerance curves. The +Gz-time tolerance relationships between the retina and the remainder of the CPNS supporting conscious function exposed to rapid onset ischemia were defined in this study.