


Introduction
Few mental-health service indicators are as intuitively persuasive – and as vulnerable to overinterpretation – as early psychiatric readmission. Its observability in administrative data has made readmission and post-discharge follow-up part of international benchmarking (Hermann et al., Reference Hermann, Mattke, Somekh, Silfverhielm, Goldner, Glover, Pirkis, Mainz and Chan2006). Yet early return to hospital reflects the index admission and discharge process, clinical severity, previous service use, social circumstances, follow-up availability and local care systems. It is therefore neither a pure measure of inpatient quality nor an estimate of an individual patient’s probability of readmission (Durbin et al., Reference Durbin, Lin, Layne and Teed2007). Comparisons across six European registries have further shown that database interoperability and indicator definitions constrain cross-country comparability (Katschnig et al., Reference Katschnig, Straßmayr, Endel, Berger, Zauner, Kalseth, Sfetcu, Wahlbeck, Tedeschi and Šprah2019). Monitoring therefore requires an explicit denominator, time window and analytical level; observed variation should not be attributed to a single component of care.
Workforce capacity offers a plausible, but indirect, pathway to this indicator. Effective availability could support discharge planning, timely follow-up, medication continuity, information exchange and crisis response during the inpatient-to-community transition (Vigod et al., Reference Vigod, Kurdyak, Dennis, Leszcz, Taylor, Blumberger and Seitz2013; Donisi et al., Reference Donisi, Tedeschi, Salazzari and Amaddeo2016). Medical and nursing staff were selected because both are core clinical workforce groups reported longitudinally in the national mental-health information system and contribute to these transition functions. Their combined headcount density provided the most consistently available territorial measure for testing whether changes in nominal workforce capacity tracked the official indicator; it was not intended as a proxy for full-time-equivalent availability, deployment, workload or delivery of specific processes. Any ecological association therefore depends on organisation, patient need and local context. Medicaid evidence similarly links 30-day psychiatric readmission to health-system characteristics beyond measured case mix (Busch et al., Reference Busch, Epstein, McGuire, Normand and Frank2015), while guideline-derived early-intervention models treat staffing, access, organisation and transitions as interdependent rather than interchangeable (Scognamiglio et al., Reference Scognamiglio, Martiadis, Diaspro, Viacava, Longobardi, Rea, Iniziato, Saviano and La Pia2026b).
Italy offers a particularly informative setting. Its community-oriented system is organised through regional structures and Departments of Mental Health (Dipartimenti di Salute Mentale), while national systems report service resources and psychiatric hospital activity (Ferrannini et al., Reference Ferrannini, Ghio, Gibertoni, Lora, Tibaldi, Neri and Piazza2014; Italian Ministry of Health, 2016–2026). Annual reports place Italian Mental Health Information System (Sistema Informativo per la Salute Mentale; SISM) workforce headcounts alongside official Hospital Discharge Record (Scheda di Dimissione Ospedaliera; SDO) early-readmission indicators, but whether their within-territory changes move together is unknown. We examined the longitudinal ecological association between lagged medical-nursing headcount density and the official provider-side 30-day indicator, with the corresponding 7-day indicator prespecified as a secondary outcome, across the 21 territorial units in 2015–2024. The study also addresses joint interpretation of resource and hospital-use indicators. Its locked analysis plan, frozen panel, source hierarchy and scripted workflow support auditability; it did not estimate individual risk, reconstruct residence-based pathways or test causal staffing effects.
Methods
We conducted a retrospective longitudinal ecological panel study of 21 stable territorial units in Italy over outcome years 2015–2024, yielding 210 Region/Autonomous Province (PA)-year observations. Italy has 20 administrative Regions. The Trentino-Alto Adige/Südtirol aggregate was not included as an additional unit because the source series reported the PAs of Bolzano/Bozen and Trento separately. The panel therefore comprised the remaining 19 Italian Regions plus these 2 PAs; no territorial area was double counted. The unit of analysis was the Region/PA-year. The study used routinely collected, publicly available aggregate administrative and statistical data; no individual-level records were accessed, linked or analysed. Reporting followed the Strengthening the Reporting of Observational Studies in Epidemiology (STROBE) and REporting of studies Conducted using Observational Routinely-collected health Data (RECORD) statements; completed checklists are provided as Supplementary Checklists C1 and C2. The design estimated longitudinal ecological associations at territorial level, not individual risk, patient-level effects or causal staffing effects (Morgenstern, Reference Morgenstern1995; von Elm et al., Reference von Elm, Altman, Egger, Pocock, Gøtzsche and Vandenbroucke2007; Subramanian et al., Reference Subramanian, Jones, Kaddour and Krieger2009; Benchimol et al., Reference Benchimol, Smeeth, Guttmann, Harron, Moher, Petersen, Sørensen, von Elm and Langan2015; Italian Ministry of Health, 2016–2026).
Before any inferential model was fitted, we locked a Statistical Analysis Plan (SAP). The plan specified the analytic population, outcome and exposure definitions, model hierarchy, treatment of source blanks, primary estimator, inferential procedures, and secondary and sensitivity analyses. It also required that any subsequent source correction be documented as a versioned deviation rather than incorporated silently. The locked plan was accompanied by an outcome-definition and comparability memorandum, a source audit, a frozen analytic panel, and a Secure Hash Algorithm 256-bit (SHA-256) data-freeze manifest. The plan, outcome and audit documentation, frozen panel, analytical scripts, certified results, and quality-control records are openly available in the public reproducibility repository (Scognamiglio, Reference Scognamiglio2026a).
Data were assembled from the annual reports of the Italian Mental Health Information System, including annual early-readmission indicators derived from Hospital Discharge Records, and from Italian National Institute of Statistics (Istituto Nazionale di Statistica; ISTAT) resident-population data disaggregated by age and territory. For the adult-population denominator, we used the historical ISTAT population-estimate resource for outcome years 2015–2018 and the current resident-population series for outcome years 2019–2024. Before modelling, we performed a documentary audit of the published SDO-derived outcome numerators and denominators. When alternative presentation formats were available, the relevant annual full-report SDO tables and accompanying source workbooks were treated as authoritative for quantitative extraction. We then constructed and froze the source-derived Region/PA-year panel before inferential analysis. Source blanks were retained as missing values; no imputation, interpolation, carry-forward procedure or recoding of missing values to zero was undertaken (Italian Ministry of Health, 2016–2026; Italian National Institute of Statistics, 2026).
The scripted workflow verified checksums, panel identifiers and timing, denominator positivity, and agreement between reported indicators and their numerators and denominators. All transformations, exclusions, estimates, inference and reporting checks were scripted; analytical values were not manually edited. For outcome year t, SDO outcomes and denominators referred to that calendar year, workforce headcounts to 31 December of t − 1, and population denominators to residents aged 18 years or older on 1 January of t. The lag aligned year-end headcount with staffing at the start of the subsequent outcome year. Outcome counts and the eligible-discharge offset were attributed to the territory of hospitalisation, whereas workforce density used the adult resident population. This created an intrinsic provider-side/resident-denominator mismatch. The frozen data contained neither patient residence nor a cross-boundary flow matrix; residence-based pathways and mobility could not be reconstructed, and no quantitative mobility sensitivity was attempted (Italian Ministry of Health, 2016–2026; Italian National Institute of Statistics, 2026).
The primary outcome was the annual Region/PA-level count of official SDO-reported unplanned readmissions within 30 days after eligible ordinary discharges from public psychiatric wards. The annual number of eligible ordinary psychiatric discharges was used as the denominator for descriptive indicators and as the offset in regression models. The corresponding official count of unplanned readmissions within 7 days was the prespecified secondary outcome, included as a shorter-window administrative assessment of whether the observed pattern differed for very early return to hospital. Outcome counts and eligible-discharge denominators were available for all 21 territorial units in all 10 outcome years. Because the publicly available documentation did not disclose the complete technical linkage and classification algorithm underlying the published indicator, we analysed the official measure as reported and did not attempt to reconstruct the linkage procedure, the operational definition of unplannedness, or the handling of transfer episodes and other administrative contingencies. The indicators were therefore treated as provider-side annual administrative aggregates, not as measures of individual readmission risk, preventability, treatment effectiveness or individual continuity-of-care performance (Italian Ministry of Health, 2016–2026).
The primary exposure combined SISM medical-staff and nurse headcounts at 31 December of t − 1 per 100,000 adult residents on 1 January of outcome year t. It did not measure full-time-equivalent posts, hours or clinical time and was available for 205 observations. SISM supplied physician and psychiatrist headcounts as separate source series; the psychiatrist series contained 19 source blanks, and four 2015 values exceeded the corresponding physician values. We retained the reported values and analysed the series separately without enforcing arithmetic nesting. The physician series was available for 205 observations and the psychiatrist series for 191. Profession-specific models were fitted separately with a prespecified common-sample verification; no staff-mix composite was constructed (Supplementary Table S1; Italian Ministry of Health, 2016–2026; Italian National Institute of Statistics, 2026).
The confirmatory association was estimated using Poisson pseudo-maximum likelihood (PPML), with the annual 30-day readmission count as outcome, the natural logarithm of eligible ordinary psychiatric discharges as offset, and Region/PA and outcome-year fixed effects. The primary specification included continuous lagged medical-nursing headcount density and no time-varying covariates. Formally, E[Yit|Xi ,t−1, αi, γt] = Dit × exp(βXi ,t−1 + αi + γt), where Yit was the readmission count, Dit the eligible-discharge denominator, Xi ,t−1 lagged headcount density, and αi and γt unit and year fixed effects. The model estimated within-territory associations conditional on discharge volume, stable territorial characteristics and common annual changes. Estimates were incidence rate ratios (IRRs) per 10 additional staff per 100,000 adults. PPML was treated as a quasi-likelihood conditional-mean estimator; inference did not rely on equidispersion. Model-family selection was not based on dispersion diagnostics, visual fit or post hoc comparison with alternative estimators (Santos Silva and Tenreyro, Reference Santos Silva and Tenreyro2006; Correia et al., Reference Correia, Guimarães and Zylkin2020).
The discharge offset defined an estimand conditional on eligible psychiatric discharge volume. A population offset would instead combine discharge generation with post-discharge returns and was not treated as an interchangeable robustness analysis.
Inference was clustered at the Region/PA level, yielding 21 territorial clusters. Conventional cluster-robust inference using a t reference distribution with 20 degrees of freedom was calculated as a companion procedure. The primary small-cluster inference used a restricted wild cluster score bootstrap with the null imposed, 9,999 Rademacher-weight draws and inversion of two-sided score tests to obtain 95% confidence intervals. Before the study models were applied, the resampling procedure was checked in 1,000 simulated null panels preserving the 21-unit by 10-year structure; this validation included completion checks, finite bootstrap and t-based p-values, and verification of score-interval inversion. For the study models, scripted quality-control checks assessed outcome and offset completeness, denominator positivity, model convergence, finite coefficients and standard errors, valid bootstrap p-values, and confidence-interval bracketing. These diagnostics did not trigger data trimming, transformation, model-family substitution or data-driven modification of the confirmatory specification (Cameron et al., Reference Cameron, Gelbach and Miller2008; Cameron and Miller, Reference Cameron and Miller2015; Roodman et al., Reference Roodman, Nielsen, MacKinnon and Webb2019).
Secondary, sensitivity and diagnostic analyses were specified before model fitting and did not replace the confirmatory analysis. They excluded 2020, 2020–2021 or 2015; used a 2-year lag or lead/placebo timing; examined the 7-day outcome, profession-specific densities and a common sample; added lagged population ageing and psychiatric hospital-bed density; included unit-specific linear trends; fitted a weighted linear fixed-effects model of the 30-day indicator; repeated the PPML model after omitting each territorial unit and each outcome year; and tested nonlinearity with a 3-knot restricted cubic spline. Profession-specific models formed a secondary three-test family for which nominal and Holm-adjusted wild-score p-values were reported. The common-sample models were verification analyses, not additional independent tests (Supplementary Table S1). No data-driven covariate selection, outcome redefinition, model-family search or post hoc promotion occurred (Thor et al., Reference Thor, Oh, Apte and Deasy2020). Table 2 numbers these analyses S1–S13 as SAP identifiers, distinct from Supplementary Table/Figure numbers.
After the prespecified analyses, descriptive post-SAP checks – without re-estimating or modifying the confirmatory model – audited interval calculations, quantified residual exposure variation, appraised precision through a conditional minimum detectable effect and summarised stored model diagnostics. They were neither confirmatory nor sensitivity analyses, and no achieved-power claim was made (Supplementary Table S3).
All data management, freeze verification, descriptive analyses, model estimation, resampling-based inference and reporting checks were performed in R version 4.6.0 (R Core Team, 2026). Fixed-effects PPML and weighted linear fixed-effects models were estimated using the fixest package, version 0.14.1 (Bergé et al., Reference Bergé, Butts and McDermott2026). The R project was managed with renv, and script-level metadata, package-session information, frozen-input checksums, quality-control outputs and reporting artefacts were retained as part of the analytical audit trail.
OpenAI Codex (GPT-5, accessed through ChatGPT; OpenAI, San Francisco, CA, USA; https://chatgpt.com/) was used in June–July 2026 to assist with drafting, debugging, refactoring and checking R code for data validation, statistical analysis, reporting and figure export. Study design, estimands and analytical decisions were specified by the authors in the locked SAP. All AI-assisted code was reviewed and revised as needed by the authors, who executed the archived scripts against the frozen data and verified all reported results.
Results
The frozen panel comprised 210 Region/PA-year observations from the 21 territorial units over 2015–2024 (Table 1). Outcome counts and eligible-discharge denominators were complete. Lagged medical-nursing headcount density was available for 205 observations. Source blanks excluded Calabria in 2017–2018, Bolzano/Bozen in 2018–2019 and Abruzzo in 2018; none was recoded or imputed. Their observed 30-day indicators ranged from 11.20% to 13.83%, within the 4.36–26.68% range among retained observations. The primary sample therefore contained 205 observations, while outcomes and denominators remained available for all 210 (Table 1; Supplementary Table S2).
Annual description of the Region/Autonomous Province-year panel and official SDO early-readmission indicators, Italy, 2015–2024

Table 1 Long description
For each outcome year from 2015 to 2024, the table reports data availability across 21 territorial units, eligible ordinary psychiatric discharges, 30-day and 7-day readmission counts and percentages, and median [IQR] lagged medical-nursing workforce density per 100,000 adults. Outcome and denominator data are complete at 21/21 in every year. Exposure availability is 21/21 except 2017 (20/21), 2018 (18/21) and 2019 (20/21). Eligible discharges decline from 95,530 in 2015 to 71,827 in 2020 and rise to 81,135 in 2024. The 30-day indicator is 17.13%, 17.69%, 13.86%, 13.83%, 14.58%, 13.54%, 13.96%, 14.59%, 14.79% and 14.33% from 2015 to 2024; the 7-day indicator is 7.58%, 7.84%, 7.00%, 7.12%, 7.92%, 7.50%, 7.75%, 8.26%, 8.36% and 8.12%. Annual median workforce density ranges from 32.6 to 36.2 per 100,000 adults, with the annual IQRs reported in the final column.
Notes: Annual discharge and readmission counts and indicators are national provider-side aggregates obtained from the official SDO series. Availability is the number of Regions/Autonomous Provinces with the relevant data among the 21 territorial units.
Lagged workforce density was calculated from physician and nurse headcounts at 31 December of year t − 1 per 100,000 residents aged 18 years or older at 1 January of outcome year t. The median and IQR summarise the available territorial values in each outcome year. Source blanks were retained as missing; no imputation was performed.
IQR, interquartile range; PA, Autonomous Province; SDO, Hospital Discharge Records.
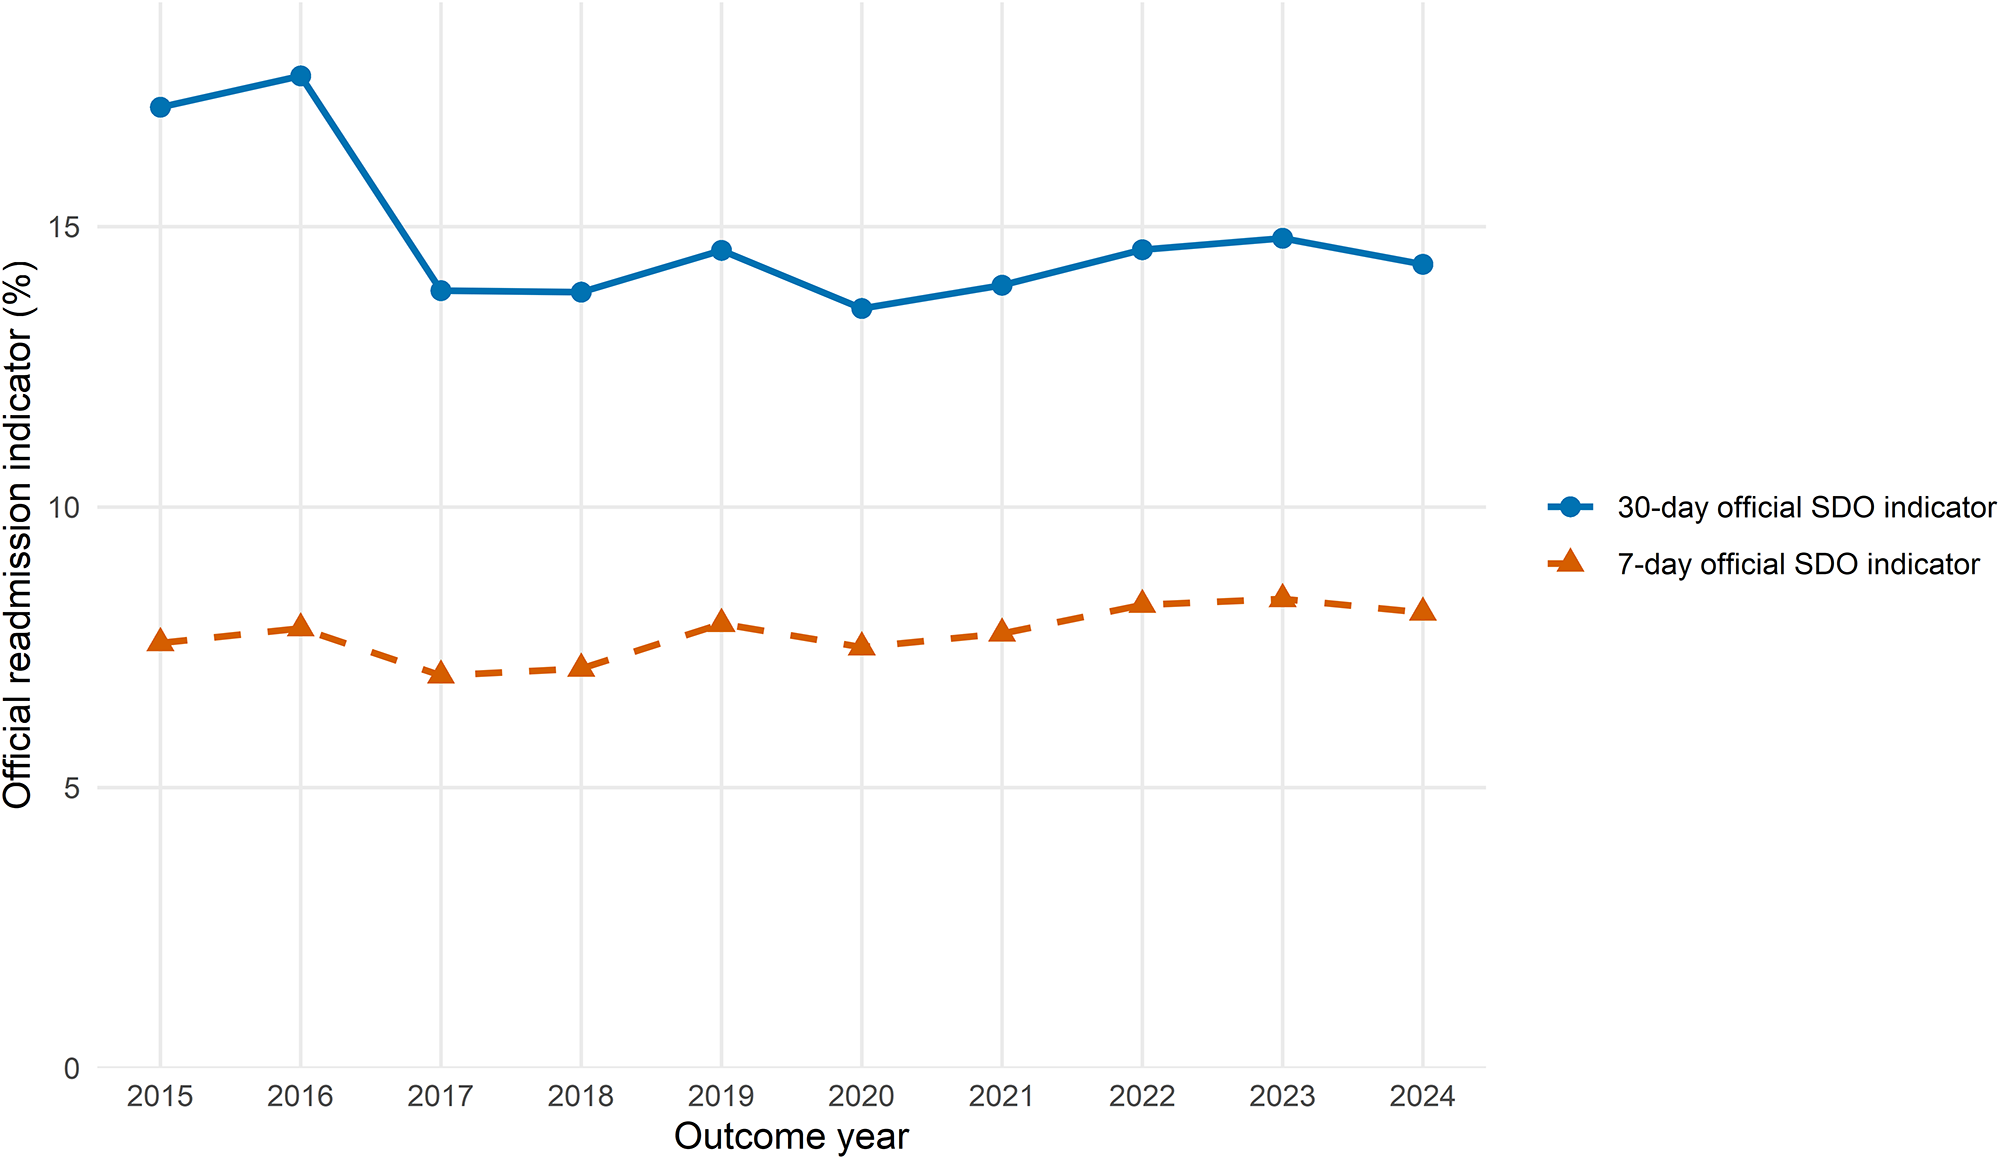
National provider-side descriptive indicators are shown in Figure 1 and Table 1. Eligible ordinary psychiatric discharges numbered 95,530 in 2015, 93,912 in 2016 and 90,227 in 2019, before falling to 71,827 in 2020; they subsequently increased to 81,135 in 2024. The official 30-day early-readmission indicator was highest in 2016, at 17.69%, declined to 13.54% in 2020, and was 14.33% in 2024. The corresponding 7-day indicator ranged from 7.00% in 2017 to 8.36% in 2023 and was 8.12% in 2024. Across territorial units, the annual median lagged medical-nursing headcount density in Departments of Mental Health ranged from 32.6 per 100,000 adults in 2023 to 36.2 per 100,000 adults in 2016. The annual interquartile ranges remained broad, from 27.6–43.0 per 100,000 adults in 2024 to 33.7–45.3 in 2016 (Table 1; Supplementary Figure S1). Region/PA trajectories of the official 30-day indicator are shown in Supplementary Figure S2.
National official SDO early-readmission indicators, Italy, 2015–2024. Annual national provider-side aggregates. The 30- and 7-day indicators were calculated as counts of official SDO-reported unplanned readmissions within 30 and 7 days, respectively, divided by eligible ordinary psychiatric discharges. Values are percentages. No fitted trajectories are shown.

Figure 1 Long description
The chart shows annual national provider-side official SDO early-readmission indicators for 2015–2024. The 30-day percentages are 17.13, 17.69, 13.86, 13.83, 14.58, 13.54, 13.96, 14.59, 14.79 and 14.33. The corresponding 7-day percentages are 7.58, 7.84, 7.00, 7.12, 7.92, 7.50, 7.75, 8.26, 8.36 and 8.12. The 30-day indicator is highest in 2016 and lowest in 2020; the 7-day indicator is lowest in 2017 and highest in 2023. No fitted trajectories are shown.
The confirmatory PPML analysis included 205 Region/PA-year observations and 21 clusters (Table 2). The IRR for 30-day readmissions per 10 additional medical-nursing staff per 100,000 adults was 1.006 (score-inverted 95% CI 0.934–1.034; restricted wild score p = 0.8095). The companion cluster-robust t(20) 95% CI was 0.966–1.048 (p = 0.7476). The primary score interval corresponds to relative changes from −6.6% to +3.4%. Thus, the data did not provide evidence of a detectable longitudinal ecological association between variation in lagged medical-nursing headcount density and the official provider-side 30-day indicator (Table 2; Figure 2).
Primary confirmatory analysis and prespecified secondary, sensitivity and diagnostic analyses for official SDO early-readmission indicators, Italy, 2015–2024

Table 2 Long description
Panel A reports PPML incidence rate ratios per 10 additional medical-nursing staff per 100,000 adults. Primary: n = 205, IRR 1.006, score-inverted 95% CI 0.934–1.034, p = 0.8095. Sensitivities: exclude 2020, 1.007 (0.930–1.036), p = 0.8180; exclude 2020–2021, 1.002 (0.929–1.030), p = 0.9184; exclude 2015, 1.012 (0.954–1.052), p = 0.5059; two-year lag, 0.995 (0.937–1.039), p = 0.7250; lead/placebo, 1.042 (0.937–1.082), p = 0.4682; context-adjusted, 1.016 (0.955–1.055), p = 0.4024; unit-specific linear trends, 0.995 (0.955–1.035), p = 0.5388; 7-day outcome, 1.032 (0.929–1.075), p = 0.6743. Panel B gives leave-one-unit-out IRRs 0.974–1.015 and leave-one-year-out IRRs 0.978–1.044; all confidence intervals include 1. Panel C gives spline nonlinearity p = 0.8572. Panel D gives the weighted linear estimate + 0.215 percentage points, 95% CI − 1.159 to + 0.704, p = 0.7203.
Notes: Panel A reports incidence rate ratios (IRRs) from PPML models. Unless otherwise specified, models included Region/Autonomous Province and outcome-year fixed effects, used the logarithm of eligible ordinary psychiatric discharges as an offset, and clustered inference at the level of the 21 territorial units.
The primary small-cluster procedure was a restricted wild cluster score bootstrap with the null imposed, 9,999 Rademacher-weight draws and inversion of two-sided score tests for 95% confidence intervals. Displayed p-values are restricted wild score p-values. For the primary confirmatory analysis, the companion cluster-robust t(20) 95% CI was 0.966–1.048 (p = 0.7476).
The lead/placebo analysis used subsequently measured workforce density aligned to the current outcome-year population. The context-adjusted model included the lagged proportion of residents aged 65 years or older and lagged psychiatric hospital-bed density and covered 2016–2024. The official 7-day outcome was secondary and otherwise used the primary PPML specification.
Panel B summarises the 31 S12 influence re-estimates; every score-inverted confidence interval included the null. Panel C reports the test of the nonlinear spline term, retaining the linear exposure term and the primary fixed effects; knots were at the 10th, 50th and 90th percentiles (24.488, 34.961 and 48.699 staff per 100,000 adults). The nonlinear coefficient is omitted because its scale is not directly interpretable as an IRR.
Panel D reports the prespecified weighted linear fixed-effects sensitivity for the official 30-day indicator, weighted by eligible ordinary psychiatric discharges and including territorial-unit and outcome-year fixed effects. CI, confidence interval; IRR, incidence rate ratio; PA, Autonomous Province; PPML, Poisson pseudo-maximum likelihood; SDO, Hospital Discharge Records.
Primary and directly comparable prespecified sensitivity estimates for official SDO early-readmission indicators, Italy, 2015–2024. Panel A shows IRRs per +10 medical-nursing staff per 100,000 adults for the primary PPML model, directly comparable linear PPML sensitivities and the secondary 7-day outcome. Panel B shows the weighted linear fixed-effects sensitivity as a percentage-point change in the 30-day indicator per +10 staff. Points and horizontal lines denote estimates and score-inverted 95% CIs; vertical lines mark the null values of IRR 1.00 and 0 percentage points.

Figure 2 Long description
Panel A plots incidence rate ratios per 10 additional medical-nursing staff per 100,000 adults. The primary estimate is 1.006 (95% CI 0.934–1.034). Sensitivities are: excluding 2020, 1.007 (0.930–1.036); excluding 2020–2021, 1.002 (0.929–1.030); excluding 2015, 1.012 (0.954–1.052); two-year lag, 0.995 (0.937–1.039); lead/placebo timing, 1.042 (0.937–1.082); context-adjusted, 1.016 (0.955–1.055); unit-specific linear trends, 0.995 (0.955–1.035); and the secondary 7-day outcome, 1.032 (0.929–1.075). All intervals include the null IRR of 1. Panel B shows the weighted linear fixed-effects sensitivity: + 0.215 percentage points in the 30-day indicator per 10 additional staff, with 95% CI − 1.159 to + 0.704, crossing the null of 0.
Descriptive post-SAP checks showed a raw exposure SD of 9.64 and a 2-way fixed-effects residual SD of 4.33 per 100,000 adults (SD ratio 0.45; residual variance share 20.2%). The median within-unit range was 11.33 (IQR 7.34–14.88). The conditional minimum detectable-effect endpoints were IRRs of 0.944 and 1.059. Observed and fitted total readmissions were both 125,189; leverage was highest for REG_12 in 2018 (0.501), a unit-year covered by the influence re-estimates. These checks did not alter the model (Supplementary Table S3).
The prespecified PPML sensitivity analyses yielded estimates close to the confirmatory result; the p-values reported below are restricted wild score p-values (Table 2; Figure 2). Excluding outcome year 2020 yielded an IRR of 1.007 (score-inverted 95% CI 0.930–1.036; p = 0.8180), while excluding outcome years 2020–2021 yielded an IRR of 1.002 (0.929–1.030; p = 0.9184). Excluding 2015 gave an IRR of 1.012 (0.954–1.052; p = 0.5059). With a 2-year workforce lag, the IRR was 0.995 (0.937–1.039; p = 0.7250). In the lead/placebo timing assessment, the IRR was 1.042 (0.937–1.082; p = 0.4682). The context-adjusted lagged sensitivity gave an IRR of 1.016 (0.955–1.055; p = 0.4024), and the unit-specific linear-trends sensitivity gave an IRR of 0.995 (0.955–1.035; p = 0.5388). All score-inverted confidence intervals for these prespecified 30-day sensitivity analyses included the null value of 1.00.
For the secondary 7-day outcome, the IRR per 10 additional medical-nursing staff per 100,000 adults was 1.032 (score-inverted 95% CI 0.929–1.075; restricted wild score p = 0.6743). The alternate weighted linear fixed-effects model estimated +0.215 percentage points in the 30-day indicator per 10 additional staff (score-inverted 95% CI −1.159 to +0.704; p = 0.7203) (Table 2; Figure 2).
Across the 21 leave-one-Region/PA-out re-estimates, IRRs ranged from 0.974 to 1.015 (restricted wild score p = 0.4867–0.9957); across the 10 leave-one-outcome-year-out re-estimates, they ranged from 0.978 to 1.044 (p = 0.3273–0.9912). Every score-inverted confidence interval included 1. The restricted cubic-spline nonlinearity test gave p = 0.8572 (Table 2).
In the secondary profession-specific family, IRRs per 10 additional staff per 100,000 adults were 1.062 for physicians (score-inverted 95% CI 0.859–1.161; p = 0.5501; Holm-adjusted p = 1.0000), 0.994 for nurses (0.901–1.044; p = 0.8318; Holm-adjusted p = 1.0000) and 1.263 for psychiatrists (0.901–1.582; p = 0.2510; Holm-adjusted p = 0.7530). On the 191-observation common sample, the medical-nursing, physician, nurse and psychiatrist IRRs were 1.005, 1.059, 0.991 and 1.263, respectively. These verification results were not independent confirmatory findings (Supplementary Table S1).
Discussion
This study did not provide evidence of a detectable longitudinal ecological association between lagged medical-nursing headcount density and the official provider-side 30-day indicator. The score-inverted 95% interval was compatible with relative changes from a 6.6% reduction to a 3.4% increase per 10 additional staff per 100,000 adults. It therefore narrows the range of compatible ecological associations but does not exclude a potentially relevant reduction. The conditional minimum detectable-effect endpoints (IRR 0.944 or 1.059) were post-SAP precision diagnostics, not independently anchored thresholds of substantive importance. Prespecified sensitivities and 31 influence re-estimates supported the same interpretation. Residual exposure variation after both fixed effects showed that estimation was not solely between territories. Taken together, the results challenge headcount density as a stand-alone proxy for effective service capacity, not the importance of workforce within the wider clinical and organisational system that shapes post-discharge care (Supplementary Table S3).
Early psychiatric readmission is shaped by discharge organisation, follow-up, medication continuity, information transfer, social support, crisis response and inpatient–community coordination. Transitional interventions are therefore complex arrangements, not isolated staffing inputs (Vigod et al., Reference Vigod, Kurdyak, Dennis, Leszcz, Taylor, Blumberger and Seitz2013), and Italian evidence identifies pre- and post-discharge factors beyond structural supply (Donisi et al., Reference Donisi, Tedeschi, Salazzari and Amaddeo2016). Full-time-equivalent staffing would improve on headcount by accounting for contracted working time and part-time roles. It would nevertheless remain a structural measure: without information on vacancies, deployment across settings and shifts, skill mix, workload, staff continuity and the quality or content of delivered care, full-time equivalents alone may still have limited ability to predict readmission. Even a large headcount or full-time-equivalent workforce may therefore coexist with fragmented transitions; neither measure is interchangeable with continuity of care.
Psychiatric hospital use is likewise multidimensional. Admissions and readmissions reflect structural resources together with epidemiological change, diagnostic case mix, demographic composition, voluntary and compulsory pathways, clinical complexity, continuity of community care, social determinants and local organisation. Italian longitudinal evidence shows that admission profiles vary over time by diagnosis, sex, age and admission type and may shift after major contextual shocks (Barlattani et al., Reference Barlattani, Salfi, Socci, Renzi, D’Amelio, Russo, Trebbi, Rossi and Pacitti2024, Reference Barlattani, Salfi, Socci, Renzi, Bologna, Tamanti, Trebbi, Rossi, Romano and Pacitti2026). Although those studies examined admissions rather than the provider-side readmission indicator, they reinforce that administrative hospital-use measures are embedded in epidemiological and organisational context rather than isolated measures of performance.
The measurement challenge is not specific to Italy, but international evidence must be compared at the level at which exposure and outcome were defined. Six-country European registry work found that apparently similar psychiatric re-hospitalisation measures required substantial harmonisation before comparison (Katschnig et al., Reference Katschnig, Straßmayr, Endel, Berger, Zauner, Kalseth, Sfetcu, Wahlbeck, Tedeschi and Šprah2019). South Korean and Japanese claims studies linked inpatient staffing measures to readmission, but their patient-level designs and service contexts differ from this regional community-workforce panel (Han et al., Reference Han, Lee, Kim, Hahm, Jang, Kim, Kim and Park2016; Okumura et al., Reference Okumura, Sugiyama, Noda and Sakata2018). US facility-level findings likewise show that structure, process and outcome measures are not interchangeable (Benjenk et al., Reference Benjenk, Shields and Chen2020), while Medicaid data link readmission to local systems beyond case mix (Busch et al., Reference Busch, Epstein, McGuire, Normand and Frank2015). Italian patient-level studies still address different levels (Donisi et al., Reference Donisi, Tedeschi, Salazzari and Amaddeo2016; Tedeschi et al., Reference Tedeschi, Donisi, Salazzari, Cresswell-Smith, Wahlbeck and Amaddeo2020). The internationally relevant point is therefore not a portable Italian effect estimate, but a common measurement problem: workforce supply, deployed care and hospital use cannot be assumed to be equivalent across jurisdictions or analytical levels.
The profession-specific analyses remained secondary: none of the three tests provided evidence after Holm adjustment, and the four common-sample estimates supported the same interpretation. The SISM sources supplied physician and psychiatrist series separately, with 19 psychiatrist blanks and 4 anomalous 2015 values; the models therefore do not support arithmetic or substantive comparisons between them. Nor do they show that one profession increased or reduced readmission. Sampling variation, time-varying organisation, local service need and reverse temporal relationships remain indistinguishable, because staffing may itself change in response to local pressures.
The findings have direct implications for monitoring and policy. Administrative indicators can identify variation, but interpretation must remain anchored to definition, denominator, window and geography. Provider-side SDO readmission should not be treated alone as a measure of territorial performance, continuity or workforce adequacy, and headcount density should not be used as a stand-alone proxy for service capacity. This is not an argument for resources instead of organisation, or vice versa. Future monitoring should integrate headcount and, where available, full-time equivalents with process indicators, post-discharge continuity, community-service organisation, patient and case-mix characteristics, and longitudinal epidemiological trends. Linking resource inputs to their deployment and to social, physical-health and local service contexts would provide a more credible basis for planning than either metric alone. These domains were not measured here and the study cannot rank their effects.
This issue has practical as well as methodological relevance. Administrative metrics may influence organisational priorities, professional expectations and retrospective judgments about clinical decisions. A national survey of Italian psychiatrists documented defensive practices and their association with professional and work-related factors (Morena et al., Reference Morena, Di Fazio, Scognamiglio, Delogu, Baldari, Cipolloni, Frati and Fineschi2023). That survey did not assess readmission indicators and cannot establish how such measures affect clinical behaviour. It nevertheless underlines the importance of using routinely reported indicators as contextualised tools for service learning and organisational improvement, rather than as decontextualised proxies for professional accountability or the quality of individual clinical decisions.
Credibility rests on complete 10-year outcome and denominator series, a source hierarchy and a panel frozen before modelling. The archived SAP, audit materials, scripts and certified outputs distinguish confirmatory, secondary and post-SAP work. Residual variation confirmed intra-territorial information after both fixed effects. Restricted wild cluster score inference addressed 21 clusters, and numerical audit verified interval inversion and the companion cluster-robust interval (Cameron et al., Reference Cameron, Gelbach and Miller2008; Cameron and Miller, Reference Cameron and Miller2015; Roodman et al., Reference Roodman, Nielsen, MacKinnon and Webb2019). Stored model checks gave no reason to alter the specification (Supplementary Table S3). Influence re-estimation and the spline diagnostic reduced concern about a single unit, year or departure from linearity; none can establish absence of an association.
Several limitations remain. The ecological provider-side design cannot identify patient mechanisms, individual risk or causal staffing effects (Morgenstern, Reference Morgenstern1995; Subramanian et al., Reference Subramanian, Jones, Kaddour and Krieger2009). Outcome counts and the discharge offset followed hospitalisation territory, whereas workforce density used resident population. Without patient residence or compatible cross-boundary flows, mobility could alter case mix and hospital–community correspondence, but its direction and magnitude could not be quantified. Conditioning on eligible discharges also excluded population-level burden and associations operating through hospital admissions and discharges; a population offset would define a different estimand. Five exposure blanks were concentrated in specific units and years; their outcomes lay within the retained range, but missingness may still have been informative. Public reports do not disclose the detailed linkage algorithm. Headcounts omit full-time equivalents, deployment, vacancies, turnover, skill mix and care content; full-time-equivalent data would reduce ambiguity from part-time employment but would still not capture actual deployment, staffing adequacy relative to need or service quality. Finally, 21 clusters and 10 years leave possible time-varying confounding and reverse relationships, while the primary interval still permits a potentially relevant inverse association. Associations through particular processes, levels or time horizons remain possible.
Within these constraints, the study tests an assumption often made more directly than aggregate data permit: that a readily counted workforce measure should map onto a readily reported hospital-use indicator. In the 2015–2024 territorial panel, the data did not provide evidence of a detectable longitudinal ecological association between the two. This does not make workforce immaterial. It shows why nominal headcount and provider-side readmission should not stand in for deployed clinical capacity, continuity of care or territorial performance. A more informative policy framework requires sufficient resources and multidimensional monitoring of how staff time, access, patient and case mix, social and economic conditions, physical healthcare and psychiatric transition processes are organised together.
Supplementary material
The supplementary material for this article can be found at https://doi.org/10.1017/S2045796026101073.
Availability of data and materials
The frozen analytic panel, data-freeze manifest, analytical scripts, certified model outputs and manuscript-table source files, Statistical Analysis Plan, outcome-definition and audit documentation, and quality-control records supporting this study are openly available in Zenodo, version 1.0 (Scognamiglio, Reference Scognamiglio2026a), at https://doi.org/10.5281/zenodo.21358419. The underlying annual reports and population statistics are publicly available from the Italian Ministry of Health and the Italian National Institute of Statistics, respectively, as cited in the manuscript; the repository documents the provenance of the specific source materials used.
Acknowledgements
The authors gratefully acknowledge psychiatrists and all staff working across Italy’s Departments of Mental Health, whose daily commitment sustains the continuity, dignity and public purpose of community mental healthcare, often under demanding circumstances. OpenAI Codex (GPT-5, accessed through ChatGPT; OpenAI, San Francisco, CA, USA; https://chatgpt.com/) was used for language editing, phrasing refinement and readability improvement. All AI-assisted wording was reviewed, revised and approved by the authors, who remain solely responsible for the manuscript’s scientific content, interpretation, accuracy and originality.
Author contributions
P.S.: Conceptualisation, Data curation, Formal analysis, Investigation, Methodology, Project administration, Software, Validation, Visualisation, Writing – original draft and Writing – review & editing. D.M.: Conceptualisation, Supervision and Writing – review & editing. V.F.: Supervision and Writing – review & editing. V.I.: Validation, Supervision and Writing – review & editing. V.M.: Conceptualisation, Supervision and Writing – review & editing. All authors reviewed and approved the final manuscript.
Financial support
This research received no specific grant from any funding agency, commercial or not-for-profit sectors.
Competing interests
None.
Ethical standards
This study analysed publicly available, aggregated Region/Autonomous Province-year data derived from national administrative and statistical sources. No individual-level data were accessed, linked, or analysed, and no participants were recruited, contacted, or intervened upon. Accordingly, the study did not involve human participant research procedures or animal experimentation, and informed consent was not applicable.



 Open access

