I. Introduction
There is an ongoing debate over whether shareholder engagement (voice) or stock divestment—defined as underweighting or exiting a stock—is effective in influencing firms’ environmental policies and making them greener. Although most existing evidence supports the engagement channel, research on the divestment channel remains limited.Footnote 1 Recently, Berk and van Binsbergen (Reference Berk and van Binsbergen2025) (BB hereafter) find that divestment does not affect firms’ cost of equity and, therefore, cannot compel firms to become greener. In contrast, Zerbib (Reference Zerbib2022), Pástor, Stambaugh, and Taylor (Reference Pástor, Stambaugh and Taylor2024), and Cheng, Jondeau, Mojon, and Vayanos (Reference Cheng, Jondeau, Mojon and Vayanos2025) show that the BB results are sensitive to the model specification and parameter values. Similarly, Atta-Darkua, Glossner, Krueger, and Matos (Reference Atta-Darkua, Glossner, Krueger and Matos2023) find that divestment affects firms’ cost of equity when calibrating the BB model to a different data set, yet it still does not induce greener behavior. Given this important and unsettled debate, we revisit the effects of divestment using a microfounded, demand-based asset pricing framework with heterogeneous investors. This approach explicitly links investor portfolio rebalancing to stock price movements, providing a more nuanced view of how different types of investors affect the market. Our framework differs from BB, who apply a CAPM setting with homogeneous investors (mutual funds) and do not incorporate these microeconomic mechanisms.
We address four central and interrelated open questions. Does institutional portfolio rebalancing triggered by firm-level climate change exposures affect firms’ cost of equity? If so, does it affect firms’ future environmental profiles? Are physical or transition exposures more important for these effects? Which types of institutional investors drive them? We revisit these questions through the lens of climate change price pressure (CCPP)—stock price pressure arising from institutional portfolio rebalancing in response to firm-level climate change exposures. To our knowledge, this is the first study to analyze these questions within a unified framework, placing CCPP at the core of the analysis. Our study adopts a broader perspective than Noh, Oh, and Song (Reference Noh, Oh and Song2023), who examine the effects of CCPP on firms’ future environmental profiles. Since any impact of CCPP on firms’ cost of equity constitutes a channel for potential real economic effects, understanding this relationship is critical.
We derive a closed form expression for the stock-specific CCPP within the Koijen and Yogo (Reference Koijen and Yogo2019) demand-based asset pricing framework, which is a natural choice for our analysis for two reasons. First, in equilibrium, each investor’s optimal portfolio weight depends on stock characteristics that affect expected returns and risks. By incorporating firm-level climate change exposures as a stock characteristic, we derive a formula for CCPP that measures, at a given point in time, the percentage change in the equilibrium stock price resulting from a one-standard-deviation change in climate change exposures, holding all else constant. Second, the model accounts for heterogeneous investor responses to climate change exposures, as investors may perceive their effects on expected returns and risks differently.Footnote 2
The CCPP formula holds in equilibrium and, therefore, incorporates the heterogeneous characteristics of all investors, including the sensitivities of their portfolio weights to changes in climate change exposures, stock ownership, and demand elasticities. CCPP exhibits two key properties. First, its magnitude is larger (smaller) for stocks held by investors with lower (higher) demand elasticity. Second, CCPP is negative (positive) when most investors underweight (overweight) a stock in response to an increase in climate change exposures.
We estimate alternative stock-specific CCPP measures stemming from physical and transition climate exposures, motivated by prior evidence on the heterogeneous effects of different types of climate change risks on stock prices (Faccini, Matin, and Skiadopoulos (Reference Faccini, Matin and Skiadopoulos2023), Sautner, van Lent, Vilkov, and Zhang (Reference Sautner, van Lent, Vilkov and Zhang2023b)). We proxy firm-level climate change exposures using the four textual measures of Sautner, van Lent, Vilkov, and Zhang (Reference Sautner, van Lent, Vilkov and Zhang2023a)—total, physical, opportunity, and regulatory—extracted from firms’ earnings conference calls, from which we derive four corresponding CCPP measures. We estimate each CCPP measure quarterly for each S&P 500 constituent stock from 2005:Q1 to 2021:Q4, using Thomson Reuters Institutional (13F) portfolio holdings of U.S. stocks. The pooled average CCPP is negative. For example, an increase of one standard deviation in total climate change exposures decreases the average stock’s price by 7.9%.
Next, we use panel regressions to examine the effect of each CCPP measure on the corresponding firm’s cost of equity over alternative horizons. These regressions test whether stocks that are riskier—because their prices are more sensitive to increases in climate change exposures and the resulting decline in climate-triggered institutional demand (i.e., stocks with more negative CCPP)—offer higher expected returns. Instead of relying on realized returns, we estimate firms’ cost of equity using the option based measures of expected excess returns proposed by Martin and Wagner (Reference Martin and Wagner2019) and Chabi-Yo, Dim, and Vilkov (Reference Chabi-Yo, Dim and Vilkov2023). These are real-time, forward-looking, and market-based measures. As such, they circumvent the limitation that inferences about expected returns based on realized returns may lack informativeness, provide timely updates to the cost of equity, and avoid the noise present in accounting based alternatives (Kim (Reference Kim2022), Pástor, Stambaugh, and Taylor (Reference Pástor, Stambaugh and Taylor2022)).Footnote 3
We document that CCPP has a negative and statistically significant effect on firms’ cost of equity, confirming the testable prediction regarding the relation between CCPP and expected returns. Firms’ cost of equity rises as their stock CCPP becomes more negative in almost all cases, regardless of the option implied measure or the type of climate change exposure driving CCPP. For example, a one-standard-deviation decrease in CCPP stemming from total climate change exposures raises the option implied Martin and Wagner (Reference Martin and Wagner2019) cost of equity by 3% of the average monthly cost of equity. These effects prevail across different horizons, with the strongest impact observed one quarter ahead—by up to 6% of the respective average costs of equity for CCPP arising from opportunity exposures. At the aggregate level, banks and insurance companies are the largest contributors to CCPP, with banks responding primarily to opportunity and regulatory exposures, and insurance companies to physical exposures, through portfolio adjustments. Principles for Responsible Investment (PRI) signatories contribute more to CCPP than nonsignatories. In line with the Koijen and Yogo (Reference Koijen and Yogo2019) model, we find that individual investors respond heterogeneously to increases in climate change exposures, with some underweighting and others overweighting their stock positions, thereby taking the opposite side of the trade.
Next, we use panel regressions to examine whether CCPP affects firms’ future environmental profiles, proxied by green patents, environmental expenditures, environmental provisions, self-reported environmental fines, and carbon emission intensities. Firms can improve their future environmental profiles to mitigate the effect of CCPP on their cost of equity only if the benefits outweigh the costs of such reforms (Heinkel, Kraus, and Zechner (Reference Heinkel, Kraus and Zechner2001), Edmans et al. (Reference Edmans, Levit and Schneemeier2023)). We find that CCPP does not significantly affect firms’ future environmental profiles, and this insignificance persists even over longer horizons. Additional robustness tests—including alternative measures of firms’ future environmental profiles, price pressure from market-wide climate change risks, and differential effects of CCPP on brown versus green firms—confirm these findings. These results suggest that, although CCPP has a statistically significant effect on firms’ cost of equity, it does not affect their environmental corporate decision making. This finding aligns with Edmans, Gosling, and Jenter (Reference Edmans, Gosling and Jenter2025), who argue that even a 50-basis-point change in the cost of equity is relatively small. Our conclusion echoes that of Atta-Darkua et al. (Reference Atta-Darkua, Glossner, Krueger and Matos2023) and BB: Divestment at current levels is insufficient to induce firms to alter their environmental profiles. Assessing how large CCPP must be to influence environmental outcomes is nontrivial, as it requires weighing the benefits of mitigating a higher cost of equity against the costs of reforms. These reforms may involve tangible assets (e.g., changes in production processes) and intangible ones (e.g., corporate culture, organizational structures, and labor relations), with the intangible costs being particularly difficult to quantify. From a social welfare perspective, achieving the social optimum requires that the CCPP raises a firm’s cost of equity in proportion to its carbon emission intensities (Pedersen (Reference Pedersen2025)). Yet even in this case, corporate reforms will occur only if the benefits of adjustment exceed the associated costs.
Related Literature and Contributions
Our article contributes to the empirical literature on whether firms’ cost of equity and future environmental profiles are affected by institutional investors’ portfolio rebalancing in response to climate change risks. Berg, Heeb, and Kölbel (Reference Berg, Heeb and Kölbel2022), Gantchev, Giannetti, and Li (Reference Gantchev, Giannetti and Li2022), Noh et al. (Reference Noh, Oh and Song2023), and Choi, Gao, Jiang, and Zhang (Reference Choi, Gao, Jiang and Zhang2024) find that divestment by sustainable institutional investors lowers stock prices—interpreted as evidence of an increased cost of equity, and van der Beck (Reference van der Beck2023) reports that capital flows into ESG funds are positively correlated with future realized returns of ESG stocks.
However, BB find no effect of divestment by mutual funds. In contrast, Pástor et al. (Reference Pástor, Stambaugh and Taylor2024) show that BB’s results are sensitive to the assumed parameter values and should not be generalized. Consistent with this, Atta-Darkua et al. (Reference Atta-Darkua, Glossner, Krueger and Matos2023) find that divestment affects the cost of equity after recalibrating BB’s model using a different data set. Moreover, Zerbib (Reference Zerbib2022) reports that divestment from sin stocks can raise their cost of equity by up to 10% relative to nonsin stocks. Cheng et al. (Reference Cheng, Jondeau, Mojon and Vayanos2025) show that divestment may increase the cost of capital of the brownest firms by up to 136 basis points. Similarly, the evidence on whether a negative CCPP improves firms’ future environmental profiles is mixed. Some studies find that explicit (model-based, Noh et al. (Reference Noh, Oh and Song2023)) or implicit CCPP measures affect firms’ future emissions and E&S scores.Footnote 4 However, other studies report no such effects (Berg et al. (Reference Berg, Heeb and Kölbel2022), Atta-Darkua et al. (Reference Atta-Darkua, Glossner, Krueger and Matos2023), and Heath, Macciocchi, Michaely, and Ringgenberg (Reference Heath, Macciocchi, Michaely and Ringgenberg2023)).
Our main contribution to the literature is threefold. First, we directly examine how climate-triggered institutional portfolio rebalancing affects firms’ cost of equity and environmental profiles. We use a closed form, theoretically grounded stock-level CCPP measure that captures both investors’ heterogeneous rebalancing activities and their stock ownership structures. Second, our cost-of-equity measure is forward-looking, unlike realized return measures, which may provide limited information about expected returns. Third, by analyzing the effects of CCPP on both firms’ cost of equity and environmental profiles within a unified framework, we provide an economic metric to assess whether CCPP can promote climate adaptation.
Noh et al. (Reference Noh, Oh and Song2023) and Sautner et al. (Reference Sautner, van Lent, Vilkov and Zhang2023b) are the studies most closely related to ours. Noh et al. (Reference Noh, Oh and Song2023) calculates CCPP within the Koijen and Yogo (Reference Koijen and Yogo2019) framework using climate change risks measured by “hard” information, such as E scores, carbon emissions, and green patents. They find that investor pressure for sustainability predicts firms’ future environmental performance, though the effect is small. We take a step back and focus on the impact of CCPP on the cost of equity, a channel through which CCPP may influence a firm’s future environmental profile. Moreover, we calculate CCPP using “soft” information derived from exchanges between managers and analysts on climate change exposures. These data capture insights beyond firm-level exposure measures based on “hard” information and allow us to distinguish between different dimensions of climate change risk. Sautner et al. (Reference Sautner, van Lent, Vilkov and Zhang2023b) find that climate change exposures are priced in the cross-section of S&P 500 stock returns, using the same textual factors and option based measures of expected returns employed in our analysis. We complement their study by proposing CCPP as an alternative economic channel for these findings.
II. Theoretical Model
We review the Koijen and Yogo (Reference Koijen and Yogo2019) demand-based asset pricing setting and extend it by including firm-level climate change exposures. We derive the model-based, stock-level CCPP and discuss its properties and estimation.
A. Characteristics-Based Portfolio Weights
Consider an economy with
$ I $
 investors, indexed by
$ i $
 =1, …,
$ I $
 and
$ N $
 assets indexed by
$ n $
 =1, …,
$ N $
 . Each investor is endowed with wealth
$ {A}_{i,t} $
 at
$ t $
 . One of the investors is the household, assumed to hold the remaining shares of each stock not held by institutional investors at
$ t $
 . At
$ t $
 , the investor
$ i $
 allocates her wealth across the assets in her investment universe set,
$ {\mathcal{N}}_{i,t}\subseteq \left\{1,\dots, N\right\} $
 , and an outside asset, indexed by
$ n=0 $
 . We identify outside assets applying the criteria in Koijen and Yogo (Reference Koijen and Yogo2019) who show that in market equilibrium, the optimal portfolio weight of the investor
$ i $
 in the
$ n $
 th stock at
$ t $
 is given by:

where
$ {me}_t(n) $
 denotes the log market equity,
$ {\mathbf{x}}_t(n) $
 is the vector of other stock characteristics, including the log book equity, market beta, profitability, investment, and dividend-to-book equity, and the error term captures investor
$ i $
 ’s demand for unobserved characteristics of asset
$ n $
 (latent demand).
Given that firm-level climate change exposures are informative about expected returns and risks (Sautner et al. (Reference Sautner, van Lent, Vilkov and Zhang2023b)), we extend the set of characteristics in equation (1) by adding firm-level climate change exposures,

where
$ {cc}_t(n) $
 denotes the climate change exposures of stock
$ n $
 at
$ t $
 .
$ {\beta}_{1,i,t} $
 captures how investor
$ i $
 rebalances her portfolios with respect to firm-level climate change exposure and
$ {\beta}_{0,i,t} $
 negatively relates to the demand elasticity of the number of shares held by investor
$ i $
 with respect to the stock price (Koijen and Yogo (Reference Koijen and Yogo2019)).
$ {\beta}_{1,i,t} $
 varies across investors because of their different views on the assumed association of expected returns and risks with stock characteristics. An investor would overweight (underweight) a stock, if an increase in firms’ climate change exposures is perceived to be positively (negatively) related to expected returns or negatively (positively) related to risks.Footnote
5
B. Stock-Level Pressure: The Model-Based Measure
The stock-level CCPP captures how institutional portfolio rebalancing triggered by firms’ climate change exposures affects equilibrium stock prices, assuming ceteris paribus. To fix ideas, stock
$ n $
 ’s
$ {CCPP}_t(n) $
 computed at
$ t $
 is the partial derivative of the equilibrium log stock price
$ {p}_t(n) $
 of firm
$ n $
 with respect to a change of one standard deviation in its climate change exposures from one state of the world to another (we cross-sectionally standardize the climate change exposures)

where
$ {p}_t(n)=\log \left({P}_t(n)\right) $
 , and
$ {s}_{i,t}(n)={A}_{i,t}{w}_{i,t}(n)/{\sum}_{i=1}^I{A}_{i,t}{w}_{i,t}(n) $
 is the proportion of the total market capitalization held by investor
$ i $
 for stock
$ n $
 at
$ t $
 (i.e., investor
$ i $
 ’s ownership of stock
$ n $
 at
$ t $
 ). Appendix A provides the proof of equation (3).
Equation (3) is a comparative static and holds in market equilibrium, hence, it takes into account the heterogeneous actions of all investors. It shows that the CCPP of stock
$ n $
 equals the ownership-weighted sum of the coefficients
$ {\beta}_{1,i,t} $
 divided by 1 minus the ownership-weighted sum of the coefficients
$ {\beta}_{0,i,t} $
 . The denominator in equation (3) is the aggregate demand elasticity of the total number of shares held by all investors with respect to the stock price (Koijen and Yogo (Reference Koijen and Yogo2019)). Therefore, CCPP is determined by two effects. First, investors adjust their portfolio weights in response to changes in firm-level climate change exposures, an effect captured by
$ {\beta}_{1,i,t} $
 . Second, this shift in demand induces a stock price response, governed by
$ {\beta}_{0,i,t} $
 . The higher (lower) the investor’s demand elasticity, the smaller (larger) the stock price change for a given change in demand.
Hence, CCPP has two properties. First, its magnitude is larger for stocks held by investors with a lower demand elasticity, consistent with Broccardo et al. (Reference Broccardo, Hart and Zingales2022), Gantchev et al. (Reference Gantchev, Giannetti and Li2022), and van der Beck (Reference van der Beck2023). Second, CCPP can take positive or negative values, depending on the sign of the numerator in equation (3). The denominator is strictly positive under the restriction
$ {\beta}_{0,i,t}<1 $
 , which ensures a unique market-clearing equilibrium (Koijen and Yogo (Reference Koijen and Yogo2019)). If most investors underweight (overweight) stock
$ n $
 in response to higher climate exposures (i.e., when
$ {\beta}_{1,i,t} $
 is negative (positive)) the stock experiences a negative (positive) CCPP.
To estimate CCPP, we estimate equation (2) for each investor at any
$ t $
 by applying the generalized method of moments to her cross-sectional stock holdings. To address the endogeneity issue that arises from the correlation between the stock’s market equity and latent demand, we construct, for each
$ t $
 , the Koijen and Yogo (Reference Koijen and Yogo2019) stock- and investor-specific instrument,
$ {\hat{me}}_{i,t}(n) $
 , namely the log market equity of stock
$ n $
 as if all other investors (excluding
$ i $
 ) held equal-weighted portfolios within their investment universe.
III. Data and Variables
A. Institutional Stock Holdings
We obtain quarterly data on U.S. exchange-traded stock holdings of institutional investors from the Thomson Reuters Institutional (13F) Holdings database (s34) via Wharton Research Data Services (WRDS) from 2005:Q1 to 2021:Q4. About 91% of the 13F filers are U.S. investors. Among foreign filers, most are from Canada and the United Kingdom. We follow the investor classifications in Koijen and Yogo (Reference Koijen and Yogo2019): banks, insurance companies, investment advisors (including brokerage firms and hedge funds), mutual funds, pension funds, other institutional investors (including university endowments and foundations), and “households.” In total, there are 10,420 (9,215) different 13F investors (once small investors are grouped as “households”).
B. Firms’ Climate Change Exposures
We proxy firm-level total, opportunity, regulatory, and physical climate change exposures using the respective textual measures of Sautner et al. (Reference Sautner, van Lent, Vilkov and Zhang2023a), extracted from quarterly earnings conference call transcripts. The data are available on the authors’ website (https://osf.io/fd6jq/). Opportunity exposures arise from the transition from polluting to green technologies. Regulatory exposures capture costs associated with climate policies or regulatory changes. Physical exposures reflect the adverse effects of physical climate events. Each measure captures the share of manager–analyst conversations on the respective climate change topics during the firm’s earnings conference call, with higher (lower) values indicating more (less) attention to that topic. We follow Sautner et al. (Reference Sautner, van Lent, Vilkov and Zhang2023b) to process the data (see Supplementary Appendix IA.1), and employ their total and topic-based climate change exposures data for 2005:Q1–2021:Q4 and 2008:Q1–2021:Q4, respectively.
C. Option Implied Firm-Level Cost of Equity
We estimate the cost of equity (risk premium) for S&P 500 constituent firms using two alternative option implied measures: Martin and Wagner (Reference Martin and Wagner2019) (MW) and Chabi-Yo et al. (Reference Chabi-Yo, Dim and Vilkov2023) (GLB), across multiple horizons (1 month, 1 quarter, 2 quarters, 3 quarters, and 1 year). Supplementary Appendix IB describes how we calculate the MW measure using daily implied volatility data from S&P 500 constituent stock options and S&P 500 index options, obtained from the Volatility Surface in the IvyDB U.S. OptionMetrics database. GLB data are obtained from the authors’ website (https://osf.io/7xcqw/).
D. Firms’ Green Activities and Carbon Emissions
We extract each firm’s annual patents from the Kogan, Papanikolaou, Seru, and Stoffman (Reference Kogan, Papanikolaou, Seru and Stoffman2017) Google patent database and identify green patents using the updated 2022 version of the Haščič and Migotto (Reference Haščič and Migotto2015) OECD classification system (data are available at https://github.com/KPSS2017 and https://data-explorer.oecd.org). If a patent’s Cooperative Patent Classification (CPC) code matches any code in the OECD-CPC list, we classify the patent as green. Based on the identified green patents, we construct three firm-year variables: i) the number of green patents, ii) the ratio of green patents scaled by the log of firm market value, and iii) the economic value of green patents, following prior literature (e.g., Cohen et al. (Reference Cohen, Gurun and Nguyen2020), Sautner et al. (Reference Sautner, van Lent, Vilkov and Zhang2023a)). We obtain annual firm-level data from Refinitiv on green expenditures, environmental provisions, and self-reported environmental fines, scaling each variable by total assets and treating missing values as zeros. We obtain annual data on firms’ carbon intensities (Scopes 1 and 2) from Trucost. We lag the carbon intensity data by 1 year when merging it with stock characteristics via CUSIP identifiers, due to the 1-year delay in reporting carbon emissions. Appendix B describes the green variables.
E. Stock Data and Characteristics
We obtain monthly data on stock prices, returns, dividends, and shares outstanding for U.S. common stocks trading on the NYSE, AMEX, and NASDAQ from the CRSP Monthly Stock Database. Accounting data are obtained from the Compustat North America Fundamentals Quarterly and Annual Databases. To merge CRSP with Compustat data, we lag Compustat observations by 6 to 18 months to ensure that accounting information is available as of the trading date. Appendix B provides definitions of the stock characteristic variables. We keep quarter-end observations to merge firm-level climate change exposure data with stock characteristics data using GVKEY identifiers. We merge option data with stock characteristics via the WRDS Option Metrics CRSP Link Table. We match institutional stock holdings with stock characteristics data via the CUSIP identifiers. Following Koijen and Yogo (Reference Koijen and Yogo2019), each quarter we winsorize each stock characteristic, including climate change exposures, but excluding log market equity and log book equity, at the 2.5th and 97.5th percentiles of the respective stocks’ cross-sectional distributions.
IV. Empirical Analysis
A. Stock-Level CCPP: Estimation
For each quarter, we estimate the stock-level CCPP (equation (3)) for each S&P 500 constituent stock. We estimate equation (2) separately for the total and three topic-based climate change exposures using the full sample of U.S. common stocks. The estimation is done by quarter and by investor to obtain the investor-specific, time-varying coefficients
$ {\beta}_{1,i,t} $
 and
$ {\beta}_{0,i,t} $
 , with an average of 3,356 investors per quarter.Footnote
6 Table 1 reports the pooled summary statistics for the estimated stock-level CCPP of S&P 500 constituent stocks, arising from total and topic-based climate change exposures.

Table 1 Long description
Panel A at the top presents firm-level climate change exposures. Variables listed vertically are TOTAL, OPP, REG, and PHY, each scaled by ten to the third power. For each, the columns from left to right show mean, standard deviation, minimum, median, maximum, and number of observations. TOTAL has a mean of 0.318, standard deviation 0.611, minimum 0.001, median 0.108, maximum 4.751, and 43,707 observations. OPP has mean 0.092, standard deviation 0.242, minimum 0.000, median 0.015, maximum 2.214, and 35,939 observations. REG has mean 0.016, standard deviation 0.049, minimum 0.000, median 0.000, maximum 0.516, and 35,939 observations. PHY has mean 0.003, standard deviation 0.008, minimum 0.000, median 0.000, maximum 0.052, and 35,939 observations. Panel B in the middle shows option implied firm-level cost of equity. Variables are MW30, MW91, MW182, MW273, MW365, GLB30, GLB91, GLB182, GLB273, and GLB365. For MW30, mean is 0.073, standard deviation 0.097, minimum negative 0.005, median 0.044, maximum 1.123, and 43,707 observations. MW91 has mean 0.066, standard deviation 0.082, minimum negative 0.002, median 0.041, maximum 0.969, and 43,703 observations. MW182 has mean 0.064, standard deviation 0.073, minimum 0.001, median 0.042, maximum 0.859, and 43,691 observations. MW273 has mean 0.069, standard deviation 0.076, minimum 0.003, median 0.046, maximum 0.797, and 29,655 observations. MW365 has mean 0.067, standard deviation 0.070, minimum 0.005, median 0.046, maximum 0.709, and 28,855 observations. GLB30 has mean 0.100, standard deviation 0.110, minimum 0.003, median 0.064, maximum 1.073, and 43,707 observations. GLB91 has mean 0.085, standard deviation 0.092, minimum 0.002, median 0.056, maximum 0.894, and 43,703 observations. GLB182 has mean 0.080, standard deviation 0.082, minimum 0.002, median 0.053, maximum 0.764, and 43,691 observations. GLB273 has mean 0.081, standard deviation 0.081, minimum 0.003, median 0.053, maximum 0.673, and 29,655 observations. GLB365 has mean 0.078, standard deviation 0.075, minimum 0.003, median 0.054, maximum 0.618, and 28,855 observations. Panel C at the bottom presents firm-level C C P P estimates. Variables are C C P P underscore TOTAL, C C P P underscore OPP, C C P P underscore REG, and C C P P underscore PHY. C C P P underscore TOTAL has mean negative 0.079, standard deviation 0.082, minimum negative 0.392, median negative 0.072, maximum 0.158, and 39,967 observations. C C P P underscore OPP has mean negative 0.070, standard deviation 0.063, minimum negative 0.320, median negative 0.070, maximum 0.158, and 32,651 observations. C C P P underscore REG has mean negative 0.060, standard deviation 0.062, minimum negative 0.364, median negative 0.057, maximum 0.094, and 32,651 observations. C C P P underscore PHY has mean negative 0.027, standard deviation 0.041, minimum negative 0.180, median negative 0.027, maximum 0.091, and 32,651 observations. All values are reported before cross-sectional standardization.
CCPP exhibits substantial heterogeneity across climate change exposure measures, stocks, and quarters. The variation is largest for total CCPP and smallest for physical CCPP. Consistent with the CCPP properties discussed in Section II.B, CCPP takes both positive and negative values, with the vast majority being negative. For instance, unreported summary statistics indicate that only 15% of CCPP observations are positive for total climate change exposures. A one-standard-deviation increase in total exposures can lower (raise) stock prices by up to 39% (16%). Although extreme values may appear large—since they correspond to a one-standard-deviation change in climate exposures—average CCPP values are substantially smaller.
An increase of one standard deviation in total (or physical) climate change exposures lowers the average stock price by 7.9% (or 2.7%). The average magnitude of CCPP is comparable to that of the sustainability price pressure measure in Noh et al. (Reference Noh, Oh and Song2023) (their Table A4), which is based on hard sustainability information over 2013–2021. The size of CCPP is consistent with an inelastic stock market. For each stock-quarter observation, we estimate the elasticity of aggregate demand using investor-specific coefficients on log market equity from equation (2) and individual investor ownership. The pooled average elasticity for 2005–2021 is 0.29, close to the pooled estimates in Koijen and Yogo (Reference Koijen and Yogo2019) (0.3) and Gabaix and Koijen (Reference Gabaix and Koijen2022) (0.2).
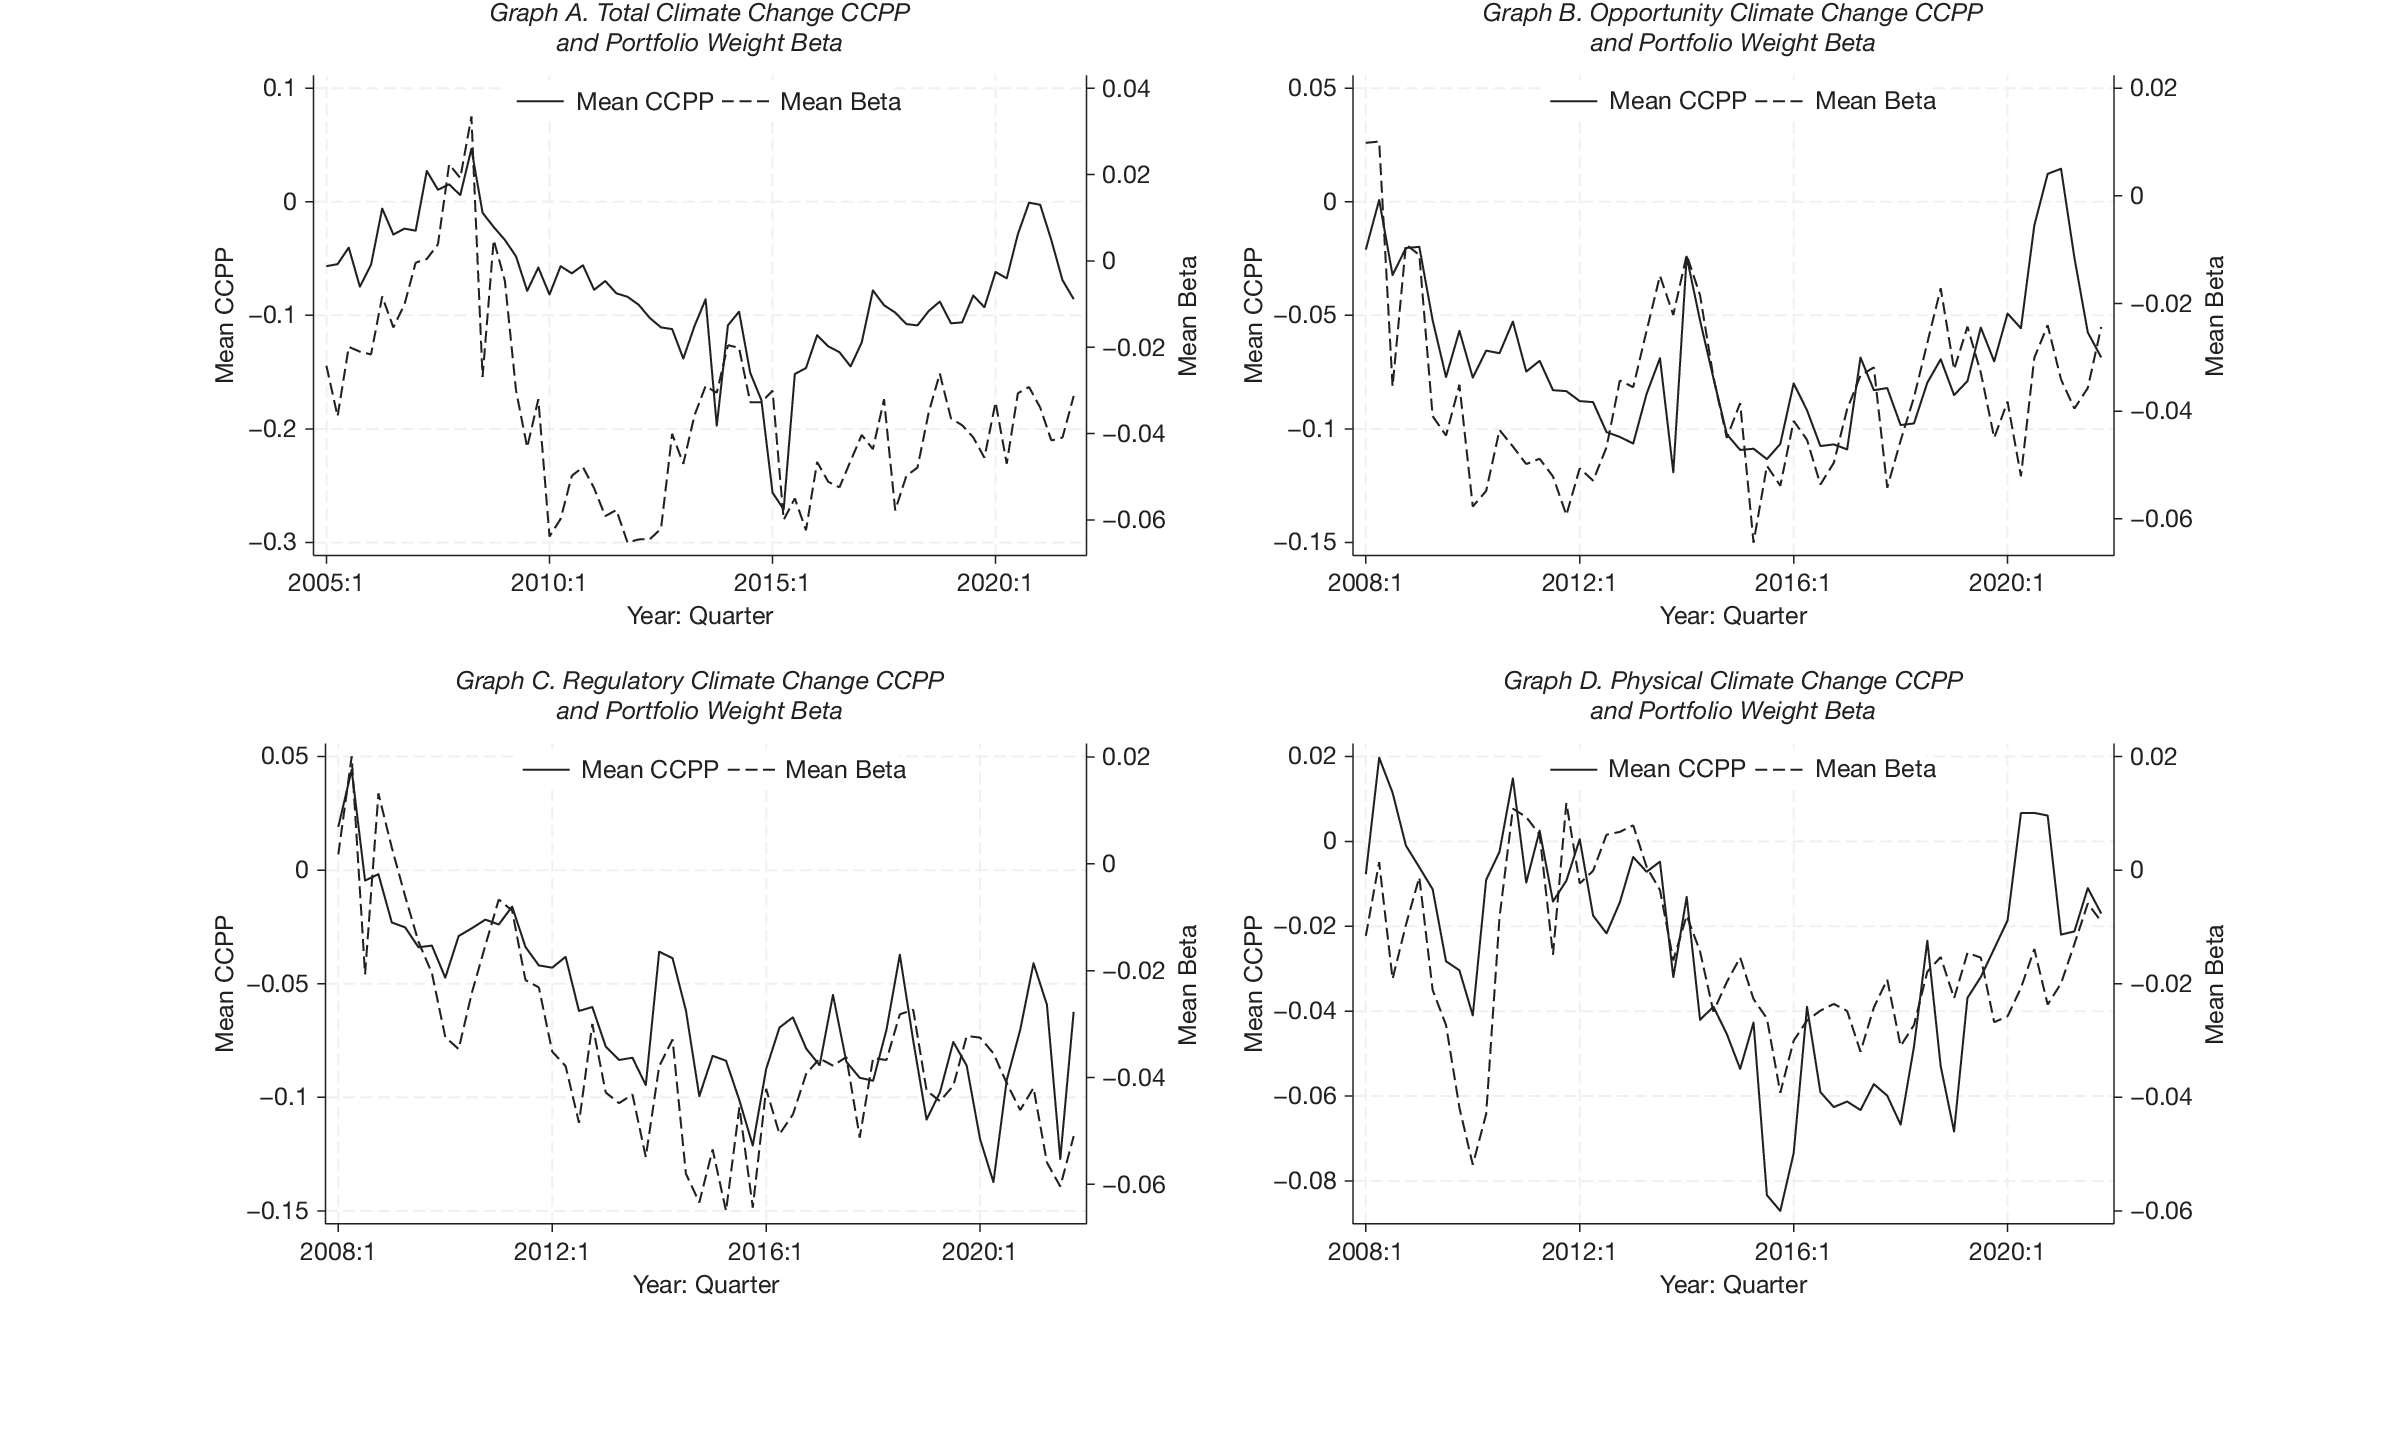
Graphs A–D (left axis) of Figure 1 plot the cross-sectional average CCPP of S&P 500 constituent stocks over time, arising from total, opportunity, regulatory, and physical exposures, respectively. CCPP is negative for most of the period, regardless of exposure type. Notably, there is a downward trend from 2008 to 2016, which reverses after 2016.
Graphs A–D (left axis) of Figure 1 plot the cross-sectional average CCPP of S&P 500 constituent stocks (before cross-sectional standardization), arising from investors’ portfolio rebalancing triggered by changes in stocks’ total, opportunity, regulatory, and physical climate change exposures, respectively. CCPP is calculated by equation (3). The right axis plots the time-series evolution of the sensitivity of the relative portfolio weights with respect to these exposures, respectively (i.e., the cross-sectional average of individual investors’ coefficients
$ {\beta}_{1,i,t} $
 ), estimated from equation (2). For CCPP stemming from total (topic-based) climate change exposures, the sample period spans 2005:1–2021:4 (2008:1–2021:4), as dictated by the availability of climate change exposure data discussed in Sautner et al. (Reference Sautner, van Lent, Vilkov and Zhang2023b).

Figure 1 Long description
Top left panel (A) shows total climate change C C P P and portfolio weight Beta from 2005 to 2021. The solid line (mean C C P P) rises to a peak near 2009, then fluctuates, ending higher in 2021. The dashed line (mean Beta) trends downward, with troughs around 2009 and 2020. Top right panel (B) displays opportunity climate change C C P P and Beta from 2008 to 2021. Both lines fluctuate, with mean C C P P peaking around 2021 and mean Beta remaining mostly negative. Bottom left panel (C) presents regulatory climate change C C P P and Beta from 2008 to 2021. Both lines start high, decline sharply, then oscillate with smaller peaks and troughs. Bottom right panel (D) shows physical climate change C C P P and Beta from 2008 to 2021. Mean C C P P and mean Beta both show a general upward trend after 2016, with mean Beta remaining negative but rising toward zero by 2021. All panels use solid lines for mean C C P P and dashed lines for mean Beta. Y-axes are labeled mean C C P P (left) and mean Beta (right). X-axes are labeled year and quarter.
The sign and pattern of the average CCPP can be explained by investors’ portfolio rebalancing activities, consistent with the theoretical properties of the CCPP formula (equation (3)). Graphs A–D (right axis) of Figure 1 plot the cross-sectional average of the estimated investor sensitivity coefficients,
$ {\beta}_{1,i,t} $
 from equation (2), capturing portfolio-weight responses to total, opportunity, regulatory, and physical exposures, respectively. Portfolio weights of the average investor respond less to changes in climate exposures over 2016–2020 compared to the pre-2016 period. The former period spans the end of Barack Obama’s second term (November 2012–November 2016) and Donald Trump’s first term (January 2017–January 2021), both signaled a relaxation in regulatory climate pressures. This may have reduced investors’ incentives to underweight stocks with high climate exposures. Given this relaxation in climate regulation, it is unsurprising that the physical CCPP exhibits a similar time-series pattern. The unreported Spearman (Pearson) correlation between physical and regulatory climate exposures is 0.26 (0.18). Firm-level physical exposures induce portfolio rebalancing when mapped to regulatory exposures. Notably, CCPP appears to intensify again in 2021, coinciding with the Biden administration’s early actions to address climate change.Footnote
7
B. Effects on Firms’ Cost of Equity
We investigate whether investor portfolio rebalancing triggered by climate change exposures affects firms’ cost of equity. To do so, we employ a stock-level CCPP channel that captures the price impact of such rebalancing. Firms with more negative CCPP are riskier: they face larger price declines from potential increases in climate exposures and the resulting reductions in institutional demand. Consequently, investors require higher expected returns as compensation for holding these stocks. We test the hypothesis of a negative relation between expected returns and CCPP by estimating contemporaneous panel regressions of firms’ option implied cost of equity on their CCPP and controls:

where
$ {COE}_{t,h}(n) $
 , is the MW or GLB option implied cost of equity for stock
$ n $
 at
$ t $
 for horizons
$ h $
 = 1 month, 1 quarter, 2 quarters, 3 quarters, and 1 year. We separately consider stock-level CCPP from total, opportunity, regulatory, and physical exposures. The vector of controls,
$ {\mathbf{X}}_t(n) $
 , includes log market equity, market beta, book-to-market ratio, profitability, investment, dividends-to-book equity, firm-level climate change exposure, momentum, and institutional ownership. We also include year-quarter (
$ {\delta}_t $
 ) and SIC2 industry (
$ {\phi}_j $
 ) fixed effects.
Our regression specification is analogous to regressions of the cost of equity on implicit measures of price pressure proxied by institutional trading—such as fund flows and trading activity variables (van der Beck (Reference van der Beck2023)) or institutional ownership (Gompers and Metrick (Reference Gompers and Metrick2001)) and references therein—commonly used in the literature. However, our approach differs in that it provides an explicit, rather than an implicit, proxy for price pressure by exploiting estimated sensitivity coefficients from a demand-based model.
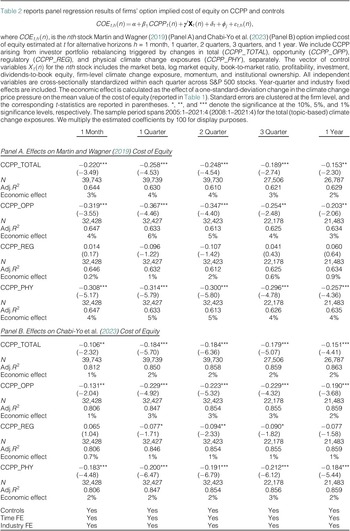
Table 2 reports the effects of stock-level CCPP on the firm-level cost of equity across horizons ranging from 1 month to 1 year. The results support our hypothesis: the CCPP coefficient is negative and statistically significant after accounting for controls. The findings hold across horizons and for all types of climate change exposures, though the evidence is weaker for regulatory CCPP. This implies that on average, a firm’s cost of equity rises when its CCPP declines (i.e., when CCPP becomes more negative (less positive)).Footnote 8

Table 2 Long description
Panel A presents results for Martin and Wagner 2019 cost of equity. For each horizon (1 Month to 1 Year), columns show: CCPP_TOTAL coefficients range from minus 0.220 to minus 0.153, all significant at 1 percent except 1 Year at 5 percent. CCPP_OPP coefficients range from minus 0.319 to minus 0.203, all significant at 1 percent or 5 percent. CCPP_REG coefficients are small and mostly insignificant, ranging from 0.014 to 0.060. CCPP_PHY coefficients range from minus 0.308 to minus 0.257, all significant at 1 percent. Sample sizes (N) decrease with horizon, from 39,743 to 21,483. Adjusted R-squared values are between 0.644 and 0.647 for TOTAL, OPP, and PHY, and 0.629 to 0.635 for 1 Year. Economic effects for TOTAL, OPP, and PHY are 2 to 6 percent, REG is below 2 percent. Panel B shows Chabi-Yo et al. 2023 cost of equity. CCPP_TOTAL coefficients range from minus 0.106 to minus 0.184, significant at 5 or 1 percent. CCPP_OPP coefficients range from minus 0.131 to minus 0.229, significant at 5 or 1 percent. CCPP_REG coefficients are small, with only some significant at 10 or 5 percent. CCPP_PHY coefficients range from minus 0.183 to minus 0.212, all significant at 1 percent. Sample sizes and adjusted R-squared values are similar to Panel A, with R-squared up to 0.863. Economic effects for TOTAL, OPP, and PHY are 1 to 3 percent, REG is below 1 percent. Controls, time, and industry fixed effects are included in all models.
The CCPP coefficients decrease somewhat monotonically as the horizon extends from the short-term to 3 quarters and 1 year. In contrast, the economic magnitude of the effect—computed as the impact of a one-standard-deviation change in CCPP relative to the mean cost of equity—exhibits an inverse U-shaped pattern across horizons. For example, a one-standard-deviation decrease in total CCPP raises the MW annualized monthly cost of equity by about 3% (= 0.220%/0.073) of its average, where 0.073 is the average monthly cost of equity reported in Table 1. For the 1-quarter and 1-year horizons, the monthly MW cost of equity rises by 4% (= 0.258%/0.066) and 2% (= 0.153%/0.067) of its average, respectively. In general, the economic effect of institutional rebalancing on firms’ cost of equity ranges from about 1% to 6%, depending on the horizon and the type of climate change exposure. The effect is somewhat larger when cost of equity is proxied by MW than by GLB, which accounts for the higher-order moments of the risk-neutral distribution of returns. The stronger association between the Koijen and Yogo (Reference Koijen and Yogo2019) CCPP measure and the MW option implied cost of equity reflects a methodological alignment: both are grounded in a mean–variance framework. By contrast, the weaker relation with GLB likely reflects that CCPP, constructed in a mean–variance setting, captures only the variance component of GLB but not its higher-order moments.
The statistically significant effect of CCPP on the cost of equity extends Sautner et al. (Reference Sautner, van Lent, Vilkov and Zhang2023b), who document a positive correlation between firm-level climate exposures and option implied cost of equity. Importantly, CCPP remains significant in affecting the cost of equity even after controlling for firm-level climate exposures. Our findings also extend prior evidence that institutional underweighting based on ESG ratings increases firms’ cost of equity (e.g., Pedersen et al. (Reference Pedersen, Fitzgibbons and Pomorski2020), Pástor, Stambaugh, and Taylor (Reference Pástor, Stambaugh and Taylor2021), Pástor et al. (Reference Pástor, Stambaugh and Taylor2022), Zerbib (Reference Zerbib2022), and van der Beck (Reference van der Beck2023)). Finally, our results are consistent with the Bolton and Kacperczyk (Reference Bolton and Kacperczyk2021) divestment hypothesis that carbon-related divestment by institutional investors raises firms’ cost of equity.
On the other hand, our findings differ from Berk and van Binsbergen (Reference Berk and van Binsbergen2025) (BB), who report that divestment has a negligible effect on the firm’s cost of equity. Three factors may explain this discrepancy. First, BB employ a CAPM framework with homogeneous investors, whereas we adopt a demand-based framework that allows for investor heterogeneity. Second, BB results are sensitive to the choice of data and investor types. They estimate a negligible 0.44 bps effect by calibrating their model to a subset of the FTSE USA 4 Good Select Index (2015–2020), focusing only on mutual funds. By contrast, Atta-Darkua et al. (Reference Atta-Darkua, Glossner, Krueger and Matos2023) apply the BB model to MSCI ACWI stocks over a longer period (2006–2019) and include Climate Disclosure Project investors, finding a significantly larger 15 bps effect. More generally, Pástor et al. (Reference Pástor, Stambaugh and Taylor2024) show that depending on the BB parameter values, the cost of equity could rise by up to 24 bps, consistent with our estimates. Third, BB’s negligible effect is derived from calibrations to stock index data, whereas we analyze the cross-section of individual stocks. Zerbib (Reference Zerbib2022) finds that, on average, divestment raises the cost of equity of sin stocks by 10% relative to that of nonsin stocks when individual stocks are considered.
C. Which Investors Contribute to CCPP?
The model-based CCPP formula holds in equilibrium, aggregating information from all investors, and therefore cannot be computed separately by investor type. Nevertheless, we can assess whether the documented CCPP—and its effects on firms’ cost of equity—are driven by all investors or specific groups by examining which types of investors rebalance their portfolios in response to climate exposures. For instance, if no investor adjusted holdings when climate exposures changed (i.e.,
$ {\beta}_{1,i,t}=0 $
 ), CCPP would be zero (equation (3)).
We expect that certain types of investors—such as banks, pension funds, and insurance companies—may be more sensitive to climate change exposures than others, such as investment advisors (brokerage firms) who primarily execute client orders. To test this, we estimate equation (2) separately for each investor type, pooling portfolio weight data on U.S. common stocks across quarters.
Table 3 shows a statistically significant negative relation between firm-level total climate exposures and portfolio holdings for banks, insurance companies, and pension funds. Economically, a one-standard-deviation increase in total exposures reduces portfolio holdings by 9.9% for banks, 9.9% for insurance companies, and 5.9% for pension funds. Banks adjust their portfolio holdings the most in response to opportunities and regulatory exposures, consistent with their heightened sensitivity to policy and regulatory changes that affect credit risks and financing conditions. In contrast, insurance companies react more to physical exposures, which aligns with their direct financial vulnerability to climate-related damages and natural disasters. Interestingly, households overweight stocks with higher opportunity and regulatory exposures, while investment advisors show no significant reaction to changes in climate change exposures.

Table 3 Long description
Panel A, Total Climate Change Exposures: Columns left to right are Banks, Insurances, Investment Advisors, Mutual, Pensions, Households. Beta one coefficients: Banks minus 0.099 triple asterisk, Insurances minus 0.099 double asterisk, Investment Advisors minus 0.006, Mutual minus 0.020, Pensions minus 0.059 triple asterisk, Households 0.004. T-statistics: Banks minus 3.79, Insurances minus 2.36, Investment Advisors minus 0.25, Mutual minus 1.61, Pensions minus 6.54, Households 0.83. Sample sizes: Banks 5,650,302, Insurances 2,025,617, Investment Advisors 38,284,594, Mutual 9,018,819, Pensions 2,669,357, Households 172,763. Panel B, Opportunity Climate Change Exposures: Beta one coefficients: Banks minus 0.087 triple asterisk, Insurances minus 0.061 single asterisk, Investment Advisors 0.002, Mutual minus 0.020 single asterisk, Pensions minus 0.045 triple asterisk, Households 0.010 single asterisk. T-statistics: Banks minus 3.80, Insurances minus 1.86, Investment Advisors 0.07, Mutual minus 1.86, Pensions minus 5.27, Households 1.81. Sample sizes: Banks 4,751,794, Insurances 1,677,635, Investment Advisors 34,693,070, Mutual 7,418,803, Pensions 2,271,576, Households 142,735. Panel C, Regulatory Climate Change Exposures: Beta one coefficients: Banks minus 0.069 triple asterisk, Insurances minus 0.062 double asterisk, Investment Advisors minus 0.010, Mutual minus 0.018 single asterisk, Pensions minus 0.041 triple asterisk, Households 0.008 single asterisk. T-statistics: Banks minus 4.55, Insurances minus 2.40, Investment Advisors minus 0.71, Mutual minus 1.92, Pensions minus 5.15, Households 1.82. Sample sizes as in Panel B. Panel D, Physical Climate Change Exposures: Beta one coefficients: Banks minus 0.015, Insurances minus 0.044 double asterisk, Investment Advisors 0.006, Mutual minus 0.016 double asterisk, Pensions minus 0.017 triple asterisk, Households minus 0.024 triple asterisk. T-statistics: Banks minus 1.05, Insurances minus 2.13, Investment Advisors 0.72, Mutual minus 2.01, Pensions minus 2.89, Households minus 4.51. Sample sizes as in Panel B. All columns indicate controls are included. Asterisks denote significance: single for 10 percent, double for 5 percent, triple for 1 percent.
Our findings are consistent with prior evidence that banks and insurance companies incorporate climate change risks into their investment decisions (e.g., Hong and Kacperczyk (Reference Hong and Kacperczyk2009), Bauer, Ruof, and Smeets (Reference Bauer, Ruof and Smeets2021)). By contrast, brokerage firms (a subgroup of investment advisors, see Gompers and Metrick (Reference Gompers and Metrick2001)) do not respond to firms’ climate change exposures, as expected, since they execute transactions on behalf of clients and are therefore not directly exposed. Our results also align with evidence that hedge funds (another subgroup of investment advisors) do not engage in socially responsible investing (Hwang et al. (Reference Hwang, Titman and Wang2022), Koijen et al. (Reference Koijen, Richmond and Yogo2024)).
We extend the above analysis by examining whether investors’ heterogeneous portfolio sensitivities to climate change exposures depend on their climate consciousness. Following Gibson Brandon, Glossner, Krueger, Matos, and Steffen (Reference Gibson Brandon, Glossner, Krueger, Matos and Steffen2022), we classify investors as PRI signatories or nonsignatories, both within the full universe of investors and within each investor type (see Appendix C for details). Table 4 reports the results. Panel A shows that portfolio holdings are negatively related to firm-level total climate change exposures for both PRI and non-PRI investors when all investors are considered (columns 1 and 2). However, the magnitude of this relation differs across the two groups. The portfolio demand of PRI investors reacts more strongly to changes in total climate change exposures, thereby contributing more to the documented CCPP. This finding aligns with Pástor et al. (Reference Pástor, Stambaugh and Taylor2023), who show that UNPRI signatories tilt their portfolios toward stocks with higher ESG scores. At a more granular level, the pattern also holds within investor types: PRI mutual funds and pension funds respond more to total exposures than their non-PRI counterparts, consistent with Humphrey and Li (Reference Humphrey and Li2021), who find that PRI mutual funds have lower portfolio emissions. By contrast, the portfolios of non-PRI banks and insurance companies are more sensitive to climate change exposures than those of PRI investors. When examining the dissected climate exposures (Panels B–D), PRI investors react more strongly to opportunity and regulatory exposures than non-PRI investors.

Table 4 Long description
Panel A presents total climate change exposures. From left to right, columns are Investors, Banks, Insurances, Investment Advisors, Mutual Funds, and Pensions, each split into PRI and Non-PRI. For TOTAL, coefficients are negative for all groups, with PRI Investors at minus 0.058 (triple asterisk), Non-PRI Investors at minus 0.039 (double asterisk), PRI Banks at minus 0.036 (triple asterisk), Non-PRI Banks at minus 0.103 (triple asterisk), PRI Insurances at minus 0.025, Non-PRI Insurances at minus 0.091 (double asterisk), PRI Investment Advisors at minus 0.041, Non-PRI Investment Advisors at minus 0.000, PRI Mutual Funds at minus 0.055 (double asterisk), Non-PRI Mutual Funds at minus 0.022, PRI Pensions at minus 0.070 (triple asterisk), Non-PRI Pensions at minus 0.047 (triple asterisk). T-statistics are reported in the next row, ranging from minus 0.02 to minus 5.17. Sample sizes (N) are listed in the third row, with values such as 3,505,693 for PRI Investors and 54,841,156 for Non-PRI Investors. Panel B covers opportunity exposures (OPP), with all coefficients negative except for Non-PRI Investment Advisors and Non-PRI Mutual Funds, which are slightly positive. Significant negative coefficients are observed for PRI Investors (minus 0.050, double asterisk), Non-PRI Investors (minus 0.030, double asterisk), PRI Banks (minus 0.029, double asterisk), Non-PRI Banks (minus 0.093, triple asterisk), and others. Panel C details regulatory exposures (REG), with all coefficients negative, most significant at the 1 percent or 5 percent level, such as PRI Investors (minus 0.055, triple asterisk) and Non-PRI Investors (minus 0.033, triple asterisk). Panel D shows physical exposures (PHY), where coefficients are generally small and less significant, with some positive values for Non-PRI Investment Advisors and Non-PRI Mutual Funds. Across all panels, significance is denoted by asterisks, and sample sizes are consistent within each investor type. The table highlights that both PRI and Non-PRI signatories generally exhibit negative and often significant beta one coefficients for climate change exposures, with the strongest effects in total, opportunity, and regulatory exposures.
A final remark concerns who absorbs the price pressure (i.e., which investors take the opposite side of trades when portfolios are adjusted). Table 3 shows that all investor types, except households, have negative
$ {\beta}_1 $
 s, indicating that they on average underweight stocks as climate change exposures increase. This should not be interpreted as implying that every individual investor within each type has a negative
$ {\beta}_1 $
 . To investigate this, we estimate
$ {\beta}_{1,i,t} $
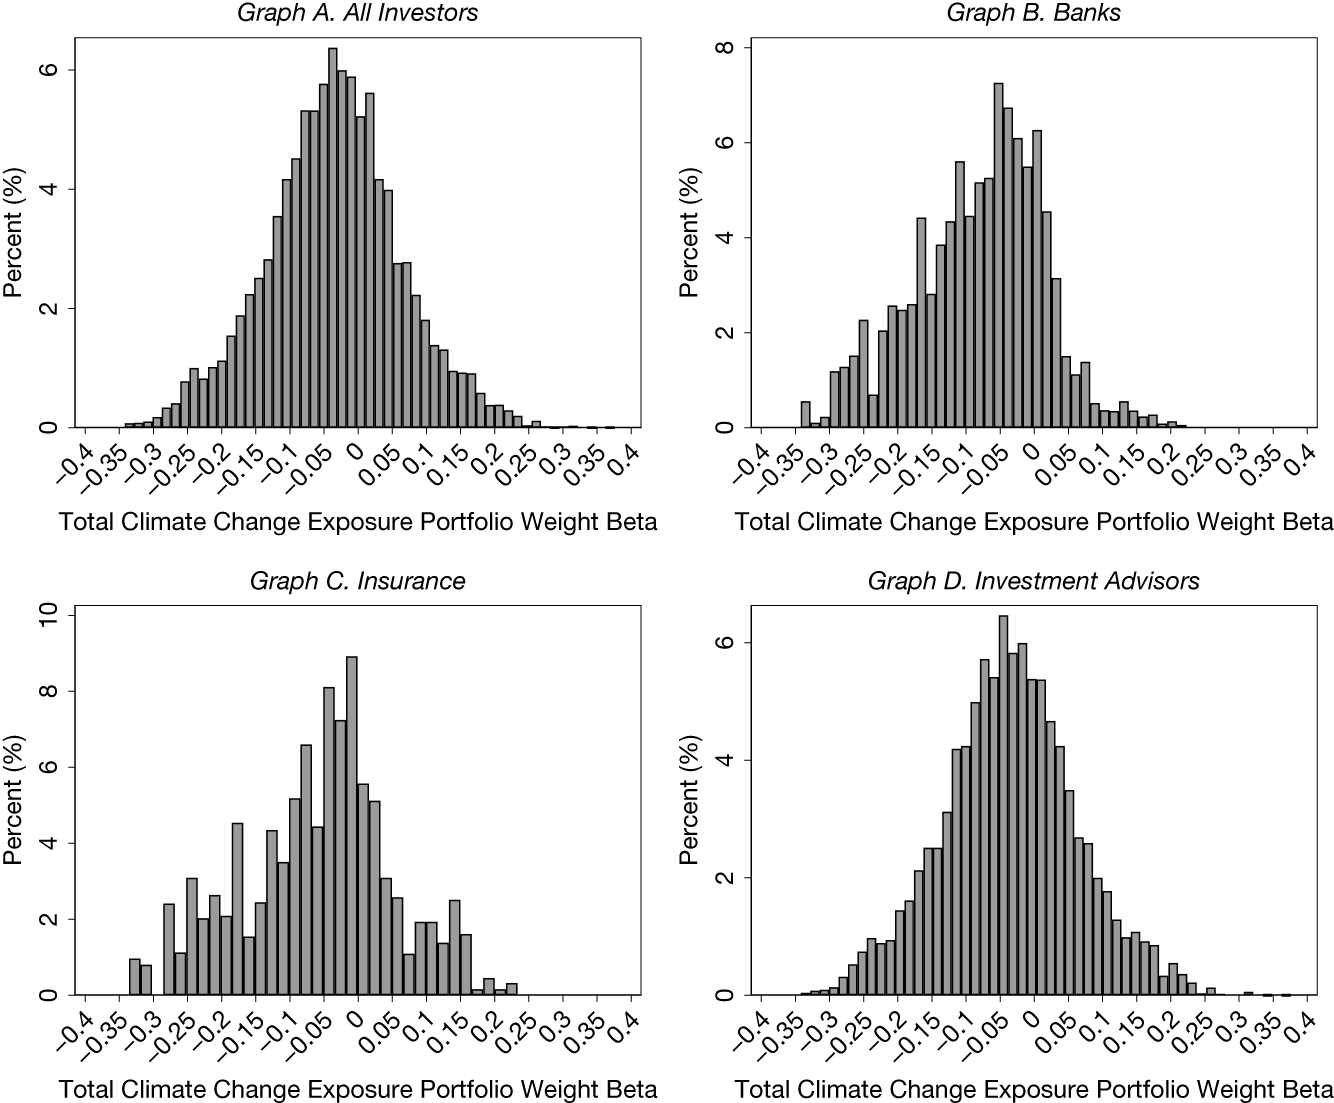
 for each individual investor by quarter, separately for each type of climate change exposure using equation (2). Graphs A–G of Figure 2 present histograms of the estimated
$ {\beta}_{1,i,t} $
 for all investors and for each investor type with respect to total climate change exposures. There is substantial variation in
$ {\beta}_1 $
 across individual investors, ranging from negative to positive values, indicating that some investors underweight while others overweight stocks as climate exposures increase, thereby taking the opposite side of the trade. This heterogeneity aligns with Koijen and Yogo (Reference Koijen and Yogo2019), who document variation in portfolio rebalancing across investors. Unreported results show similar patterns for the dissected climate change exposures.
Graphs A–G of Figure 2 plot the histogram of the sensitivities
$ {\beta}_{1,i,t} $
 of individual investors’ relative portfolio weights with respect to the total climate change exposure for all investors, banks, insurance, investment advisors, mutual funds, pension funds, and households, respectively. We estimate
$ {\beta}_{1,i,t} $
 for each individual investor and quarter using equation (2). The sample period is from 2005:1 to 2021:4.

Figure 2 Long description
Top left panel titled Graph A. All Investors shows a symmetric histogram centered near zero, x axis labeled Total Climate Change Exposure Portfolio Weight Beta from negative 0.4 to 0.35, y axis labeled Percent from 0 to 6. Top right panel titled Graph B. Banks displays a slightly right-skewed histogram, x axis from negative 0.4 to 0.4, y axis from 0 to 8. Bottom left panel titled Graph C. Insurance shows a histogram with a peak near negative 0.05, x axis from negative 0.35 to 0.3, y axis from 0 to 10. Bottom right panel titled Graph D. Investment Advisors presents a symmetric histogram centered near zero, x axis from negative 0.3 to 0.3, y axis from 0 to 6. All panels use percent on the y axis and portfolio weight beta on the x axis, illustrating the distribution of sensitivities for each investor group.

Long description
Top-left panel labeled Graph E Mutual Funds shows a symmetric, bell-shaped histogram with x-axis labeled Total Climate Change Exposure Portfolio Weight Beta ranging from minus 0.35 to 0.4, and y-axis labeled Percent ranging from 0 to 10. The peak is near zero. Top-right panel labeled Graph F Pension Funds displays a similar but narrower histogram, with x-axis ranging from minus 0.35 to 0.4 and y-axis from 0 to 15 percent. The peak is slightly right of zero. Bottom-center panel labeled Graph G Households presents a skewed histogram, with most values concentrated between 0.05 and 0.1, x-axis ranging from minus 0.4 to 0.4, and y-axis from 0 to 60 percent. Each panel visualizes the distribution of sensitivities for individual investors across three groups.
D. Effects on Firms’ Future Environmental Profiles
It is not clear in advance whether CCPP affects firms’ future environmental profiles. Firms would adjust their environmental practices to mitigate the impact of CCPP on their cost of equity only if the benefits exceed the costs of such reforms (Heinkel et al. (Reference Heinkel, Kraus and Zechner2001), Edmans et al. (Reference Edmans, Levit and Schneemeier2023)). We explore this by running the following predictive panel regression,

where
$ \Delta {Y}_{t+h}(n) $
 is the
$ h $
 -period ahead change in firm
$ n $
 ’s green activities, proxied separately by i) number of green filed patents, ii) ratio of number of green filed patents to log market equity, iii) economic real value of green filed patents, iv) ratio of environmental expenditures to total assets, v) ratio of environmental provisions to total assets, vi) ratio of environmental fines to total assets, and vii) emission intensities. The vector of control variables
$ {\mathbf{X}}_t(n) $
 follows Sautner et al. (Reference Sautner, van Lent, Vilkov and Zhang2023a). Green patents capture firms’ investments in green innovation and abatement technologies, reflecting actions that could mitigate the impact of CCPP on the cost of equity. Green expenditures, environmental provisions, and self-reported environmental fines allow us to isolate firms’ environmental activities from broader items, such as total capital expenditures and overall liabilities, providing a more direct assessment of whether CCPP influences firms’ environmental behavior.
Table 5 reports the results for CCPP stemming from total climate change exposures. Firms do not significantly increase their future investment in green technologies or environmental expenditures in response to CCPP. Likewise, provisions for potential environmental liabilities and self-reported environmental fines remain unaffected. We further confirm the robustness of these findings by considering alternative constructions of the Refinitiv green variables, including taking the logarithm of one plus environmental expenditures following Jing, Keasey, Lim, and Xu (Reference Jing, Keasey, Lim and Xu2024), scaling environmental expenditures by log market equity, and leaving missing values unfilled. Across all specifications, the results remain consistent: CCPP—whether stemming from total, opportunity, regulatory, or physical climate change exposures—does not induce firms to increase their environmental investments or activities. Unreported results also support these conclusions when using granted green patents, the alternative European Patent Office Climate Change Mitigation Technologies classification, or green patent variables computed at a quarterly frequency.

Table 5 Long description
The table is divided into seven panels labeled A through G, each representing a different dependent variable related to green activities. Each panel contains five columns for forecast horizons: 1 year, 2 years, 3 years, 4 years, and 5 years. Panel A, number of green filed patents, shows C C P P underscore T O T A L coefficients from negative zero point one three three (significant at 10 percent) for 1 year to zero point zero zero seven for 5 years, with t-statistics in parentheses below each coefficient. Sample sizes decrease from 9329 to 6519 across horizons. Adjusted R squared increases from zero point zero zero eight to zero point zero four three. Panel B, number of green filed patents over log market equity, shows coefficients from negative zero point zero one two (significant at 10 percent) to negative zero point zero zero one, with t-statistics and similar sample sizes and adjusted R squared values. Panel C, economic real value of green filed patents, shows positive coefficients increasing from zero point zero eight two to one point nine six two, with t-statistics and adjusted R squared rising from zero point zero four seven to zero point one four zero. Panel D, environmental expenditures over total assets, shows positive coefficients from nineteen point nine eight three to twenty seven point eight four three, with t-statistics and adjusted R squared from zero point zero one six to zero point zero six two. Panel E, environmental provisions over total assets, shows mixed coefficients from three point nine three three to nineteen point six two five, with some negative values, t-statistics, and adjusted R squared from zero point zero three four to zero point one four three. Panel F, environmental fines over total assets, shows coefficients near zero, some negative, with t-statistics and adjusted R squared from zero point one eight zero to zero point four four one. Panel G, Trucost total carbon emission intensities, shows negative coefficients from negative two point three zero nine to negative seven point one four five, with t-statistics and adjusted R squared from zero point one zero two to zero point four three seven. All panels include rows for sample size, adjusted R squared, and indicate that controls, time fixed effects, and industry fixed effects are included in all regressions.
Our findings suggest that firms do not become greener in response to CCPP, despite facing a higher cost of equity. In a frictionless world, this behavior could be interpreted as suboptimal, since firms would undertake reforms to maximize values. In reality, however, implementing environmental reforms entails costs—both measurable, such as changes in production processes, and nonmeasurable, such as shifts in the corporate culture and organizational structure. These costs constitute frictions. Consistent with Heinkel et al. (Reference Heinkel, Kraus and Zechner2001) and Edmans et al. (Reference Edmans, Levit and Schneemeier2023), firms’ decisions not to improve environmentally could thus be interpreted as the outcome of a cost–benefit analysis rather than suboptimal behavior. Our results imply that the costs of reforms outweigh an increase in the cost of equity of roughly 6% of its average value, as documented in Section IV.B. More generally, while the effect of CCPP on the cost of equity is statistically significant, it is ineffective in influencing corporate decision making, as it does not induce changes in firms’ environmental profiles. This aligns with Edmans et al. (Reference Edmans, Gosling and Jenter2025), who argue that even a 50-basis-point change in the cost of equity is too small to alter firms’ environmental actions. Our conclusion echoes that of Atta-Darkua et al. (Reference Atta-Darkua, Glossner, Krueger and Matos2023) and BB: Divestment at current levels is insufficient to induce firms to alter their environmental profiles.
V. Further Analysis
We conduct additional robustness tests. First, investors may consider market-wide as well as firm-level climate change exposures when rebalancing their portfolios. To capture this, we construct an additional climate change price pressure measure with respect to aggregate (i.e., market-wide) climate change risks, termed
$ ACCPP $
 . We examine its effects on firms’ cost of equity and future environmental profiles. In Supplementary Appendix IC, we provide the derivation, the relation between ACCPP and CCPP, and the panel regression results including both CCPP and ACCPP. The results are similar to the baseline analysis: price pressure—whether from aggregate or firm-level exposures—raises the cost of equity but does not induce firms to alter their future environmental profiles.
Second, Hartzmark and Shue (Reference Hartzmark and Shue2023) document that changes in firms’ cost of capital affect their future environmental performance differently for brown versus green firms. We investigate the relation between CCPP and firms’ future environmental profiles separately for brown, neutral, and green firms, and find no significant effects, confirming the evidence in Section IV.D. Supplementary Appendix Table ID.1. reports these results. The findings remain robust for CCPP stemming from any type of climate change exposure, as well as for ACCPP. Our results differ from Hartzmark and Shue (Reference Hartzmark and Shue2023), who find that brown firms increase their future carbon emission intensities following an increase in their cost of capital. This discrepancy may arise because, in their setting, changes in firms’ cost of capital are not exclusively tied to sustainable investing and may reflect other factors. In contrast, CCPP-induced changes in the cost of equity in our study are linked solely to sustainable investing.
VI. Conclusions and Implications
We take a novel approach to directly address the open question of whether institutional portfolio rebalancing—driven by firms’ physical and transition climate exposures—affects the cost of equity for S&P 500 firms and their future environmental profiles. Our analysis employs a stock-level climate change price pressure (CCPP) channel, derived as a local equilibrium sensitivity within the Koijen and Yogo (Reference Koijen and Yogo2019) framework. CCPP captures the mechanism through which divestment can affect stock prices and expected returns: anticipated selling pressure, even if unrealized today, raises the risk of future price declines, which investors incorporate into expected returns and demand compensation for. We find that, on average, investors underweight firms with high climate change exposures, generating a CCPP that raises the cost of equity by up to 6% of its average. However, this climate-triggered price pressure does not induce firms to improve their environmental performance. This finding is analogous to Duchin, Gao, and Xu (Reference Duchin, Gao and Xu2025), who find that divestment from pollutive plants does not reduce pollution overall.
Our results imply that, at current levels of divestment, CCPP raises firms’ equity financing costs without altering their climate-related behavior. This may be because the costs of environmental reforms—spanning tangible assets, corporate culture, and labor relations—outweigh the prospective benefits of a lower cost of equity. This does not imply that the divestment mechanism is ineffective in principle. If more investors were to divest, results could differ. At current divestment levels, investor engagement may be more effective than price pressure in driving corporate reforms. This is particularly concerning given recent exits of major institutional investors from climate coalitions.Footnote 9 Finally, policymakers could leverage our CCPP metrics to design targeted environmental regulations, identifying sectors where firms face more negative CCPP—and thus higher cost of equity—to foster corporate investment in sustainability. The sensitivities of portfolio holdings to climate exposures—an integral part of the CCPP—can also indicate whether investors rebalance their portfolios in line with their sustainability commitments (see Supplementary Appendix IF for an application to the Harvard University Endowment).
Appendix A. Stock-Level CCPP Derivation (Equation (3))
The market clearing condition for stock
$ n $
 at
$ t $
 ,
$ {P}_t(n){S}_t(n)={\sum}_{i=1}^I{A}_{i,t}{w}_{i,t}(n) $
 , implies that the vector of the equilibrium log stock prices of all stocks at
$ t $
 is,

where
$ {\mathbf{s}}_t $
 denotes the vector of the log outstanding shares of all stocks at
$ t $
 . Differentiating equation (A.1) with respect to the vector of climate change exposures of all stocks at
$ t $
 ,
$ \mathbf{c}{\mathbf{c}}_t^{\prime } $
 :

where
$ {\mathbf{H}}_t={\sum}_i^I{A}_{i,t}\operatorname{diag}\left({\mathbf{w}}_{i,t}\right) $
 . To calculate
$ \frac{\partial {\mathbf{w}}_{i,t}}{\partial {\mathbf{p}}_t^{\prime }} $
 , and
$ \frac{\partial {\mathbf{w}}_{i,t}}{\partial \mathbf{c}{\mathbf{c}}_t^{\prime }} $
 , consider


We aggregate the portfolio weights of all stocks within the investment universe of investor
$ i $
 ,

where
$ m $
 denotes the stock in investor
$ i $
 ’s investment universe, and

Equations (A.5) and (A.6) yield

Substituting equation (A.7) into equation (A.4) yields

Differentiating
$ {w}_{i,t}(n) $
 in equation (A.8) separately with respect to
$ {cc}_t(n) $
 and
$ {cc}_t(l) $
 , where
$ l $
 denotes any other stock in the investment universe of investor
$ i $
 , yields


Equations (A.9) and (A.10) yield

where
$ {\mathbf{G}}_{i,t}=\operatorname{diag}\left({\mathbf{w}}_{i,t}\right)-{\mathbf{w}}_{i,t}{\mathbf{w}}_{i,t}^{\prime } $
 . Through analogous steps,

Substituting equations (A.11) and (A.12) into equation (A.2) yields

where
$ {\mathbf{G}}_{i,t}=\operatorname{diag}\left({\mathbf{w}}_{i,t}\right)-{\mathbf{w}}_{i,t}{\mathbf{w}}_{i,t}^{\prime } $
 .
The CCPP for stock
$ n $
 is given by the
$ n $
 th diagonal element of the matrix in equation (A.13):

where
$ {p}_t(n)=\log \left({P}_t(n)\right) $
 and
$ {s}_{i,t}(n) $
 represents investor
$ i $
 ’s share of stock
$ n $
 ’s market capitalization at
$ t $
 , defined as
$ {s}_{i,t}(n)={A}_{i,t}{w}_{i,t}(n)/{\sum}_i^I{A}_{i,t}{w}_{i,t}(n) $
 .
Appendix B. Variable Definitions
Firm-Level Green Variables
- TOTAL/OPP/REG/PHY
-
Frequency of climate change-related bigrams—categorized as total/opportunity/regulatory/physical exposure—in firms’ earnings conference call transcripts per firm-quarter. Source: Sautner et al. (Reference Sautner, van Lent, Vilkov and Zhang2023a).
- GP_FILED
-
Number of green patents filed per firm-year. Source: Self-constructed.
- GP_FILED Ratio
-
Number of green patents filed per firm-year, scaled by the logarithm of the firm’s market equity. Source: Self-constructed.
- GP_VALUE
-
Present real value of expected future cash flows from green patents filed per firm-year. Source: Self-constructed.
- ENV_EXPENSE
-
Expenditures on environmental protection, prevention, reduction, and control of environmental impacts and hazards per firm-year, scaled by the firm’s total assets. Source: Refinitiv.
- ENV_PROV
-
Provisions kept aside to cover potential environmental liabilities per firm-year, scaled by the firm’s total assets. Source: Refinitiv.
- ENV_FINES
-
Amount of fines paid for violations of environmental regulations per firm-year, scaled by the firm’s total assets. Source: Refinitiv.
- CI_TRUCOST
-
Sum of scopes 1 and 2 carbon emissions per firm-year, scaled by the firm’s revenues. Source: Trucost.
Option Implied Firm-Level Cost of Equity
- MW (30,91,182,273,365)
-
Option implied annualized cost of equity measure over horizons of 1 month, 1 quarter, 2 quarter, 3 quarter, and 1 year per firm-day, by Martin and Wagner (Reference Martin and Wagner2019). Source: Self-constructed.
- GLB (30,91,182,273,365)
-
Option implied annualized cost of equity measure over horizons of 1 month, 1 quarter, 2 quarter, 3 quarter, and 1 year per firm-day, by Chabi-Yo et al. (Reference Chabi-Yo, Dim and Vilkov2023). Source: https://osf.io/7xcqw/.
Firm-Level Stock Characteristics
- LNME
-
Log of the product of stock prices (PRC) and shares outstanding (SHROUT) per firm-month. Source: CRSP Monthly Stock.
- LNBE
-
Log of the sum of shareholder equity (SEQ), deferred taxes, and investment tax credit (TXDITC), minus the book value of preferred stock (PSTK), per firm-quarter. Source: Compustat North America Fundamentals Quarterly and Annual.
- BETA
-
Monthly stock beta, estimated from a 60-month rolling regression of stock excess returns on market excess returns, requiring at least 24 months of data. Source: CRSP Monthly Stock database, Kenneth R. French Data Library.
- PROFIT
-
Ratio of operating profits to book equity per firm-quarter, where the operating profits are annual revenues (REVT) minus the cost of goods sold (COGS), selling, general, and administrative expenses (XSGA), and interest expenses (XINT). Source: Compustat North America Fundamentals Quarterly and Annual database.
- GAT
-
Annual log growth rate of total assets (AT) per firm-quarter. Source: Compustat North America Fundamentals Quarterly and Annual.
- DIVABE
-
Annual dividends (DIV) per split-adjusted share multiplied by shares outstanding, divided by book equity per firm-quarter. Source: CRSP Monthly Stock database, Compustat North America Fundamentals Quarterly and Annual.
- BTM
-
Ratio of book equity to market equity per firm-quarter. Source: CRSP Monthly Stock database, Compustat North America Fundamentals Quarterly and Annual.
- MOMENTUM
-
Cumulative return of the stock during the 11-month period covering months $ t $
 -11 through
$ t $
-1 per firm-month. Source: CRSP Monthly.
- SIZE
-
Log of a firm’s total assets (AT) per firm-quarter. Source: Compustat North America Fundamentals Quarterly and Annual.
- TANGIBILITY
-
Ratio of property, plant, and equipment (PPENT) to total assets (AT) per firm-quarter. Data are obtained from Compustat North America Fundamentals Quarterly and Annual.
- LEVERAGE
-
Total debt (DLTT+DLC) divided by total assets (AT) per firm-quarter. Source: Compustat North America Fundamentals Quarterly and Annual.
- CAPX
-
Capital expenditures (CAPX) divided by total assets (AT) per firm-quarter. Source: Compustat North America Fundamentals Quarterly and Annual.
- R&D
-
Research and development expenses (XRD) divided by total assets (AT) per firm-quarter. Missing XRD values set to zero. Source: Compustat North America Fundamentals Quarterly and Annual.
- CASH
-
Cash and short-term investments (CHE) divided by total assets (AT) per firm-quarter. Source: Compustat North America Fundamentals Quarterly and Annual.
- IO
-
Percentage ownership held by the institutional investors (INSTOWN PERC) per firm-quarter. Source: Thomson Reuters.


Appendix C. Matching 13F Investors with PRI Investors
We follow Gibson Brandon et al. (Reference Gibson Brandon, Glossner, Krueger, Matos and Steffen2022), their Appendix Table IA1, and match the names of institutional investors in the 13F database with those of the PRI signatories (publicly available at https://www.unpri.org) using the fuzzy matching technique. First, we clean the investor names in both the PRI signatory lists and the 13F database for case type, punctuation, stop words, incorporation words, and special characters, and exclude PRI signatories classified as service providers. Second, we merge the PRI signatory lists with the 13F database by quarter. In each quarter, we calculate the Jaro-Winkler (JW) distance between each name in the 13F database and those in the PRI signatory list from 2006:Q2 (the starting quarter for the PRI signatories data) to 2021:Q4. Third, we retain any name pairs in the two databases if their JW distance is greater than 0.85 and the investor’s headquarters country is the same in both the PRI signatory list and the 13F database. Fourth, for each investor, we retain only the match with the highest JW distance. In cases where multiple matches share the highest JW distance, we manually verify them by comparing the investor names in the 13F database and UNPRI signatory lists, keeping only the correct match. Fifth, we manually review each retained pair and keep only the correct matches. Finally, for each institutional investor, we assign the PRI signatory status in the quarter of the match, marking all subsequent quarters as signatory and all prior quarters as nonsignatory.
Supplementary Material
To view supplementary material for this article, please visit http://doi.org/10.1017/S0022109025102226.
Funding Statement
The paper is supported by the Fundamental Research Funds for the Central Universities (SKYD2026033).