Introduction
Straw is an important biological resource that is rich in nitrogen (N), phosphorus (P), potassium (K) and trace elements (Lal, Reference Lal2005; Sun et al., Reference Sun2016a). Straw incorporation provides a rich carbon (C) source for the soil microbial community and stimulates soil microbes and various enzyme activities, which are beneficial to the improvement of soil quality and productivity (Allison and Killham, Reference Allison and Killham1988; Zhao et al., Reference Zhao2016). Soil microbes and enzymes are involved in the soil biochemical processes and nutrient cycling, which are commonly used to evaluate the soil quality and fertility (Balota et al., Reference Balota2004; Utobo and Tewari, Reference Utobo and Tewari2015).
Straw length, amount and burial depth are important factors affecting the soil enzyme activity and the soil microbiome (Wang et al., Reference Wang2015; Wei et al., Reference Wei2015; Zhao et al., Reference Zhao2016). Straw length will directly affect its decomposition rate in the soil. Furthermore, the distribution and activity of the soil microbial community could also be affected by straw length. The smaller the size of the straw, the larger the specific surface area, which contributes to increased degradation. In contrast, longer straw has a negative effect on degradation (Hassink, Reference Hassink1997; Bending and Turner, Reference Bending and Turner1999). Straw length is related closely to the exchange of soil moisture and nutrients within the soil, further affecting the decomposition rate of straw and the population status of microorganisms (Swift et al., Reference Swift, Heal and Anderson1979). In addition, taking into account agricultural machinery research, straw length can also affect agricultural energy consumption (Farid Eltom et al., Reference Farid Eltom2015) and an appropriate straw length can reduce the energy consumption of agricultural machinery (Zhang et al., Reference Zhang2014). Straw influences soil microbes and enzymes mainly by the soil C to N ratio. The soil C : N ratio is a critical factor directly influencing the decomposition and accumulation of soil organic matter, which influences the quantity and activity of soil microorganisms (Zhao et al., Reference Zhao2016). Straw burial depth is one of the most important factors affecting soil enzyme activity (Wei et al., Reference Wei2015). Different depths of soil cultivation have different influences on straw decomposition and microbial utilization (Rottmann et al., Reference Rottmann, Dyckmans and Joergensen2010). Long-term burying of straw in ditches (to depths of both 20 cm and 40 cm, i.e. straw incorporation) alters soil microbial communities (Yang et al., Reference Yang2016), and straw burial depth is affected by straw length and tillage depth (Farid Eltom et al., Reference Farid Eltom2015). Straw length affects its movement within the soil significantly (Liu et al., Reference Liu, Chen and Kushwaha2010). Movement of the tillage tool and incorporation of crop residue are affected by the interactions between the tillage tool, the soil (type, composition, etc.), the crop residue itself (e.g. straw length) and the cultivation depth (Sommer et al., Reference Sommer2011; Farid Eltom et al., Reference Farid Eltom2015). Furthermore, straw length also has an impact on forward soil displacement during tillage: it decreases with increasing straw length, leading to shallower burial (Farid Eltom et al., Reference Farid Eltom2015). The length of straw affects the depth of its incorporation and deeper burial is required for longer straw lengths (Dursun et al., Reference Dursun, Güner and Edogan1999; Mari et al., Reference Mari, Tagar and Huimin2014). Therefore, the straw amount, straw length and burial depth are the most important factors influencing soil enzyme and microbial activities. Previous studies have reported different conclusions, with low rates of straw return having no significant effects on the soil microbial community and enzyme activities, while high rates of straw changed the microbial community structure and increased the activities of most hydrolytic enzymes (Zhao et al., Reference Zhao2016). Straw incorporation increased soil urease, phosphatase and invertase activities in 0–60 cm soil layers, and incorporation of 13 500 kg/ha straw was reported as most effective for improving soil fertility (Zhang et al., Reference Zhang2016b). Straw return mainly influences soil microorganisms and enzyme activities in the topsoil at the depths of 0–30 and 0–40 cm, respectively (Ji et al., Reference Ji2014). Moreover, little is known about the combined effects of straw length, straw amount and straw burial depth on the soil microbial functional diversity and enzyme activity. Most previous studies have been evaluated only on either a single factor or a combination of two factors. In the current study, a quadratic orthogonal rotation combination design was applied in order to overcome this disadvantage, which allowed a multivariate analysis to be conducted using a minimum number of experiments (Son et al., Reference Son, Vavra and Forbes2015).
In the current paper, straw incorporation was evaluated by finding the comprehensive index values, which can represent soil microbial functional diversity and enzyme activity. The overall objective of the present study was to explore the combined effects of straw length, amount and burial depth on the comprehensive index values, as well as finding the best combination for each of the factors. The methodology presented in the current study can be divided into two main steps. Firstly, the balanced weight of single-indicator attributes was determined by using the analytic hierarchy process (AHP), the entropy weight method and the game theory. Secondly, the Technique for Order of Preference by Similarity to Ideal Solution (TOPSIS) was used to find comprehensive index values by computing the relative closeness of each index.
Materials and methods
Site description
The experiment was conducted at the Xiang Yang Farming, Harbin, Heilongjiang, China (45°46′N, 126°55′E, 127.95 m a.s.l.). This site has a cool temperate continental climate. The average annual precipitation is 500–550 mm, with a frost-free period of 140 days.
The soil is a typical black soil, with pH of 6.3. The organic matter, total N, total P and total K were 39.06, 2.20, 2.71 and 17.98 g/kg, respectively. The available P and K were 0.21 and 0.18 g/kg, respectively.
The buried straw contained 479 g/kg total C, 13.18 g/kg total N, 4.47 g/kg total P, 15.37 g/kg total K and 41.2% fibre.
Experimental materials and experimental design
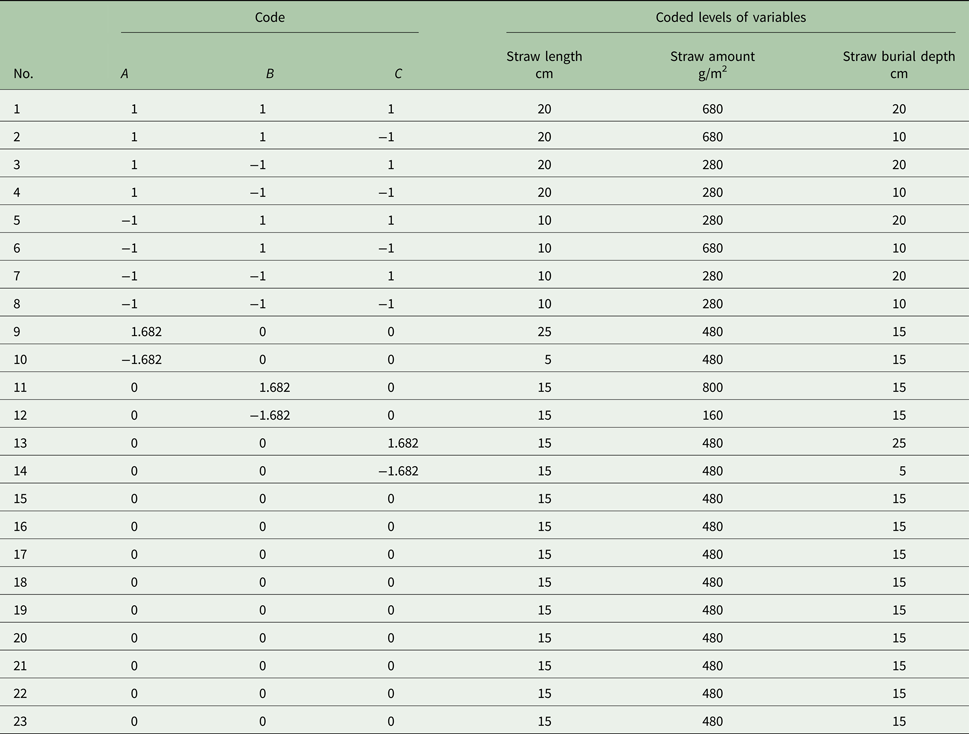
A quadratic orthogonal rotation combination design was applied that included 23 experimental runs (Table 1) consisting of nine replicates at the centre point (Myers and Montgomery, Reference Myers and Montgomery1995; Dhawane et al., Reference Dhawane, Kumar and Halder2015). Straw amount, length and burial depth were defined as the three experimental factors. The five coded levels of three independent variables were set as −1.682, −1, 0, 1 and 1.682. The relationship between coded and uncoded forms of variables is given by Eqn (1):
 $$x_i = \displaystyle{{x_i - {\bar x}_i} \over {\Delta X}}$$
where x i is the actual value of the ith factor in the uncoded units,  $\bar x_i$ is the average of the low and high values for the ith factor, and ΔX represents the step change.
Experimental design

The experiments were run in a random order to reduce any systematic errors. An analysis of variance was conducted to check the experimental data for the determination of the model (Box and Draper, Reference Box and Draper1986).
The experiment was replicated three times in a randomized block design. Each plot was 120 m2 (5 × 24 m). Before the test, straw was air-dried and chopped into pieces that measured approximately 5, 9, 15, 20 and 25 cm. Different straw amounts were weighed, i.e. 160, 280, 480, 680 and 800 g. According to the amount and length of the straw in the test design (Table 1), the straws were placed into nylon bags (100 mesh). After being bagged, the straw was soaked in water so that its water content reached 40%. On 6 May 2016, ditches were hand-dug at different depths of 5, 10, 15, 20 and 25 cm. Each nylon bag was buried at the depth of the experimental design.
Sampling and measurement
After the wheat was harvested on 21 October 2016, fresh soil from around the nylon net bags (approximately 500 g) was collected from each plot. Soil samples were air-dried and mixed thoroughly, sieved through 1 mm mesh and then measured for soil enzyme activity. Fresh soil samples were passed through a 2 mm sieve to remove straw residues and root debris, then they were stored immediately at 4 °C prior to soil microbial functional diversity analysis.
Soil enzyme activity analysis
For all enzyme assays, controls were included without substrate and without soil samples, in triplicate per sample. Catalase activity was measured using a titrimetric method: 2 g soil, 40 ml distilled water and 5 ml 0.3% hydrogen peroxide were placed in a 100 ml Erlenmeyer flask. The flask was sealed and shaken for 20 min (at 150 rpm), then 25 ml of the soil suspension was filtered immediately (Whatman 2 V) before the addition of 5 ml 1.5 mol/l sulphuric acid to terminate the reaction. Then, 25 ml of the filtrate was titrated with 0.005 mol/l potassium permanganate (KMnO4). The results are presented as KMnO4 g/h (Roberge, Reference Roberge and Burns1978). To measure urease activity, 5 g soil and 1.0 ml toluene were mixed and after 15 min, 5 ml of 10% urea solution and 20 ml citrate buffer at pH 6.7 were added. The samples were incubated at 37 °C for 24 h before the suspension was filtered. Then, 1 ml of filtered liquor was put into a 50 ml volumetric flask, and 4 ml of sodium phenate and 3 ml of sodium hypochlorite were added. The released ammonium (NH4+) was measured at 578 nm after 20 min. The results were expressed as mg NH4+–N g/h (May and Douglas, Reference May and Douglas1976). Invertase activity was measured using 5 g soil with 0.1 ml toluene, 15 ml 8% sucrose and 5 ml phosphate buffer (pH 5.5) incubated for 24 h at 37 °C. Then, the sample was filtered and a 1 ml aliquot transferred to a volumetric flask with 3 ml 3,5-dinitrylsalicylate, heated for 5 min and measured at 508 nm. The invertase activity was expressed as mg glucose released/g substrate/h (Guan, Reference Guan1986). To measure acid phosphatase activity, 1 g soil was incubated with 0.2 ml toluene, 10 ml disodium phenyl phosphate solution and 10 ml modified universal buffer (pH 6.5) at 37 °C for 24 h, then filtered and coloured with 0.5 ml of 2% 4-amino antipyrine and 8% potassium ferrocyanide. The phenol released was measured at 510 nm and the results expressed as mg phenol/g substrate/h (Dick et al., Reference Dick, Sandor and Eash1994).
Community-level physiological profile
Soil microbial functional diversity was measured by Biolog-ECO plate (BIOLOG, Inc., Hayward, California, USA) with 31 unique C substrates (Garland and Mills, Reference Garland and Mills1991). Briefly, 10 g fresh soil was added to 90 ml of 0.85% sodium chloride and shaken for 30 min at 250 r/min. Then, 1000-fold dilutions were performed after the suspensions had settled for 15 min. An ECO plate was inoculated with an aliquot (150 µl) of soil suspension using a pipette. All ECO plates were placed into polyethylene bags at 28 °C for 24 h to reduce desiccation, then incubated in dark growth chambers. The colour development of each well was measured at 590 nm with an ELISA plate reader (Nanjing Detielab, HBS-1096, Nanjing, China) every 24 h for 10 days. Each treatment was replicated three times. Absorbance was measured after 96 h. The microbial functional diversity indices were calculated (Zak et al., Reference Zak1994), and expressed by the Shannon–Weaver (H), Shannon evenness (E), Simpson diversity (D) and McIntosh (U) indices.
Average well colour development (AWCD) reflects the overall situation of soil microbes utilizing different C sources and is calculated as:
 $${\rm AWCD} = \displaystyle{{\sum\nolimits_{i = 1}^{31} {(C_i - R)}} \over {31}}$$
where C is the optical density (OD) value of the reaction wells and R is the OD value of the controlled well.
Shannon diversity (H)
 $$H = - \sum\limits_{i = 1}^n {\left[ {P_iLn\,(P_i)} \right]} $$
 $$P_i = \displaystyle{{C_i - R} \over {\sum\nolimits_{i = 1}^n {(C_i - R)}}} $$
Shannon evenness (E)
 $$E = \displaystyle{H \over {LnS}}$$
where S is the number of C sources whose colour is changed (C i–R > 0.25).
Simpson diversity (D)
 $$D = 1 - \sum\limits_{i = 1}^n {P_i^2} $$
where P i is the ratio of the relative absorbance of a particular substrate to the sum of the absorbance of the entire ECO plate;
McIntosh (U)
 $$U = \sqrt {\left( {\sum {n_i^2}} \right)} $$
where n i is the relative absorbance of i.
Research methods
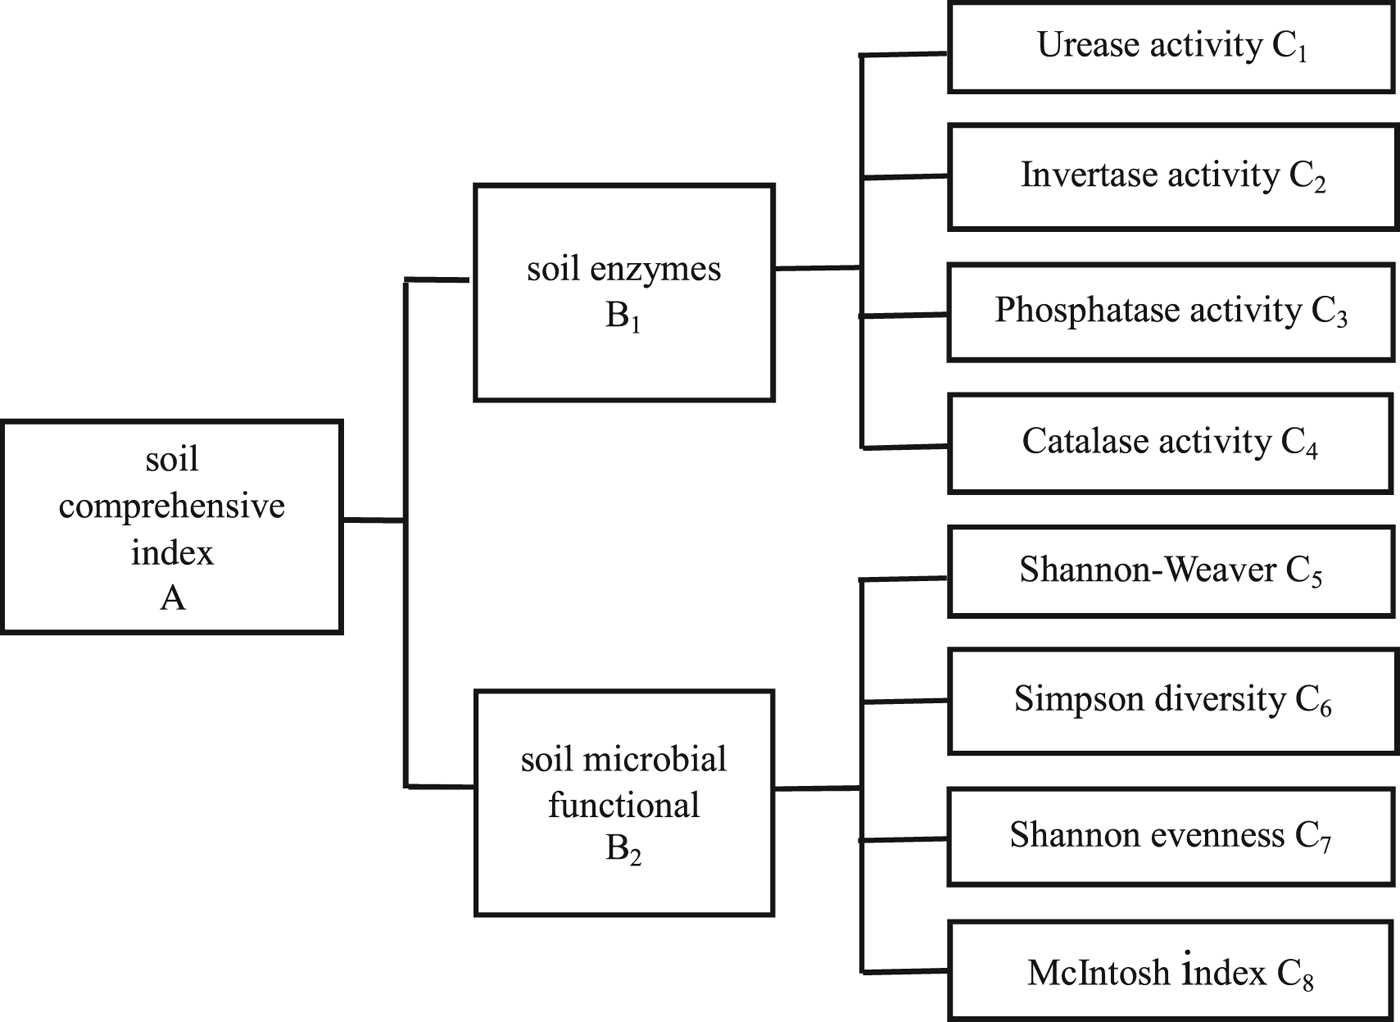
The AHP and the entropy method were applied to calculate the weights of research indicators in order to make the weight of each index more accurate (Fagbote et al., Reference Fagbote, Olanipekun and Uyi2014). The evaluation index was constructed by the AHP method (Fig. 1), as AHP contains certain subjectivity (Saaty, Reference Saaty2008; Sun et al., Reference Sun, Wang and Hao2017). The entropy method was used to make up for the shortcomings of AHP, as the result of the entropy method was absolutely objective. Therefore, game theory was applied to obtain the weight of indicators (Sun et al., Reference Sun2016b), which integrated the weight of subjective (AHP) and objective (entropy) methods, then the comprehensive values of all indicators were calculated by the TOPSIS method (Shih et al., Reference Shih, Shyur and Lee2007; Zavadskas et al., Reference Zavadskas2016). Design-Expert (6.0.8) software was used to analyse the quadratic polynomials and comprehensive index.
Evaluation hierarchy of soil comprehensive index.

Subjective weight based on analytic hierarchy process
As a comprehensive evaluation method combined with qualitative and quantitative, AHP has been used widely in many research fields (Sindhu et al., Reference Sindhu, Nehra and Luthra2017; Sun et al., Reference Sun, Wang and Hao2017). The index of the current evaluation system was established by AHP (Fig. 1). Two pairs of comparison judgement matrices were constructed. The weights of indicators were determined by the consistency test. Finally, the overall weight of each indicator was calculated.
Entropy method
The entropy method can be used to assess the size of information. The more information an index carries, the greater its effect on decisions. When the evaluation object has a large value, entropy is small, which indicates that more information is provided by the indicator and the weight of the index should be larger. This approach avoids human subjectivity, resulting in accurate results (Zou et al., Reference Zou, Yun and Sun2006).
There are m evaluation indicators and n evaluation objects, so the original data matrix is formed as R = (r ij)m×n. Determination of the entropy value for each index is as follows:
 $$H_i = - k\sum\limits_{\,j = 1}^n {\,f_{ij}} \ln f_{ij}(i = 1,\,2,\,3, \ldots, m;\,\,j = 1,\,2,\,3, \ldots, n)$$
where:  $f_{ij} = (f_{ij}/\sum\nolimits_{j = 1}^n {r_{ij}} ),\,k = (1/\ln n)$, (assumption: if f ij = 0, then f ijlnf ij = 0).
 $$w_i = \displaystyle{{1 - H_i} \over {n - \sum\nolimits_{i = 1}^m {H_i}}} $$
where  $0 \le w_i \le 1,\,\sum\nolimits_{i = 1}^m {w_i} = 1$.
Combination weight based on game theory
Game theory can reach a consensus or compromise between the subjective and objective weights (Frank and Sarkar, Reference Frank and Sarkar2010; Sun et al., Reference Sun2016b). This approach is regarded as an optimum equilibrium solution, which is helpful to improve the reliability of the evaluation conclusion (Lai et al., Reference Lai2015; Wang et al., Reference Wang2017).
To improve the objectivity of the weight of the evaluation index, the game aggregation model was used to obtain two sets of index weight vectors (u j) by AHP and the entropy method. A basic weight set can be expressed as U = {u 1, u 2, u 3,…., u i}. A possible set of weights was constructed by constituting the arbitrary linear combination of i vectors:
 $$U = \sum\limits_{k = 1}^i {a_ku_k^T}, \,\,\left( {a_k \gt 0} \right)$$
where u is a possible weight vector in the set U, and a k is the weight coefficient.
According to the concept of game theory, it must contain the most satisfactory weighting vector  $u_k^* $ in these possible weight vector sets, which could be obtained by minimizing the deviation between u and u k. Thus, the countermeasure model was deduced as follows:
 $$\min \left\Vert {\sum\limits_j^i {(a_j \times u_j^T )}} \right\Vert _2, \; \left( {i = 1,\,2,\,3, {\ldots}, n} \right)$$
Based on the differential characteristics of the matrix, the equivalent linear simultaneous equations of the optimal derivative conditions were:
 $$\eqalign{& \left[ {\matrix{ {u_1 \times u_1^T} & {u_1 \times u_2^T} & {u_1 \times u_3^T} & {\cdots} & {u_1 \times u_n^T} \cr {u_2 \times u_1^T} & {u_2 \times u_2^T} & {u_2 \times u_3^T} & {\cdots} & {u_2 \times u_n^T} \cr {u_3 \times u_1^T} & {u_3 \times u_2^T} & {u_3 \times u_3^T} & {\cdots} & {u_3 \times u_n^T} \cr \vdots & \vdots & \vdots & \vdots & \vdots \cr {u_n \times u_1^T} & {u_n \times u_2^T} & {u_n \times u_n^T} & {\cdots} & {u_1 \times u_n^T} \cr}} \right]\left[ {\matrix{ {a_1} \cr {a_2} \cr {a_3} \cr \vdots \cr {a_n} \cr}} \right] \cr &= \left[ {\matrix{ {u_1 \times u_1^T} \cr {u_2 \times u_2^T} \cr {u_3 \times u_3^T} \cr \vdots \cr {u_n \times u_{\rm n}^T} \cr}} \right]}$$
The weight coefficient a 1, a 2, …, a n was computed using Eqn (11) and normalized according to the following Eqn (12):
 $$a_{k}^{\ast} = \displaystyle{{a_k} \over {\sum\nolimits_{k = 1}^n {a_k}}} $$
Lastly, the final comprehensive weight was obtained as follows:
 $$u^{\ast} = \sum\limits_{k = 1}^i {(a_k^{\ast} \times u_k^T )} $$
Technique for Order of Preference by Similarity to Ideal Solution
The TOPSIS method is an effective method for solving multi-index, multi-objective decision-making problems (Sindhu et al., Reference Sindhu, Nehra and Luthra2017; Zyoud and Fuchs-Hanusch, Reference Zyoud and Fuchs-Hanusch2017). The method evaluates mainly by forming a decision matrix, and then the decision matrix is normalized and calculated by multiplying the weights. Then, to determine the positive ideal solutions and negative ideal solutions, the former allows maximization of benefit attributes and minimization of cost attributes while the latter minimizes benefit attributes and maximizes cost attributes. Lastly, according to the values of closeness coefficients, the relative closeness coefficients and ranking of options are obtained. The best solution will be closest to the positive-ideal-solution and furthest from the negative-ideal-solution (Roghanian et al., Reference Roghanian, Rahimi and Ansari2010).
Let us suppose that there are n possible alternatives A i(i = 1,2,3,…, n), and each alternative has m attributes C j(j = 1,2,3,…, m). The specific calculation steps are as follows:
(1) Construct a decision matrix:
(15) $$D = (y_{ij})_{n \times m}$$
(2) The normalized decision matrix is obtained by vector processing:
(16)$$Z = (z_{ij})_{n \times m} = \displaystyle{{y_{ij}} \over {\sum {y_{ij}}}} \times 100\% $$(3) Construct the weighted normalized matrix X as:
(17)where$$X = (x_{ij})_{n \times m}$$$x_{ij} = \omega _{ij}z_{ij},\matrix{ {} & {i = 1,2,3, \ldots, n;\,\,i = 1,2,3,\, \ldots, n, \,\,\,j = 1,2,3,\, \ldots, m} \cr} $(4) Determine the positive ideal solutions x+ and the negative ideal solutions x– as shown in the following equations:
(18)$$x^ + = \left\{ {x_1^ +, x_2^ +, x_3^ +, \ldots, x_m^ +} \right\} = \left\{ {\matrix{ {\max} & {x_{ij}} \cr i & {} \cr}} \right\}$$(19)$$x^ - = \left\{ {x_1^ -, x_2^ -, x_3^ -, \ldots, x_m^ -} \right\} = \left\{ {\matrix{ {\min} & {x_{ij}} \cr i & {} \cr}} \right\}$$(5) Compute the Euclidean distance of each alternative from x+ and x–:
(20)$$d_i^ + = \sqrt {\sum\limits_{\,j = 1}^m {{\left( {x_{ij} - x_j^ +} \right)}^2}} $$(21)$$d_i^ - = \sqrt {\sum\limits_{\,j = 1}^m {{\left( {x_{ij} - x_j^ -} \right)}^2}} $$(6) Compute the relative closeness of each alternative A i(i = 1,2,3,…, n) to x+ and x–:
(22)$$A_i = \displaystyle{{d^ -} \over {d^ - + d^ +}} $$(7) Finally, calculate the order by the values A i.





Statistical analysis
The Aaahp 10.0 software and MS EXCEL were used to calculate the weight of each index. The optimal combination coefficient and normalized operation in the game theory were obtained using Matlab 7.0.4. and Design-Expert (6.0.8) software was used to build a model and perform the statistical analyses. A correlation analysis was conducted for the ranking of each treatment using SPSS 20.0.
Results
Weights of single indicators
According to the importance of the indicators, a judgement matrix was established to calculate the overall weight of the corresponding indicators. The results showed that the attributes were ranked based on their importance: Shannon–Weaver > invertase > Shannon evenness > urease > catalase > McIntosh index > Simpson diversity > phosphatase (Table 2).
Weights of single indicators

C 1, urease activity; C 2, invertase activity; C 3, phosphatase activity; C 4, catalase activity; C 5, Shannon–Weaver; C 6, Simpson diversity; C 7, Shannon evenness; C 8, McIntosh index; AHP, analytic hierarchy process.
The data matrix was constructed with all the measured data and the objective weight of each index was calculated by the entropy method. The current results showed that the weight of a single index was: Shannon evenness > McIntosh index > phosphatase > invertase > Simpson diversity > urease > Shannon–Weaver > catalase (Table 2). The weights determined by the entropy weight method and AHP method indicated that soil microbial functional diversity > soil enzyme activity, but some of the individual weights were different. Therefore, it was necessary to integrate the weights of the AHP and the entropy method.
According to the game weighting method given in the current paper, the following matrix was obtained:
 $$\left( {\matrix{ {0{\cdot}1421} & {0{\cdot}1250} \cr {0{\cdot}1250} & {0{\cdot}1251} \cr}} \right)\left( {\matrix{ {a_1} \cr {a_2} \cr}} \right) = \left( {\matrix{ {0{\cdot}1421} \cr {0{\cdot}1251} \cr}} \right)$$
Then the coefficients of the optimizing combination were obtained by using MATLAB: a 1 = 0.9942, a 2 = 0.0066.
According to Eqn (13), a 1 and a 2 were normalized:  $a_1^* = 0.9934$,
 $a_2^* = 0.0066$.
Lastly, the comprehensive weight was obtained by Eqn (14).
It can be seen from the game theory weight in Table 2, the weight of Shannon–Weaver was the highest (0.194), and that of phosphatase (0.054) was the lowest. The final weight of indicators was as follows: Shannon–Weaver > invertase > Shannon evenness > urease > catalase > McIntosh index > Simpson diversity > phosphatase. This result indicated that the soil microbiological indicators had a higher criteria weight than soil enzyme activity indicators.
Technique for order of preference by similarity to ideal solution method
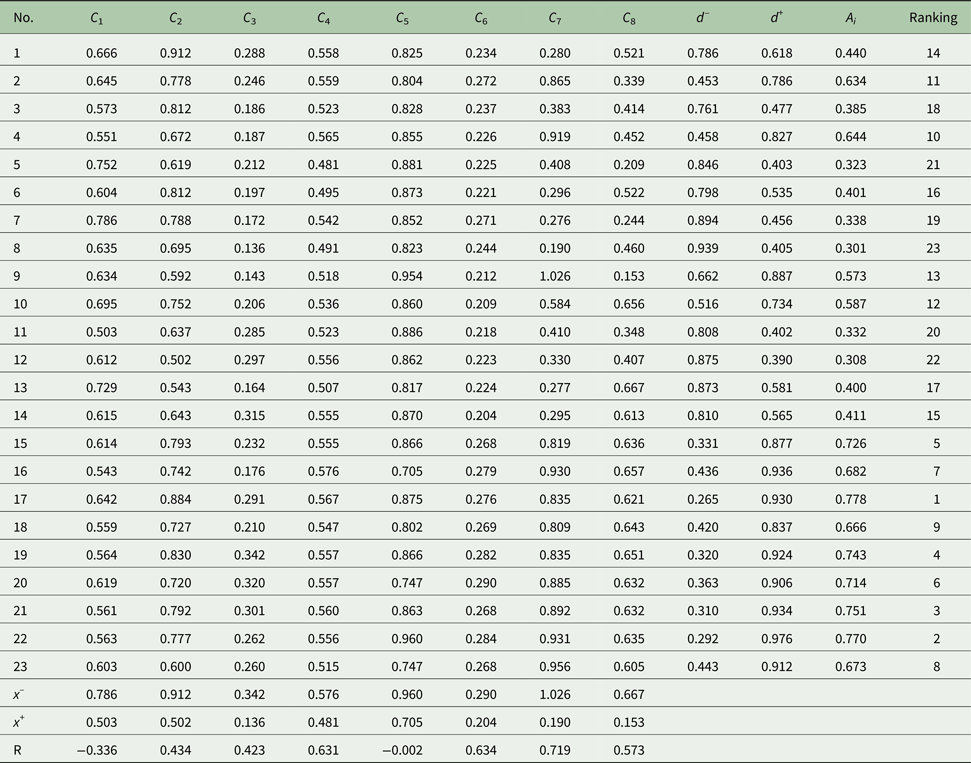
A S pearman ranking correlation analysis was performed between the comprehensive values and single attributes. The ranks of catalase, Shannon index, substrate evenness and McIntosh index were correlated positively with the comprehensive values. However, the ranks of the other indices were correlated negatively with those of the comprehensive values (Table 3). The proportions of negative and positive correlation coefficients were 0.25 and 0.75, respectively. In addition, 0.75 of the positive attributes showed significant correlation coefficients, indicating that the comprehensive value ranks were consistent with single index ranks. The comprehensive values were reliable and can represent soil microbial functional diversity and enzyme activity.
Comprehensive index and its rank based on TOPSIS

C 1, urease activity; C 2, invertase activity; C 3, phosphatase activity; C 4, catalase activity; C 5, Shannon–Weaver; C 6, Simpson diversity; C 7, Shannon evenness; C 8, McIntosh index. A i means the relative closeness; x+ and x– are the optimal and inferior ideal solutions, respectively; d+ and d– are the weighted distances between each alternative and the optimal or inferior ideal solutions, respectively; R means the Spearman correlation coefficient between comprehensive values rank and single index rank (P < 0.05).
Model validation
The quadratic polynomial fitting of soil comprehensive values was conducted. This fitting can be obtained by the relationship between the horizontal coding value ([–1.682, 1.682]) and the soil comprehensive values y. The second-order polynomial equation is shown as:
 $$\eqalign{y & = 0{\cdot}72 + 0{\cdot}052A + 0{\cdot}012B - 0{\cdot}038C - 5{\cdot}000E - 003AB \cr &- 0{\cdot}051AC - 6{\cdot}250E - 003BC - 0{\cdot}047A^2 - 0{\cdot}14B^2 - 0{\cdot}11C^2} $$
where y is the response variable, and A, B and C are the independent variables of straw length (cm), straw amount (g/m2) and straw burial depth (cm), respectively.
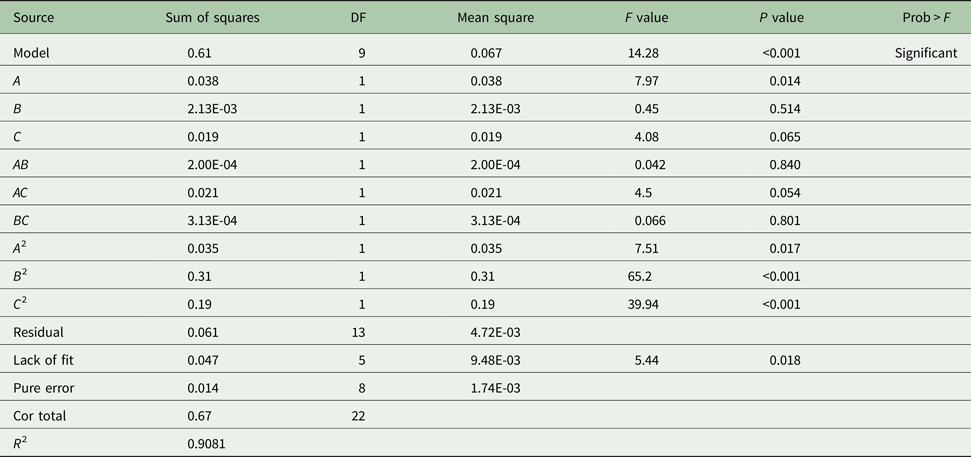
The model F value of 14.28 implied that the model was significant. There was only a 0.01% chance that a model F value this large could occur due to noise, indicating a high degree of significance and the model was fitted with a good prediction (Table 4). The P value for lack of fit (P = 0.018) was not significant at P < 0.01. This result showed that unknown factors affected the experimental results slightly, and that the regression model was relatively suitable. Therefore, this model can be used to evaluate the effects of single factors on soil comprehensive values.
Analysis of variance for quadratic model

A, straw length; B, straw amount; C, straw burial depth; DF, degrees of freedom; R 2, coefficient of determination.
Effects of single factors on soil comprehensive values
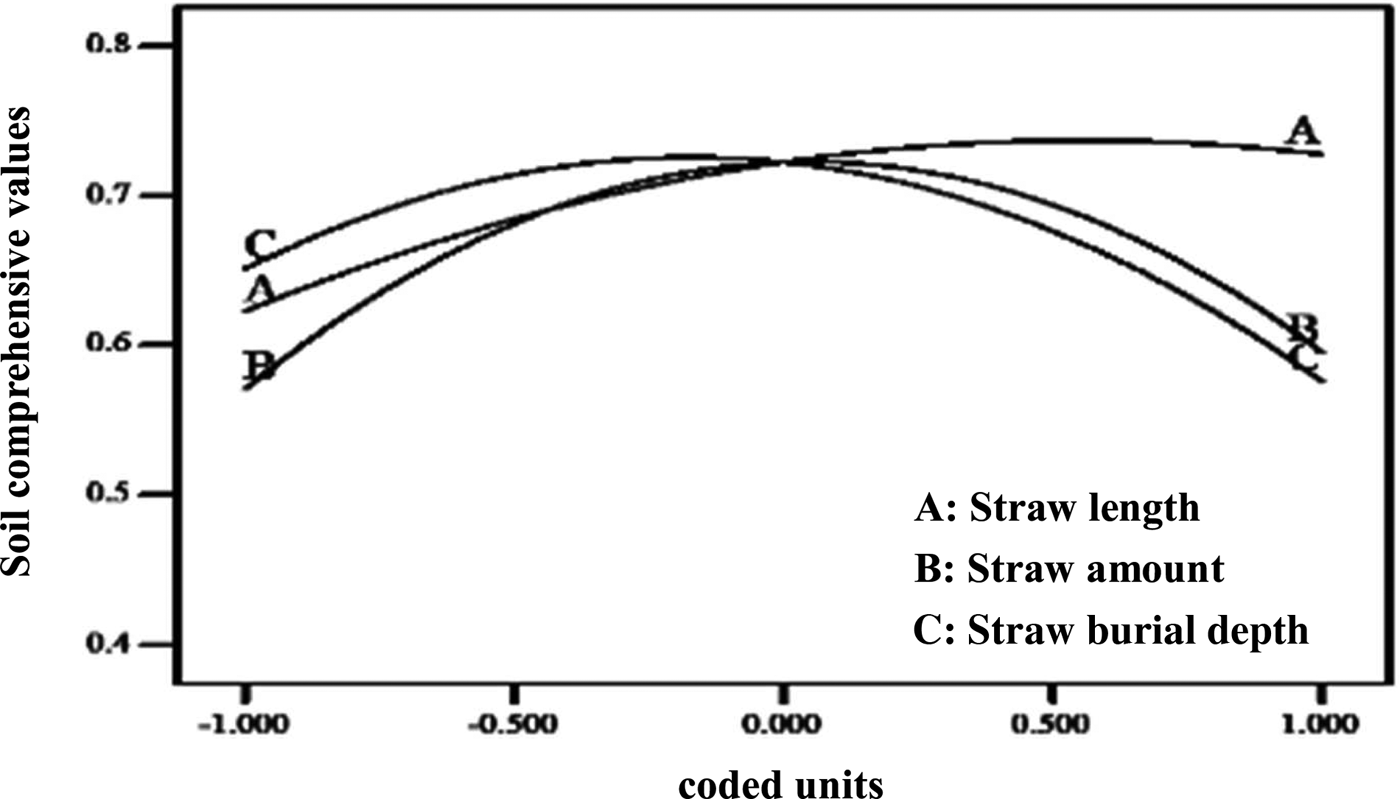
The convex quadratic curve was presented between the comprehensive index and single factors. When three factors were low, the dominant effect of straw burial depth (C) was higher than straw amount (B) and straw length (A). The main effect of straw length increased with further increases of the three factors. The negative effects were showed by straw burial depth and straw amount. However, the straw length became the dominant factor. According to the absolute value of the standardized regression coefficient, the relative magnitude of the effects of straw length, burial depth and amount on soil comprehensive values was straw length > straw burial depth > straw amount.
Soil comprehensive values increased with an increase in straw length and amount at levels below 0 (straw length 15 cm, amount 480 g/m2 and burial depth 15 cm). However, when straw length and amount levels were above 0 (straw length 15 cm, amount 480 g/m2 and burial depth 15 cm), soil comprehensive values presented a slowly decreasing trend (Fig. 2). In addition, with increasing burial depth, soil comprehensive values gradually increased and then gradually decreased, with a maximum value at the 0 level (burial depth 15 cm) of burial depth.
Effects of test factors on soil comprehensive values.

The interaction effect of two factors on soil comprehensive values
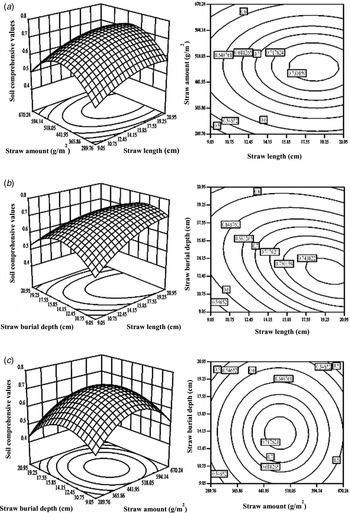
The combined effect of straw length and straw burial depth on the surface area is shown in Fig. 3(a). The results demonstrated that straw length and burial depth have great influence on the soil comprehensive index. A significant negative interaction (P < 0.01) was reflected between them with increasing straw length and burial depth (Table 4): increases in straw length and burial depth led firstly to a significant increase then a decrease in surface area. The maximum surface area was shown to be at a burial depth of 8–17 cm and straw length of 13–25 cm.
Response surface and contour plots for the comprehensive values as a function of the interaction between factors: straw amount, straw length, straw burial depth.

Increasing straw length and amount caused an increase in the response values to a maximum at a straw amount of 399–596 g/m2 and straw length of 13–22 cm, but they decreased with further increases in length and amount (Fig. 3(b)). There was no significant interaction between straw length and straw amount (Table 4).
By increasing the straw burial depth and amount, the response values also increased and reached a maximum of 0.778. Then, they decreased with further increases in straw burial depth and amount (Fig. 3(c)). The shape of the ellipse appeared to be in the centre, indicating that the interaction between the length and amount was not obvious (Table 4).
Discussion
Application of mathematical method
In the current study, AHP, the entropy weight method and game theory were used to determine single attribute weight and comprehensive values. The results showed that soil microbiological indicators had a higher criteria weight than soil enzyme activity indicators, indicating that soil enzymes derived from soil microbes to some degree, and the soil microorganisms themselves reflected the variability and functional transformation of biological groups in the soil. This result was consistent with the previous studies (Frankenberger and Dick, Reference Frankenberger and Dick1983; Tabatabai, Reference Tabatabai and Weaver1994). In the process of determining the weight, game theory was used in conjunction with AHP and the entropy method, which makes the weight of the indicators more objective and accurate and effectively avoids the subjectivity of AHP and the absolute objectivity of the entropy weight method.
In some previous studies, single indices were analysed separately as the effect and tendency of each index may be inconsistent. In addition, the information represented by each index overlapped, and did not accurately evaluate the comprehensive performance to a certain extent. In the current study, all single indicators were integrated into a comprehensive evaluation index by TOPSIS. The results showed that 0.75 of single indicators were correlated positively with the comprehensive index, indicating that the rank of the comprehensive index is suitable for many single indices. Soil comprehensive values can represent the soil microbial functional diversity and enzyme activity. At the same time, it can evaluate objectively and comprehensively the effects of the three factors during straw incorporation.
Many studies have been conducted in the field regarding the effects of straw incorporation on soil microbial functional diversity and enzyme activity. However, the research objects of these studies focused mainly on a certain aspect, rather than many aspects simultaneously. Thus, in the current paper, the quadratic orthogonal rotation test design compensated for this drawback.
Effects of soil enzyme activity and microbial functional community
In the present study, the effects of three factors on the comprehensive values were ranked as straw length > straw burial depth > straw amount, indicating that straw length is the most important factor affecting soil enzyme activity and microbial functional community. Straw length and burial depth had significant effects on the comprehensive values, and the interactions between them showed a significant effect on the comprehensive values. The interactions of straw length, burial depth and amount were negative, indicating they would reduce soil microbial diversity and enzyme activity if they exceeded the optimal range.
In general, a suitable straw amount and burial depth are the most important factors for soil microbial growth and enzyme activity. The suitable straw amount provides sufficient C for soil microbes to grow and reproduce, further stimulating soil microbial growth and enzyme activity (Zhao et al., Reference Zhao2016). However, an excessive amount of straw results in a direct increase in C : N ratios (Said-Pullicino et al., Reference Said-Pullicino2014), which affects the composition and structure of the soil microbial community (Liang et al., Reference Liang2017). The effects of organic amendments on the microbial activity are influenced by the composition of the organic amendment, particularly the C : N ratio (Heal et al., Reference Heal, Anderson, Swift, Cadisch and Giller1997). Plant residues with low C : N ratios decompose more rapidly and lead to higher N availability than high C : N residues (Hadas et al., Reference Hadas2004; Dannehl et al., Reference Dannehl, Leithold and Brock2017). The current results showed that the soil microbial functional diversity and enzyme activity were significant when the straw amount was 370–650 g/m2, but not above 650 g/m2. This may have been attributable to higher C : N ratios of crop residues (55 : 1–69 : 1), as the addition of straw to soil will lead to an increased soil C : N ratio (Said-Pullicino et al., Reference Said-Pullicino2014): although the amount of C available for microbes to use increases, there are not enough N sources, limiting the corresponding enzyme activity. The current results support earlier findings by Vigil and Kissel (Reference Vigil and Kissel1991), who showed that N could not satisfy microbial need when the C : N ratios of crop residues were >40. The current results also showed that the soil microbial functional diversity and enzyme activity were not significant for straw amounts below 370 g/m2, possibly because the unsuitable C : N ratio limited the growth of microorganisms, which agrees with the study by Said-Pullicino et al. (Reference Said-Pullicino2014).
Straw burial depth is also a major factor affecting microbial functional diversity and enzyme activity (Yang et al., Reference Yang2016). At a burial depth of 10–17 cm, soil microbial functional diversity and enzyme activity were significantly high. Incorporation of straw into the soil at this burial depth can increase the microbial population, and provide energy and a favourable environment for the accumulation of soil enzymes (Jiao et al., Reference Jiao2011; Zhao et al., Reference Zhao2016). For straw burial depths below 17 cm, soil microbial functional diversity and enzyme activity were not significant in the current study. The deeper that straw was buried, the worse the enzyme activity was. The main reason for the current result is that soil maturity, fertility and soil nutrient status are poor in deep soil, and it is not conducive to the activities and reproduction of microorganisms. For straw burial depth above 10 cm, soil aggregates are easily damaged, soil permeability is poor, and soil organic matter is lost easily in topsoil. The current study differs from previous observations (Ji et al., Reference Ji2014; Zhang et al., Reference Zhang2016b), perhaps due to climatic conditions, soil type, soil texture, straw types and residue incorporation methods. However, Wei et al. (Reference Wei2015) reported similar results to those of the current study.
Straw length affects the decomposition speed of straw cellulose and lignin, which increases the activity of soil microbes and various enzymes. In the current study, soil microbial functional diversity and enzyme activity were significantly enhanced at the straw lengths of 13–24 cm. Other researchers have provided much evidence that straw is more easily decomposed in this range (Hassink, Reference Hassink1997; Bending and Turner, Reference Bending and Turner1999; Zhang et al., Reference Zhang2016a). Organic matter in the soil increases and appropriate nutrients (especially N) contribute to the decomposition of straw and soil microbial community structure activity (Russell and Appleyard, Reference Russell and Appleyard1917; Silgram and Chambers, Reference Silgram and Chambers2002).
Based on the quadratic orthogonal rotation combination design, the current paper obtained an optimal combination of straw length, amount and burial depth treatments for the improvement of soil microbial growth and enzyme activity by model analysis. The optimal combination was straw length of 13–24 cm, straw amount of 370–650 g/m2 and burial depth of 10–17 cm. This may be due to provision by straw of adequate energy and indispensable nutrients for soil microbial growth in this range. The physical properties of soil can be improved, the abundance of soil microorganisms can be increased, and soil enzyme activity can be enhanced. These results will give a guideline for efficient straw incorporation to improve the soil microbial functional diversity and enzyme activity.
Conclusions
The single weight of the soil enzyme activity and microbial functional diversity was determined by AHP, the entropy weighting method and game theory, which indicated that soil microbiological indicators have a higher criteria weight than soil enzyme activity indicators. The comprehensive values were reliable, which can represent the soil microbial functional diversity and enzyme activity.
The main effects of three experimental factors on the comprehensive indicator are in the order straw length > straw burial depth > straw amount; soil microbial functional diversity and enzyme activity decreased with excessive input. The current study demonstrated that the straw length of 13–24 cm, burial depth of 10–17 cm and straw amount of 370–650 g/m2 were most effective for improving the soil microbial functional diversity and enzyme activity.
Acknowledgements
This current study is supported by the grants from the Science and Technology Achievements Transformation Fund Project of China (No.: 2013GB2B200134) and the Special Fund for Agro-scientific Research in the Public Interest (No.: 201503116-04).
Declaration of interest
None.