Introduction
Thanks to the high theoretical energy density (2576 W h/kg), lithium/sulfur (Li/S) batteries have been considered as one of the desirable energy storage systems [Reference Ji and Nazar1, Reference Arumugam, Yongzhu and Yu-Sheng2, Reference Ji, Lee and Nazar3]. Nevertheless, the practical applications of Li/S batteries still have several obstacles for practical use, such as low utilization of S caused by the insulation of S and the poor stability because of the dissolution and detachment of the soluble lithium polysulfides from the electrode during the reaction processes [Reference Hassoun and Scrosati4, Reference Vishnuvardhan, Kulkarni, Basavaraja and Raghavendra5, Reference Zhang, Bakenov, Zhao, Konarov, Doan, Malik, Paron and Chen6]. Many ways have been attempted to circumvent the above-mentioned problems. Among them, one of the effective ways is to introduce carbon materials to form the sulfur/carbon cathodes as a result of the obvious superior properties of carbon materials, including high surface areas, good electrical conductivity, excellent chemical stability, and superior affinity for sulfur within their porous bodies [Reference Xu, Xu, Fang, Peng, Fu, Huang, Li and Sun7, Reference Zhang, Zhang, Wang, Yin and Zhang8]. Thus, various nanostructured carbons, such as porous carbon [Reference Li, Tang, Hu, Zhang and Ding9], carbon nanotubes [Reference Guo, Xu and Wang10], graphene sheets [Reference Duan, Han, Huang, Li and Chen11], and graphene oxide sheets [Reference Zuo, Zhang, Hua, Ma, Du, Cheng, Gao and Yin12], are applied to composite with sulfur to obtain advanced composite cathode with good cycling performance.
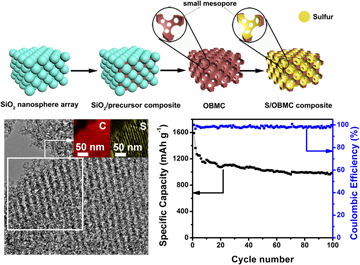
In our previous study, sulfur was supported on a kind of hierarchically porous carbon with ordered macropores and mesopores as a cathode, and it delivers 703 mA h/g at 0.2 C after 100 cycles. However, it has poor rate capability, which is due to the macropores that, although they can improve the mass transportation, cannot efficiently anchor the lithium sulfide. Reducing the size of macropores to mesoscale and then developing a kind of 3D ordered bimodal mesoporous carbons (OBMC) that have both mesopores and small mesopores may be a good response to the above challenges: the former could provide the fast travel way for solvated Li+ on charge/discharge, the latter are beneficial to hampering the diffusion of polysulfide species into the electrolyte [Reference Zhang, Zhao, Bakenov, Tuiyebayeva, Konarov and Chen13].
Generally, hierarchically carbon materials can be fabricated from a kind of dual template, which is a combination of both surfactants as soft templates and colloidal crystal (opal) as hard templates [Reference Cai, Zhou, Han and Guan14, Reference Li, Zheng, Feng, Lu, Zhao, Zheng, Zhang, Ji and Cao15, Reference Zhang, Xu, Shan, Sun, Chen and Yan16, Reference Wen17, Reference Zhang, Zhang, Yin, Zhang, Mentbayeva, Babaa, Molkenova and Bakenov18]. In this synthesis process, a large amount of surfactants were involved, and the synthesis commonly took dozens of hours to complete the assembly of the surfactants. Herein, we firstly demonstrate the preparation of a novel OBMC via a surfactant-free rapid method using SiO2 nanosphere array as shape-directing agents. The highly periodic arrays of uniform large mesopores of OBMC obtained from the accurate replication of SiO2 nanosphere array are favorable to the accessibility of the electrolyte and electrons transfer. The mesopore walls that consist of linked small mesopores are generated during carbonization process of phenolic resins (carbon sources) in the voids of the SiO2 opal. SiO2 template could restrict the shrinkage of phenolic resins and the small mesopores caused by the solvent removal could be maintained after the calcination process [Reference Li, Zheng, Feng, Lu, Zhao, Zheng, Zhang, Ji and Cao15, Reference Tian-Yi, Lei and Zhong-Yong19]. The small mesopores can reduce the migration of polysulfide species into the electrolyte and, thus, achieve high electrochemical stabilities of the electrode materials [Reference He, Ji and Nazar20]. By making full use of the unique hierarchical mesostructure, we have realized the S/OMBC composite cathode with excellent electrochemical performance, tested in Li/S batteries.
Results and discussion
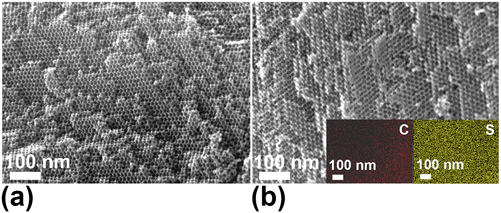
Figure 1(a) shows an SEM image of OBMC prepared from the SiO2 template. From the image, 3D ordered mesoporous structure can be clearly observed. Figure 1(b) presents an SEM image of S/OBMC, and it can be seen that the ordered mesoporous structure is still maintained and some parts of the surface of OBMC are covered by sulfur, suggesting that some sulfur is not deposited in the pores of carbon. The EDS element mapping images of the S/OBMC [inset of Fig. 1(b)] show that sulfur is deposited on the OBMC.
SEM images of (a) OBMC and (b) S/OBMC. Inset of (b): EDS element mapping (C, S) of the S/OBMC.

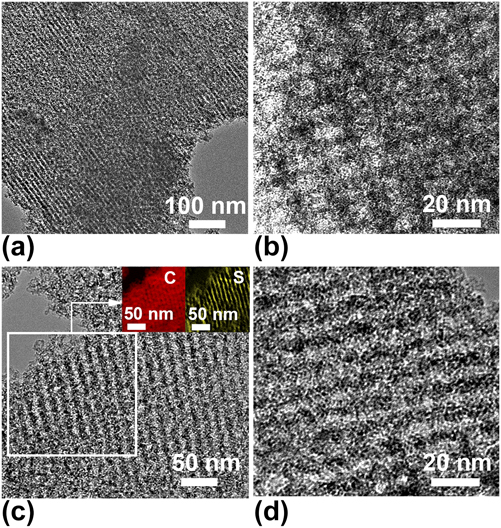
TEM is used to further characterize the porous structure of OBMC and S/OBMC. From the TEM image of OBMC [Fig. 2(a)], an ordered mesoporous structure with mesopore size of 15 nm can be clearly seen. And the TEM image with high magnification [Fig. 2(b)] demonstrates the presence of small mesopores (2–3 nm) on the mesoporous walls of OBMC. The possible mechanism for the formation of these small mesopores is as follows: during the carbonization process, resin polymer tends to shrink due to dehydration and solvent removal. However, there is an interaction between the resin polymer and the surface of silica spheres because both of them have a large number of hydroxyl groups. The intense interaction restricts the integral shrinkage of polymer [Reference Li, Zheng, Feng, Lu, Zhao, Zheng, Zhang, Ji and Cao15, Reference Dutta, Wu and Kimura21]. Thus, some closed small mesopores around silica spheres caused by the solvent removal or regroupment of nanosized microdomains are maintained because of the synergistic effect. The closed mesopores are opened after etching the silica nanospheres with HF solution [Reference Qiao, Song, Hong, Lim, Yoon, Korai and Mochida22, Reference Tang, Song, Tian, Liu and Guo23]. The small mesopores of OBMC are beneficial because they can hinder the dissolution of lithium polysulfides in the electrolyte during the cycling operation. From the TEM image of S/OBMC [Fig. 2(c)], it can be seen that ordered mesoporous structure still exists, which is in favor of mass transportation. The insets of Fig. 2(c) show the electron energy loss spectroscopy (EELS) mapping of S/OBMC, and the EELS mapping analysis indicates that C and S are homogeneously distributed in S/OBMC composite. Figure 2(d) is a high-magnification TEM image of S/OBMC, where the crystalline sulfur cannot be observed, showing that the sulfur in the pores is converted to amorphous sulfur.
(a) TEM image and (b) high-magnification TEM image of OBMC; (c) TEM image and (d) high-magnification TEM image of S/OBMC. Inset of (c): the corresponding EELS mapping image of S/OBMC.
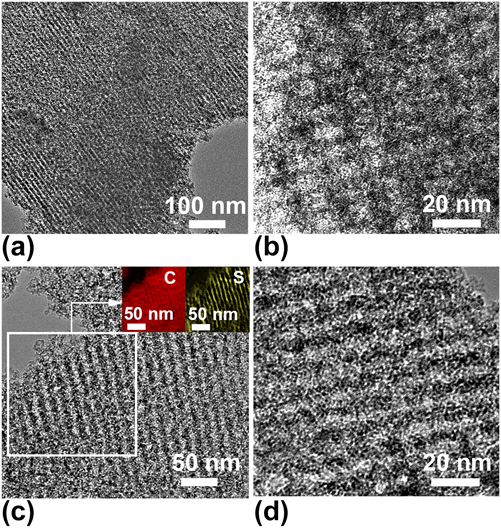
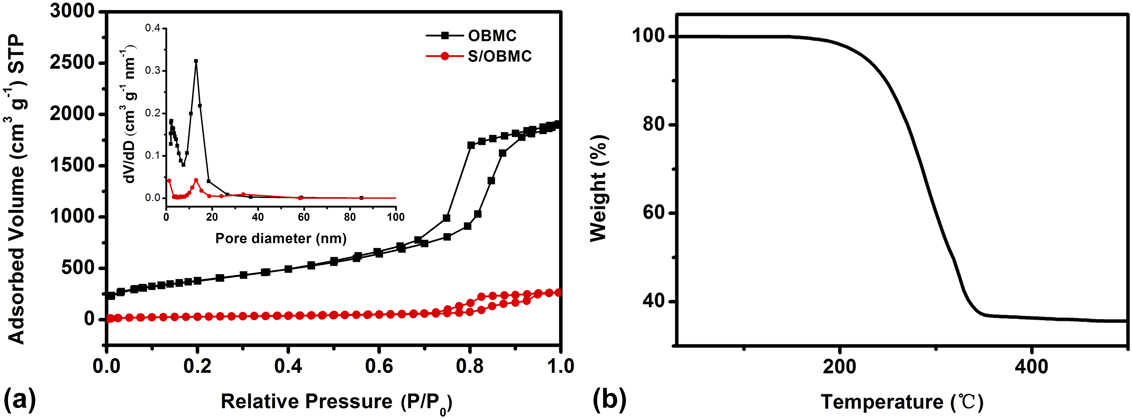
Figure 3(a) displays nitrogen adsorption/desorption isotherms for the OBMC and S/OBMC. The isotherms of OBMC is type IV, according to the IUPAC classification, and it is associated with an H1-like hysteresis loop in the relative pressure of 0.5–1.0, demonstrating the existence of mesopores. The BET surface area and pore volume of the OBMC were 1368.7 m2/g and 2.94 cm3/g, respectively. After the sulfur was deposited, the BET surface area and pore volume of S/OBMC were 94 and 0.40 cm3/g, respectively, much smaller than those of the OBMC because a lot of sulfur was deposited on OBMC. The pore size distribution (PSD) curves [inset of Fig. 3(a)] of OBMC and S/OBMC measured using the Barrett–Joyner–Halenda (BJH) method from the adsorption isotherm display two narrow peaks at 13 and 2.3 nm, which are associated with the large mesopores obtained from the SiO2 nanospheres and small mesopores on mesoporous walls of OBMC, respectively. Since the BJH model is more suitable for cylindrical mesopores than cage-like structure, the large mesopore size of OBMC is slightly smaller than that of the SiO2 nanospheres [Reference Wei, Snyder, Sandeep, Pyung-Soo, Won Cheol, Mccormick, Penn, Andreas and Michael24]. Moreover, the pore volumes of large mesopores, small mesopores, and micropores calculated by BJH method were 1.84, 0.93, and 0.04 cm3/g, respectively, indicating that large mesopore walls were bridged by small mesopores instead of micropores. The PSD curve of S/OBMC also shows a narrow peak around 13 nm, showing that some of the large mesopores were preserved, agreeing with the TEM results. Figure 3(b) shows TGA curve of S/OBMC, where one major mass loss which occurred at 180–350 °C can be seen, corresponding to the evaporation of sulfur. Therefore, the actual sulfur loading in the composite is evaluated as 63.6 wt%, which is our basis for the current densities in the electrochemical experiments.
(a) Nitrogen adsorption–desorption isotherms and PSD curves (inset) for the OBMC and (b) S/OBMC and TGA curve of the S/OBMC composite.

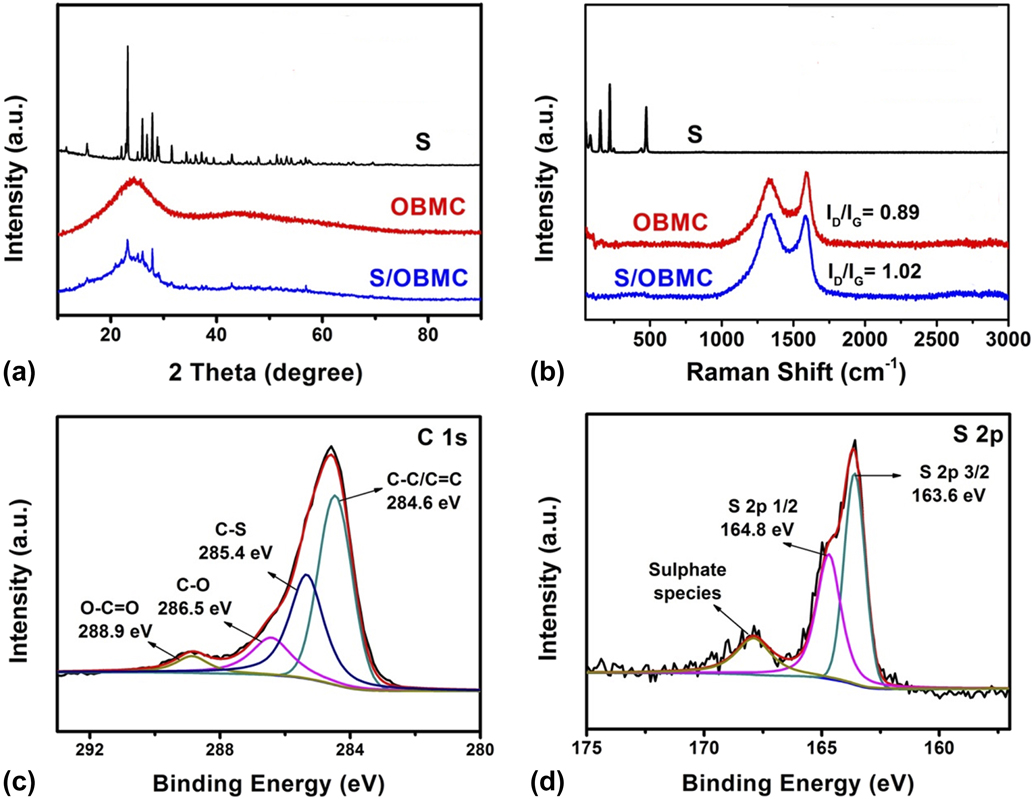
XRD [Fig. 4(a)] was used to evaluate the characteristic features of sulfur, as-prepared OBMC, and S/OBMC samples. All of the diffraction peaks on the XRD spectrum of S are well matched with the crystalline sulfur. There are two broad peaks located at 2θ = 24° and 44°, corresponding to the graphitic-type lattices of carbon. Partially graphitized structure could enhance the electrical conductivity of carbon, which favors the rate capability of battery. S/OBMC shows the XRD pattern with both the characteristic features of carbon and sulfur, but sharply reduced peak intensity, suggesting that the crystalline sulfur most likely transformed into amorphous sulfur and some of crystalline sulfur still exists. To further investigate the structure of samples, the Raman spectra of S, OBMC, and S/OBMC is presented in Fig. 4(b). The spectra of S shows three peaks at 150, 215, and 470 cm−1, which are associated with the solid sulfur [Reference Li, Wang, Gao, Li, Cai, Li, Peng, Huo and Chu25]. Raman spectra of OBMC exhibit two peaks at round 1340 and 1590 cm−1, which correspond to the D-band and G-band, corresponding to disorders and graphitic orders in carbon, respectively. G line of OBMC suggests the graphitized phase of OBMC [Reference Zhang, Hu, O’Hare, Wu and Sun26, Reference Yang, Ni, Cheng, Wang, Wang, Guan, Zhang, Wu, Li and Wang27]. The I D/I G (the relative intensity of the two lines) indicates the degree of long-range order in carbon. The I D/I G of S/OBMC (1.02) is higher than that of the OBMC (0.89), which indicates more disordered graphite-like structure of OBMC after loading sulfur. From the spectra of S and S/OBMC, it can be seen that the peaks of crystalline sulfur disappeared after sulfur incorporation, indicating that most of sulfur within the carbon is amorphous.
(a) XRD patterns of the OBMC, S, and S/OBMC composite, (b) Raman spectra of S, OBMC, and S/OBMC composite, and XPS of carbon (c) and S (d) of the S/OBMC composite.

XPS was used to further study the changes in the surface composition of S/OBMC. The XPS C 1s spectrum (Fig. 4(c)) of S/OBMC can be divided into the following four groups: O–C=O, C–O, C–S, and C–C/C=C bonds. The C–S bonds (285.4 eV) suggest that the sulfur is not simply physically adsorbed on the carbon surface [Reference See, Jun, Gerbec, Sprafke, Wudl, Stucky and Seshadri28]. The XPS S 2p spectrum (Fig. 4(d)) can be divided into two components including S 2p 3/2 peak (163.6 eV) and S 2p 1/2 peak (164.8 eV). The binding energy of S 2p 3/2 peak is a little lower than that of elemental sulfur (164.0 eV), showing the probable existence of C–S species. In addition, there is a weak peak located at around 165–170 eV, which is assigned to the sulfur oxide.
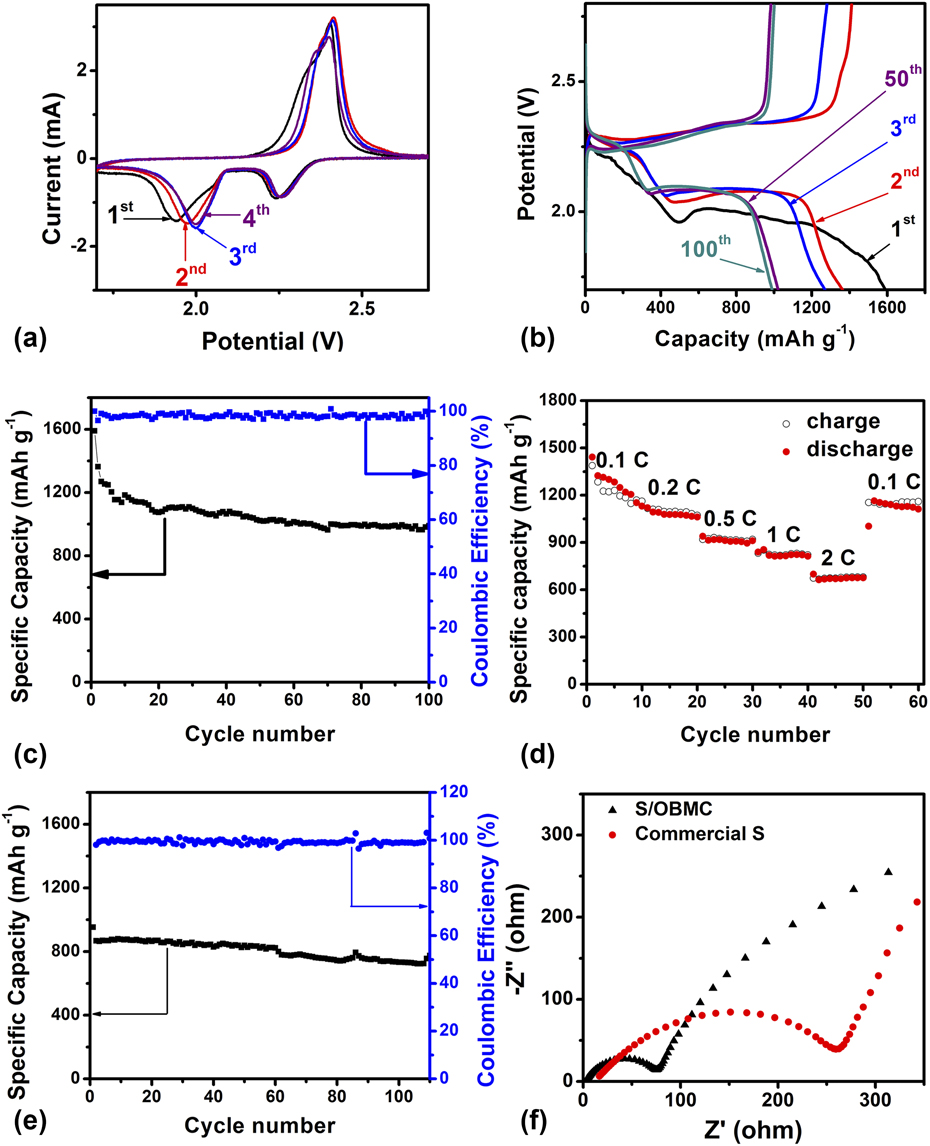
Figure 5(a) shows CV curves of S/OBMC composite cathode for the initial four cycles. The electrochemical reactions of sulfur with Li+ are as follows:
 $${{\rm{S}}_8} + 2{\rm{Li}} \to {\rm{L}}{{\rm{i}}_2}{{\rm{S}}_8}\quad ,$$
 $${\rm{L}}{{\rm{i}}_2}{{\rm{S}}_8} + 2{\rm{Li}} \to 2{\rm{L}}{{\rm{i}}_2}{{\rm{S}}_4}\quad ,$$
 $${\rm{L}}{{\rm{i}}_2}{{\rm{S}}_4} + 2{\rm{Li}} \to 2{\rm{L}}{{\rm{i}}_2}{{\rm{S}}_2}\quad ,$$
 $${\rm{L}}{{\rm{i}}_2}{{\rm{S}}_2} + 2{\rm{Li}} \to 2{\rm{L}}{{\rm{i}}_2}{\rm{S}}\quad {\rm{.}}$$
Electrochemical performances of S/OBMC: (a) CV curves at a scan rate of 0.1 mV/s, (b) charge/discharge curves at 0.2 C, (c) cycling performance at 0.2 C, (d) rate capability at different C rates, (e) cycling performance at 1 C and (f) EIS of the Li/S cell with S/OBMC and commercial S cathodes before discharge.

At first cathodic scan, two peaks located at 2.2 and 1.9 V are observed. The former corresponds to the formation of long-chain lithium polysulfides (Li2Sn, 4 ≤ n ≤ 8) [Eqs. (1) and (2)], and the latter is related to short-chain insoluble lithium sulfides (Li2S2 or Li2S) [Eqs. (3) and (4)]. The anodic peak at 2.4 V is associated with the oxidation of Li2S and Li2S2 to Li2S8 [Reference Scrosati, Hassoun and Sun29, Reference Yang, Yu, Cha, Wu, Vosgueritchian, Yao, Bao and Cui30]. After the first cycle, the cathodic peaks shift slightly, due to the activation process. For the following cycles, the electrode revealed excellent stability, an indication of high reversibility of the cathode reactions.
Figure 5(b) depicts the galvanostatic charge/discharge voltage profiles of S/OBMC composite cathode at 0.2 C. For the first cycle, two plateaus at around 2.2 and 1.9 V are observed, which have been proved typically in sulfur composites, indicating a two-step lithiation process of sulfur during discharge [Reference Pongilat, Franger and Nallathamby31]. The discharge plateau is shifted to higher voltage after the initial cycle due to the activation process at the initial cycling process, agreeing with the CV results [Reference Zhu, Yang, Zhao and Zhao32].
Figure 5(c) shows the cycling performance of S/OBMC cathode. S/OBMC displays a large initial discharge capacity value of 1590 mA h/g which was maintained at 989 mA h/g after 100 cycles at 0.2 C. Moreover, Fig. 5(c) also demonstrates a good coulombic efficiency for the S/OBMC composite cathode in the range of 97–100%, suggesting that significant amount of mesopores from OBMC effectively immobilized sulfur by strong physical absorption.
As shown in Fig. 5(d), the rate capability of the S/OBMC composite cathode is further evaluated, giving a reversible capacity of 1313 mA h/g, 1090 mA h/g, 919 mA h/g, 818 mA h/g, and 667 mA h/g for 0.1, 0.2, 0.5, 1, and 2 C rates, respectively. Furthermore, a large capacity value of 1154 mA h/g at 0.1 C can be retained after cycling at high C rate, suggesting the excellent high-rate property of the S/OBMC composite. The superior rate ability is thanks to their stable 3D framework with ordered large mesopores, which provides larger sulfur entities of contact regions, keeping the stability of the structure of S cathode and enhancing the electrochemical activity of the cathode.
To further verify the outstanding rate performance of S/OBMC, the galvanostatic charge–discharge cycling was carried out at 1 C. From Fig. 5(e), it can be seen that S/OBMC cathode delivers a discharge capacity of 733 mA h/g at 100th cycle. Furthermore, the coulombic efficiency has remained at about 99% during the cycling process, indicating an outstanding cycling performance of the S/OBMC cathode. The superior rate performance is due to small mesopores on the mesoporous walls of OBMC that is beneficial to the absorption of the polysulfides and the large mesopores that facilitate the sulfur infiltration and enhance the electrical conductivity of insulate sulfur.
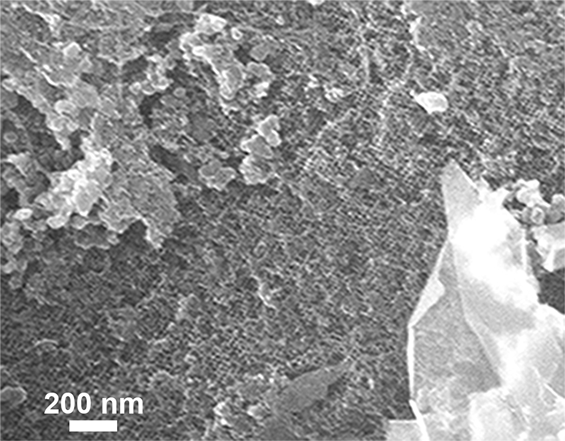
SEM image of S/OBMC cathode material after 100 cycles.

The electrochemical impedance spectroscopy (EIS) was applied to investigate the effect of the OBMC on the electrical conductivity of the cathode. As can be observed from Fig. 5(f), both Nyquist plots for S/OBMC and pure S present one typical semicircle in the high-to-medium frequency followed by an inclined line in the low frequency. The semicircle is assigned to the charge transfer impedance occurring between the active materials and liquid electrolyte. The inclined line could be ascribed to the lithium ions diffusion into electrode materials or Warburg diffusion. Obviously, the diameter of the semicircle of S/OBMC composite is much smaller than that of pure S, revealing that the S/OBMC shows an enhanced electron and ionic conductivity compared with S. Figure 6 is an SEM image of S/OBMC cathode after cycles. Apart from remaining a conductive agent and binder, it can be seen that ordered mesoporous structure of carbon over micrometers length scale is still maintained, demonstrating a stable structure of OBMC support.
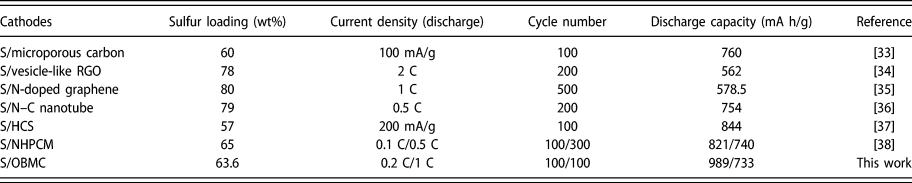
To evaluate the electrochemical performance of S/OBMC composites, a comparison with other reported S/C composite is shown in Table I. It can be seen that the electrochemical performance of S/OBMC is better than or comparable to that of the reported S/C cathode, suggesting that the S/OBMC would be a promising cathode for Li/S batteries.
Comparison of electrochemical performances of S/C cathodes.

Conclusions
This work reveals that 3D OBMC synthesized via a surfactant-free rapid method using SiO2 nanosphere arrays is a good host for sulfur in Li/S batteries. When tested in the battery, the S/OBMC composite materials show high reversible charge/discharge capacity and good cyclic capability as well as excellent rate performance. The superior battery performance is attributed to the unique 3D framework with ordered large mesopores that facilitate good transport of electrons and small mesopores that suppress the diffusion of polysulfide species. These results demonstrate that the OBMC plays an important role in enhancing the electrochemical performance of Li/S batteries.
Experimental section
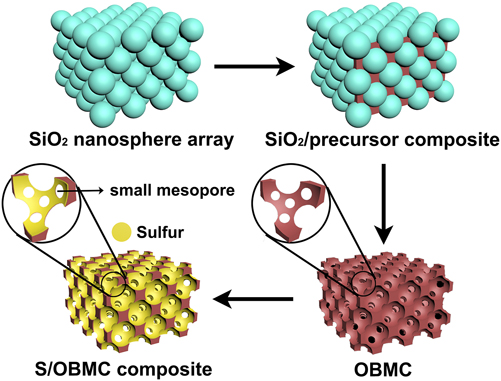
Scheme 1 presents the main pathway for creating the S/OBMC. The detailed method is described as follows:
Schematic of the synthesis of the S/OBMC.

Preparation of OBMC: Monodisperse SiO2 nanospheres (∼15 nm) were firstly synthesized following the modified Stöber method [Reference Wei, Snyder, Sandeep, Pyung-Soo, Won Cheol, Mccormick, Penn, Andreas and Michael24, Reference Snyder, Alex, Davis, Scriven and Michael39]. The resulting SiO2 nanosphere suspension was then poured into a flat beaker and maintained at 40 °C in an air incubator for 3 days to evaporate the water. The SiO2 monoliths consisting of 3D ordered SiO2 nanospheres were obtained after the complete evaporation of water. To fabricate the OBMC, phenolic resol precursor for use as a carbon source was prepared by a previously reported method [Reference Yan, Dong, Fuqiang, Yifeng, Haifeng, Zheng, Chengzhong, Bo and Dongyuan40]. A piece of SiO2 monolith was immersed in an resol ethanol solution (50 wt%) for 1 h. The precursor-filled SiO2 monolith was carefully transferred to a clean Petri dish and dried at 25 °C for 2 h. The dried sample was heated in an air incubator for 24 h at 100 °C and then heated again in N2 at 900 °C for 2 h to carbonation (heating rate was 5 °C/min). At the end, the OBMC was obtained after the SiO2 template was etched with HF solution for 1 day.
Preparation of S/OBMC: 1 g of sulfur powder was first dissolved in 1 g of CS2 solution, and 0.5 g of OBMC sample was added in the above solution by an ultrasound method. Then, the mixed solution was ultrasonicated for 2 h followed by a heating process in a nitrogen-filled reactor at 150 °C for 10 h. Finally, the sample was dried at 70 °C under vacuum overnight and S/OBMC was obtained.
Material characterization
Morphologies of OBMC and S/OBMC were obtained by field emission scanning electron microscopy (SEM; Nova Nano SEM 450, FEI, Hillsboro, Oregon) and transmission electron microscopy (TEM; JEM-2100F, JEOL, Tokyo, Japan). X-ray diffractometer (XRD; Rigaku3014, Rigaku Corporation, Tokyo, Japan) measurements were taken with Cu Kα radiation. Thermogravimetric analysis (TGA) was performed using a SDT Q-600 instrument (SDT Q-600, TA Instruments, New Castle, Delaware). X-ray photoelectron spectroscopy (XPS) analyses were carried out using a KRATOS Axis Ultra photoelectron spectrometer (Manchester, U.K.).
Electrochemical measurements
To prepare the sulfur cathode, the S/OBMC composite, acetylene black, and PVDF binder with a mass ratio of 80:10:10 were dispersed in N-methyl-2-pyrrolidinone (NMP) solution. The above ink was evenly brushed on an aluminum foil, which was dried in oven at 60 °C overnight and then was cut into disks (1.5 cm in diameter). The mass of S/OBMC on every disk was about 2.5 mg.
An aluminum foil as the working electrode, a microporous polypropylene sheet (Celgard 2400, Celgard Inc., Charlotte, North Carolina) as the separator, and a piece of lithium metal as the anode were assembled in coin cell 2025 in a glove box (M. Braun Inertgas-Systeme GmbH, Garching bei München, Germany). The electrolyte was prepared by dissolving 1 M bis(trifluoromethane) sulfonamide lithium salt (LiTFSI) in a mixed solution of dimethoxy ethane (DME) and 1,3-dioxolane (DOL) (1:1 v/v) with 1 wt% LiNO3. The coin cells were charged and discharged in the voltage range of 1.7–2.8 V (versus Li/Li+) on a battery tester (Neware Technology Inc., Shenzhen, China). The electrochemical performance was conducted on an electrochemical workstation (VersaSTAT 4, Princeton Applied Research, Oak Ridge, Tennessee). Cyclic voltammetry (CV) tests were performed at a sweeping rate of 0.1 mV/s. The electrochemical impedance spectra (EIS) were obtained in the frequency range of 100 kHz–0.01 Hz.
Acknowledgments
This work was supported by the grant of National Natural Science Foundation of China (21606068), Natural Science Foundation of Tianjin of China (17JCQNJC06300), and Natural Science Foundation of Hebei Province of China (B2016202140).