Introduction
Aphids often have complex life cycles. In around ten percent of cases, these may involve host alternation between a secondary herbaceous host where asexual (apomictic (=mitotic) parthenogenetic) reproduction occurs throughout the spring and summer months, and a sexual phase, whereupon winged autumn migrants (males and pre-sexual females=gynoparae) return to a primary woody host, attracted by visual and odour host plant cues (Eastop, Reference Eastop, Stone and Hawksworth1986; Pettersson et al., Reference Pettersson, Tjallingii, Hardie, van Emden and Harrington2007; Pickett & Glinwood, Reference Pickett, Glinwood, van Emden and Harrington2007). Such host alternation is thought to have evolved during and after the Cretaceous period when herbaceous plants radiated in northern temperate regions, allowing aphids, hitherto confined to gymnosperms, to exploit new available plant resources (Heie, Reference Heie, Leather, Watt, Mill and Walter1994). Once landed on the woody primary host (a potentially risky act, especially in terms of location of the perhaps locally rare and/or widespread host, e.g. see Ward et al., Reference Ward, Leather, Pickup and Harrington1998), the gynoparae produce sexual females (=oviparae) which mate with the males, the latter attracted by sex pheromones, and lay cold hardy overwintering eggs (Blackman, Reference Blackman, Blackman, Hewitt and Ashburner1980; Blackman & Eastop, Reference Blackman and Eastop1994, Reference Blackman and Eastop2000). Even during the asexual phase, perhaps comprising as many as 14 asexual generations, winged migrants, produced under conditions of stress (host senescence and crowding), seek out and land on new suitable secondary hosts (Dixon, Reference Dixon1998; van Emden & Harrington, Reference van Emden and Harrington2007). However, besides host alternating species, a majority of other species exist which remain on the host all year around (monophagous species), and in some of these, both sexual forms (males and oviparae) are wingless (see below), although such species still produce a number of asexual spring-summer generations, including winged asexual migrant females (Blackman & Eastop, Reference Blackman and Eastop1994, Reference Blackman and Eastop2000). Lastly, instances occur of obligate asexual morphs of certain species (e.g. Llewellyn, Reference Llewellyn2000; Simon et al., Reference Simon, Rispe and Sunncks2002) or obligate asexual species (Blackman & Eastop, Reference Blackman and Eastop1994, Reference Blackman and Eastop2000), which remain on their (usually) herbaceous hosts all year round and may survive even fairly cold winter conditions as live individuals (Bale et al., Reference Bale, Ponder, Pritchard, van Emden and Harrington2007).
Aphids are notorious as global pests of agriculture, horticulture and forestry, causing damage either directly or by transmission of one or more pathogenic plant viruses (Katis et al., Reference Katis, Tsitsipis, Stevens, Powell, van Emden and Harrington2007). During the asexual phase of reproduction, the number of asexual offspring produced by aphids, especially pest species, is prodigious and in theory at least, may reach huge numbers under ideal conditions, i.e. suitably warm climate and a dearth of predators, parasites and pathogens, especially entomopathogenic fungi (Völkl et al., Reference Völkl, Mackaeur, Pell, Brodeur, van Emden and Harrington2007). Thus, for example, in theory, a single asexual female aphid, during one growing season, could produce 7.6×1028 offspring, enough to cover the entire Earth's surface to a depth of around 150 km! (Harrington, Reference Harrington1994). It is has been suggested that such aphid ‘clones’ are probably not genetically identical over their entire genomes (Lushai & Loxdale, Reference Lushai and Loxdale2002; Loxdale & Lushai, Reference Loxdale and Lushai2003), and, indeed, empirical studies using both RAPD and AFLP molecular (DNA) markers have supported this conjecture and have shown aphid asexual lineages to be mutating, even within a very few generations (Lushai et al., Reference Lushai, Loxdale, Brookes, von Mende, Harrington and Hardie1997; Lushai et al., Reference Lushai, De Barro, David, Sherratt and Maclean1998; Forneck et al., Reference Forneck, Walker and Blaich2001; Vorwerk & Forneck, Reference Vorwerk and Forneck2007). However, for most practical purposes, aphid asexual lineages may be genotyped using high resolution molecular markers, especially microsatellites markers (Loxdale & Lushai, Reference Loxdale and Lushai1998), to provide ‘multilocus genotypes’ or MLGs (Loxdale & Lushai, Reference Loxdale, Lushai, van Emden and Harrington2007). Microsatellite markers have been shown to give stable MLG patterns over the course of a field study, with 6–12 loci failing to reveal additional new genotypes in trials where such markers have been tested (Haack et al., Reference Haack, Simon, Gautheir, Plantegenest and Dedryver2000; Massonnet, Reference Massonnet2002; Massonnet et al., Reference Massonnet, Simon and Weisser2002a); even so, other evidence suggests that microsatellites also mutate within asexual aphid lines, although, perhaps, over longer time scales than usually undertaken in field studies involving one or a few growing seasons (Wilson et al., Reference Wilson, Sunnucks and Hales1999).
During the summer migratory phase when winged aphid morphs migrate between herbaceous hosts including, in some aphid species, cereals and grasses, the air may be filled with a large number of different small winged insect species, as witnessed at lower altitudes (below the boundary layer of still air: Taylor, Reference Taylor1974) and as sampled at higher altitudes using static 12.2 m high suction traps (Harrington et al., Reference Harrington, Hullé, Plantegenest, van Emden and Harrington2007) or small suction traps or tow nets attached to balloons (Johnson, Reference Johnson1957). There is empirical support, both using direct capture and molecular ecological methods to estimate aerial movements, for long distance flights (Hardy & Cheng, Reference Hardy and Cheng1986), although there appears to be a large degree of species specificity involved in the actual ambit (range) of different aphid species, and some species are certainly predominantly short range fliers (see Loxdale & Lushai, Reference Loxdale, Lushai, van Emden and Harrington2007).
Following from earlier concepts of the so-called ‘aerial plankton’ (see Drake & Farrow, Reference Drake and Farrow1989) and the assumed natural asexual propagative abilities of aphids, it may be assumed that clones of particular species are both abundant and widespread, both aerially and terrestrially. Indeed, studies using molecular DNA markers (microsatellites and IGS=intergenic spacer regions of the ribosomal DNA cistron) have shown clones of certain aphids – for example, the Grain aphid Sitobion avenae (F.) and the Peach-potato aphid, Myzus persicae (Sulzer) – are indeed widespread (Llewellyn et al., Reference Llewellyn, Loxdale, Harrington, Brookes, Clark and Sunnucks2003; Fenton et al., Reference Fenton, Malloch, Woodford, Foster, Anstead, Denholm, King and Pickup2005) but that this may directly relate to adaptation of obligate asexual lineages of these species to particular plant hosts and/or climatic conditions under intensively cultivated agricultural conditions, for example in Chile, France, Scotland and Australia (Fenton et al., Reference Fenton, Woodford and Malloch1998, Reference Fenton, Kasprowicz, Malloch and Pickup2009; Haack et al., Reference Haack, Simon, Gautheir, Plantegenest and Dedryver2000; Vorburger et al., Reference Vorburger, Lancaster and Sunnucks2003a; Figueroa et al., Reference Figueroa, Simon, Le Gallic, Prunier-Leterme, Briones, Dedryver and Niemeyer2005; Vialatte et al., Reference Vialatte, Dedryver, Simon, Galman and Plantegenest2005; Kasprowicz et al., Reference Kasprowicz, Malloch, Pickup and Fenton2008; reviewed by Loxdale, Reference Loxdale2008a,Reference Loxdaleb, Reference Loxdale, Schön, Martens and van Dijk2009; Loxdale & Lushai, Reference Loxdale, Lushai, van Emden and Harrington2007). Sometimes the structuring of aphid populations in the field is related to the evolution and spread of insecticide resistant genotypes, including strains cross resistant to a number of chemicals targeting a range of specific physiological/metabolic sites, especially in M. persicae (reviewed by Foster et al., Reference Foster, Devine, Devonshire, van Emden and Harrington2007; Fenton et al., Reference Fenton, Margaritopoulos, Malloch and Foster2010). For most aphid species, especially non-pest species, indeed most insect species, the population genetic structure is hardly known or, more usually, completely unknown (Loxdale & Lushai, Reference Loxdale, Lushai, Woiwod, Reynolds and Thomas2001).
We are presently conducting a study using polymorphic microsatellite markers (Goldstein & Schlötterer, Reference Goldstein and Schlötterer1999) of the small spatial scale population genetic structure around Jena, Germany of two aphid species, Macrosiphoniella tanacetaria (Kaltenbach) (=MA) and Metopeurum fuscoviride Stroyan (=ME), specialists on Tansy (Tanacetum vulgare L.), a perennial herbaceous flowering plant of the aster family widespread in Europe and Asia and which prefers poor, well drained soils on wasteland. The plant occurs as presumed ‘genetically-identical’ genets, each comprising a number of shoots or ramets, and within a site, such as that found in Jena, tend to be widely distributed, growing in isolated clumps in favoured patches. Both aphid species have asexual and sexual generations on tansy, and, whilst M. tanacetaria produces winged asexual females which fly between plants mainly in June and July, it gives rise to winged males in autumn, which mate with wingless sexual females (oviparae). The lifecycle of M. fuscoviride is essentially similar, except that both sexual morphs are wingless. Hence, in the former species, inter-plant host gene flow can occur in the summer and, to a lesser extent, in autumn, whereas, in the latter species, such migrations are confined to the summer and involve winged asexual migrant females only. Not surprisingly, both species are known to display metapopulation structure with regular colonisation and extinction phases during the growing season (Massonnet, Reference Massonnet2002; Massonnet et al., Reference Massonnet, Simon and Weisser2002a; Massonnet & Weisser, Reference Massonnet and Weisser2004). Another difference is that M. fuscoviride is ant attended, whereas M. tanacetaria is not (Massonnet, Reference Massonnet2002).
In the present paper, we discuss the overall population proportion of clonal copies (as here characterised as MLGs) of tansy aphids at a local geographic scale collected by hand from tansy plants at several sampling sites and dates. In addition, similar data for the grain aphid, S. avenae (a predominantly asexual species in Britain: Llewellyn et al., Reference Llewellyn, Loxdale, Harrington, Brookes, Clark and Sunnucks2003), collected earlier at larger spatial scales, including geographic, using suction trapping or by hand from cereal fields, is presented by way of contrast. The main aim is to report on a broad phenomenon – namely, that regardless of sampling regime, population structure and flight behaviour (tansy aphids: weakly migratory; grain aphid: highly migratory; see Discussion), all three species show fundamentally similar patterns in terms of MLG frequency distribution. Other details of the spatio-temporal population genetics of tansy aphids will be described in detail elsewhere.
Material and methods
Aphids
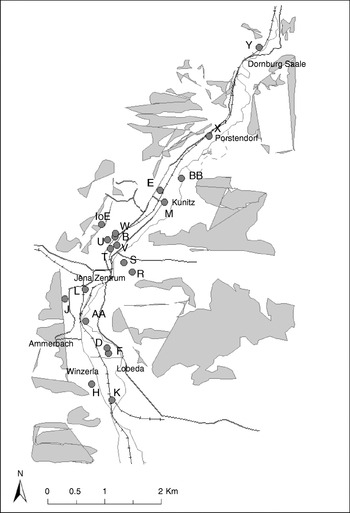
Tansy aphids were collected in the spring, summer and autumn of 2007 at various sites (MA=11; ME=17 sites) by hand from genets (whole plants) and ramets (shoots) of tansy in the vicinity of Jena (50.93°N, 11.58°E) from an area of approximately 80 km2 (fig. 1). M. tanacetaria were also sampled earlier from four sites in a previous study in 2000 (Massonnet, Reference Massonnet2002), again from spring to autumn (fig. 1). In all, 113 and 65 tansy plants were sampled for M. tanacetaria in 2000 and 2007, and 87 for M. fuscoviride in 2007; total sample sizes for aphids tested genetically were 451, 387 and 577 for the two tansy feeding species, respectively. Usually, between five and ten aphids were sampled per tansy ramet. With S. avenae, two wheat fields (each of different cultivar: see Llewellyn et al., Reference Llewellyn, Loxdale, Harrington, Clark and Sunnucks2004 for details) were sampled in 1997 by hand at three sites in southern England: Rothamsted, Harpenden (51.80°N, −0.36°W); Hemel Hempstead, Hertfordshire (51.75°N, −0.47°W); and Garford, Oxfordshire (51.65°N, −1.37°W), whilst aerial samples were collected at four main sites in the UK in a south-north transect (Wye, Kent; 51.18°N, 0.93°E); Rothamsted; Newcastle, Northumberland (54.97°N, −1.60°W); and the Scottish Crop Research Institute (SCRI), Invergowrie, near Dundee, Perthshire, Scotland (56.45°N, −2.96°W) using 12.2 m high suction traps (Macaulay et al., Reference Macaulay, Tatchell and Taylor1988). At Rothamsted in 1997, two samples were taken, an early (June) and late (July) sample; whilst, at both Rothamsted and Dundee, samples were also collected in the following year, 1998. The total sample size for the S. avenae tested for field and suction trap collections was 145 and 348, respectively. (See fig. 1 in Llewellyn et al. (Reference Llewellyn, Loxdale, Harrington, Brookes, Clark and Sunnucks2003) (suction trapping) and Llewellyn et al. (Reference Llewellyn, Loxdale, Harrington, Clark and Sunnucks2004) (field samples) for maps showing the location of S. avenae collecting sites and sampling procedures in the case of the field sampling.) The data for S. avenae, although previously published in terms of other spatial and temporal genetic parameters and patterns in Llewellyn et al. (Reference Llewellyn, Loxdale, Harrington, Brookes, Clark and Sunnucks2003, Reference Llewellyn, Loxdale, Harrington, Clark and Sunnucks2004), hitherto, have not been shown in the form presented here.
Small scale map of Jena showing collecting sites for MA and ME. In 2007, ME sites were as follows: late April–early May; D, E, M, R, S, U, T, W, X, Y; mid-late June; B, D, F, H, IoE (Institute of Ecology), K, L, T, U, V, W, X, Y; mid-July–early August; B, D, IoE, K, T, U, V, X; MA sites: late April–early May; AA, BB, D, K, L, R, T, U, V, X, Y; early September–October; BB, K, R, V, T. In 2000, MA sites; D, J, T, V ( , sampling sites;
 , roads;
 , river;
 , railway;
 , forests).

Molecular marker analysis
For all three aphid species, adult wingless (apterous) and winged (alate) asexual females and, in the case of M. tanacetaria samples (fig. 2c), sexual morphs (see legends for details) were stored in 100% ethanol at 4°C until tested electrophoretically, whilst DNA extraction from individuals followed the ‘salting out’ procedure of Sunnucks & Hales (Reference Sunnucks and Hales1996). In the 2007 study, eight polymorphic microsatellite loci were run for M. tanacetaria (Ma-1 to -8; Massonnet et al., Reference Massonnet, Leterme, Simon and Weisser2001; her Mt-1 to -8) (but only three for the 2000 temporal study; see legend of fig. 2c) and five for M. fuscoviride (Me-1 to -5; Massonnet et al., Reference Massonnet, Leterme, Simon and Weisser2002b; her Mf-1 to -5), essentially as described by Massonnet, and four for S. avenae (Sm-10, -11, -12 and -17) for both field collected and suction trapped material, as described in Llewellyn (Reference Llewellyn2000) and Llewellyn et al. (Reference Llewellyn, Loxdale, Harrington, Brookes, Clark and Sunnucks2003) (see also Wilson et al., Reference Wilson, Sunnucks and Hales1997, Reference Wilson, Massonnet, Simon, Prunier-Leterme, Dolatti, Llewellyn, Figueroa, Ramirez, Blackman, Estoup and Sunnucks2004; Simon et al., Reference Simon, Baumann, Sunnucks, Hebert, Pierre, Le Gallic and Dedryver1999). In the case of the tansy aphids, PCR products were screened using fluorescently-labelled (IRD-700 and -800) forward primers (MWG, Germany) using 6.5% polyacrylamide (electrophoretic) sequencing gels on a Licor 4500 sequencer (Massonnet et al., Reference Massonnet, Leterme, Simon and Weisser2001, Reference Massonnet, Leterme, Simon and Weisser2002b), whilst those from S. avenae were screened similarly, but conventionally on sequencing gels, using silver staining (detailed in Llewellyn, Reference Llewellyn2000). Gel images were downloaded and stored electronically. Band (allele) size (bp) was scored by hand with reference to molecular size markers (Licor 50–350 bp ladder) run in the first and last wells of the gel, also labelled with IRD-700 and -800 dyes in the case of the fluorescently labelled PCR products.
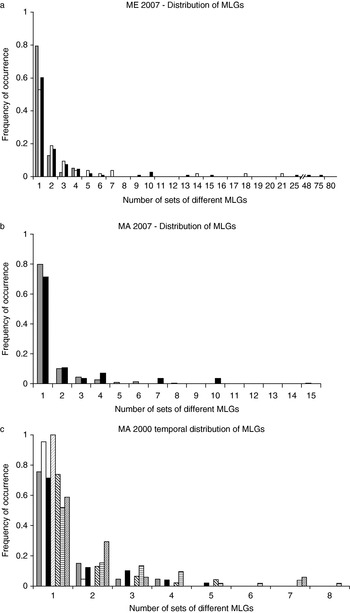
Frequency of occurrence vs. number of sets of different MLGs for tansy aphids. For this survey, the number of plants (n) sampled is shown along with the total number of aphids (N, bracketed in parenthesis) analysed per sampling period: (a) Metopeurum fuscoviride=ME collected in 2007 and tested using five polymorphic microsatellites (Me-1 to -5): early=late April, mid-May, total n=21 (N=52, of which one (~2%) was winged, the rest wingless in four MLG categories); middle=mid-June, early July, total n=35 (N=154, of which three (~2%) were winged, the rest wingless in ten MLG categories); late=mid-July, early August, total n=31 (N=371, all wingless in 13 MLG categories) ( , April–May; □, mid-late June; ▪, mid July, early August); (b) Macrosiphum tanacetaria=MA collected in 2007 and tested using eight polymorphic microsatellites (Ma-1 to -8): late April, mid-May; total n=49 (N=333, of which 13 (~4%) were winged in eight MLG categories); early September, mid-October, n=16 (N=54, of which 2 (~4%) were winged males and one (~2%) a wingless sexual female in six MLG categories) (, April–May; ▪, Sept.–Oct.); (c) MA aphids collected at four sites in Jena in 2000 and tested at three microsatellite loci (Ma-4, -6 and -7) from plants at four sampling periods: June, n=34 (N=142, of which 119 (84%) were wingless), 23 (16%) winged in four MLG categories; July, n=27 (N=93, of which 75 (81%) were wingless, 18 (19%) winged in five MLG categories); September, n=22 (N=69, all wingless in five MLG categories); and October, n=30 (N=147 of which 30 (20%) were winged males, 117 (80%) wingless sexual females=oviparae). See figures for histogram bar assignments (, June unwinged; □, June winged; ▪, July unwinged;
 , July winged;
 , September unwinged;
 , Oviparae (wingless);
 , males (winged)).

Results
Tansy aphids
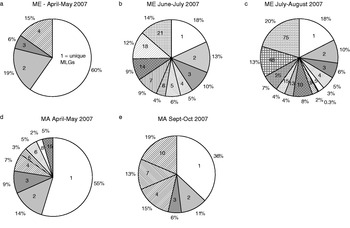
For the two tansy feeding species analysed, the number of sets of different MLG repeats (1, 2, 3, etc.; x-axis) was plotted against their frequency of occurrence (y-axis) in the total population sample, respectively, that is to say, for either species, the number of times different individuals or clones bearing particular MLGs (i.e. as uniques or as multiple copies of different repeat number) occurred within the sample tested. Figure 2a, b shows the relationship found for the two species. As seen, the graphs are negatively exponential, with most MLGs occurring as single copies (>50%) and with few multiple clonal copies beyond six repeats. In fig. 2c, temporal samples of M. tanacetaria collected in an earlier study (at four different times in the same year, i.e. 2000: Loxdale, H.D., Massonnet, B., Schöfl, G. & Weisser, W.W., unpublished observations) were plotted in the same way and similar graphs produced. In this third graph, as the year progresses, despite the complete dominance of sexual morphs in the sample (winged males and wingless oviparae; 100%; see fig. 2c legend), the number of multiple MLGs of high number (>6) increased, and, prior to the collapse of colonies in the autumn as a result of host senescence, late populations comprised relatively more clonal copies than earlier on in the growing season. In fig. 3a–e, the data presented in fig. 2a, b are re-plotted in the form of pie diagrams to reveal the number of individual aphids and their respective percentage values of the total sample per MLG category for the ME 2007 (three sampling dates) and MA 2007 (two sampling dates) collections, respectively. These graphs show that for both tansy aphid species and all sampling dates, the individual MLGs (copy number=1) are dominant, i.e. occur in excess over all the other MLG categories (2, 3, 4, etc.), except for ME samples collected in mid-July–early August, where the existence of a MLG represented by 75 repeat copies (20%) slightly exceeds the proportion of individual MLGs (18%; fig. 3c). Meanwhile, as the season progresses, the number of MLG repeat copies increases for both species and all sampling dates, as is evident from the original data plotted as histograms (fig. 2a, b). Hence, clones are being produced, but there is no clearly dominant clone in the populations sampled.
The data of fig. 2a, b plotted in the form of pie diagrams to yield the number of individual aphids per MLG category. The number shown within segments=no. of MLG repeats (1, 2, 3, 4, etc.); the percentage values externally per segment=the proportion of each MLG category in relation to the total number of MLGs tested per aphid species and sampling period.

Cereal aphids
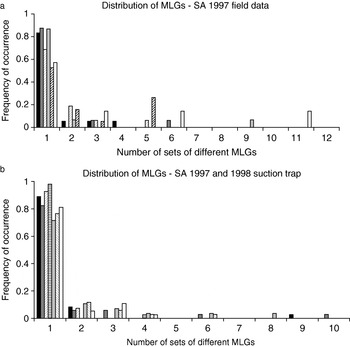
To test whether this relationship occurred in other species, MLG data from the major European cereal pest species, S. avenae, was analysed using date from a previous study, both for aphids collected from Wheat (Triticum aestivum L.) and by suction trapping (Llewellyn, Reference Llewellyn2000; Llewellyn et al., Reference Llewellyn, Loxdale, Harrington, Brookes, Clark and Sunnucks2003). Figure 4a, b shows the results. Again the shape of the graphs are similar for both fig. 4a (field data, representing aphid samples collected from six wheat fields, two fields per three sites) and fig. 4b (suction trap data; four sites with samples collected at Rothamsted twice in the same years and in two consecutive years and at Dundee in two consecutive years: Llewellyn et al., Reference Llewellyn, Loxdale, Harrington, Clark and Sunnucks2004). Hence, for both scenarios, single copy MLGs occur much more often (>50%, and in several instances >80%) than any of the other multiple MLGs, especially clonal repeats greater than six copies.
Frequency of occurrence vs. number of sets of different MLGs for cereal aphids, Sitobion avenae (=SA) using four polymorphic microsatellites: (a) represents the data from aphid field samples collected from late June–mid July at three sites in 1997 with two fields per site (see Llewellyn et al., Reference Llewellyn, Loxdale, Harrington, Clark and Sunnucks2004, for further details). The number of individual aphids collected per field ranged between N=22–25 for all six fields (▪, Rothamsted A; , Rothamsted B; , Hemel Hempstead A; , Hemel Hempstead B;  , Garford A; □, Garford B); (b) shows the distribution of MLGs from suction trapped individual winged aphids collected at four main sites on a south-north transect in the UK and over two consecutive years, 1997 and 1998. The approximate collecting periods and sample sizes (N, bracketed in parenthesis) for each collection were as follows: 1997, late June–early July, Rothamsted early (N=49); third week of July: Wye (N=53); Rothamsted (N=53); Newcastle (N=43); Invergowrie, Dundee (N=52); 1998, late June–early July, Rothamsted (N=49); Dundee (N=49). See figures for histogram bar assignments (□, Wye 1997; , Rothamsted 1997;
 , Newcastle 1997;
 , Dundee 1997; , Rothamsted early 1997;
 , Rothamsted 1998; □, Dundee 1998).

Discussion
As shown, the shape of the variables ‘Frequency of occurrence’ vs. ‘Number of sets of different MLGs’ is essentially similar for the three species Macrosiphoniella tanacetaria, Metopeurum fuscoviride and Sitobion avenae belonging to three separate genera of aphids (Aphididae), two species of which are specialist tansy feeding, the third a common cereal pest. Because of the huge area of commercial cereals and wild grasses (both hosts for S. avenae: Blackman & Eastop, Reference Blackman and Eastop2000), this pest species shows very high aerial abundance at peak flight times, June–July, e.g. >102 to >2×10³ in some Rothamsted Insect Survey (RIS) suction traps in the UK (Woiwod et al., Reference Woiwod, Tatchell, Dupuch, Macaulay, Parker, Riley and Taylor1988). In contrast, over the period 1971–92, the very much rarer tansy aphids, which are constrained in terms of abundance by their widespread, but patchy, plant host distribution and concomitant colony size, occurred sporadically in 12.2 m high suction traps and only as singletons or as a very few individuals, i.e. two (Lynda Alderson, RIS, personal communication). Thus, in terms of aerial density, the tansy aphids are at least two orders of magnitude rarer than the grain aphid during the growing season.
What is the explanation for a majority of single copy MLGs within population samples of the three aphid species, especially for samples collected in the middle of the growing season, i.e. peak flight time? The suction trap data, in effect a randomised aerial sample, precludes a sampling effect in terms of collecting the insects by hand from plants, or to some peculiarity of the flight/colony behaviour of particular species, especially the rather immobile tansy feeding species. In our view, what we are seeing is an aspect of intraspecific, interclonal selection, of which there is some previous evidence in terms of the variety of clones found during the spring-summer asexual phase of propagation (S. avenae: Haack et al., Reference Haack, Simon, Gautheir, Plantegenest and Dedryver2000; Llewellyn et al., Reference Llewellyn, Loxdale, Harrington, Clark and Sunnucks2004; M. persicae: Vorburger et al., Reference Vorburger, Lancaster and Sunnucks2003a; Vorburger Reference Vorburger2006), although our findings are the first to demonstrate that selection does not just limit the actual number of MLGs but also their copy number in terms of individuals. In some cases (ME; fig. 2a), repeats up to 75 copies were found; but the samples examined were rarely dominated by one or a very few MLG types, except occasionally on single plants or small clumps of plants in close proximity to each other (a few metres apart). Such structuring may, in the case of tansy aphids, directly relate to the metapopulation structure of these aphids, whereupon the colonies tend to be clumped locally due to the spatial structuring of the plant hosts and the apparent difficulties experienced by the aphid in finding such scattered resource patches, rather than being uniformly distributed spatially and temporally. However, it is also true that perhaps all natural aphid populations show metapopulation structure to some extent. Furthermore, the individual plant architecture (comprising genets and ramets) is likely to affect the ready movement of aphids from one within-plant resource patch (i.e. ramet) to another, either by walking or, less likely, flying. In addition, and in relation to both tansy and cereal aphids, stochastically-related mortality factors – predation, hymenopterous parasitism and the effect of entomophthoralean fungi – are likely to cause heavy local extinctions of particular aphid lineages/genotypes (e.g. Weisser, Reference Weisser2000 in the case of parasitoid attack) so that these never fulfil their early promise of becoming dominant within the population. Lastly, individual genotypes may show preference (adaptation) to certain plant ‘chemotypes’, which differ both qualitatively and quantitatively in their terpene and terpenoid content (R. Kigathi, personal communication).
Hence, we believe this to be very good evidence, certainly in the three aphid species currently examined, against the notion of so-called ‘super-clones’ as found earlier in previous studies of aphids (Fenton et al., Reference Fenton, Woodford and Malloch1998; Haack et al., Reference Haack, Simon, Gautheir, Plantegenest and Dedryver2000; Vorburger et al., Reference Vorburger, Lancaster and Sunnucks2003a; Figueroa et al., Reference Figueroa, Simon, Le Gallic, Prunier-Leterme, Briones, Dedryver and Niemeyer2005; Kasprowicz et al., Reference Kasprowicz, Malloch, Pickup and Fenton2008), and at least not in the habitats here considered (agriculturally heterogeneous in the case of S. avenae, since none of the British samples were collected from the main cereal-growing region of East Anglia; Nb. of a total farmed area of 1.4 million hectares, almost a third was used for wheat in 2007; www.nfuonline.com/x254.xml). In contrast, many of the agro-ecosystems where super-clones have been found are intensively cultivated, with large areas of monoculture, and involve obligate asexual forms of the aphids concerned. The asexual nature of M. persicae populations in Scotland on potatoes and brassicas relates to the scarcity of the primary overwintering host, Peach, Prunus persica (L.) Batsch (Tatchell et al., Reference Tatchell, Parker and Woiwod1983; Blackman & Eastop, Reference Blackman and Eastop2000). Since this tree is necessary for sexual overwintering in the egg stage, the aphid is forced to remain as live parthenogenetic individuals all year round, despite periodic adverse winter conditions which must seriously deplete such populations (Kasprowicz, Reference Kasprowicz2006) and may well be responsible for the very limited number of clones in this region (a mere 14 clones were found to comprise >98% of a collection of around 1500 individuals analyzed by Kasprowicz et al. (Reference Kasprowicz, Malloch, Pickup and Fenton2008) using microsatellite and insecticide resistance markers). The aphid's survival asexually is related to the fact that it has a wide host range and that there are suitable winter host plants (e.g. brassicas) providing green bridges. It should, however, also be pointed out that some asexual M. persicae lineages survive as obligate asexuals in Greece even where Peach trees abound (Margaritopoulos et al., Reference Margaritopoulos, Tsitsipis, Goudoudaki and Blackman2002), whilst sexual lineages, where they occur commonly (e.g. France & Greece), have a higher genetic variability compared with asexual lineages (e.g. Guillemaud et al., Reference Guillemaud, Mieuzet and Simon2003, see below).
Another possibility for differences in MLG copy number as presently shown could be differences in fecundity between clones (clonal competition: e.g. Herzog et al., Reference Herzog, Muller and Vorburger2007). There is some evidence for this in the case of S. avenae related to colour in the field, i.e. brown clones may be more UV light tolerant and resistant to hymenopterous parasitoid attack than green clones (Chroston, Reference Chroston1983; Ankersmit et al., Reference Ankersmit, Bell, Dijkman, Mace, Rietstra, Schröder and de Visser1986; Jenkins, Reference Jenkins1991; Jenkins et al., Reference Jenkins, Loxdale, Brookes and Dixon1999). However, whilst both tansy aphid species do show some colour dimorphism (brown and green, the former dominant in terms of frequency), the tansy aphids tested were of the brown form.
The genetic variability observed in the three species here considered (M. tanacetaria, M. fuscoviride and S. avenae) is doubtless the result of the annual autumn/winter phase of sexual reproduction during which new genetic combinations are formed (even in S. avenae a proportion of the population is clearly sexual in southern Britain and overwinter as sexual eggs especially during cold winters, e.g. Hand, Reference Hand1989; Helden & Dixon, Reference Helden and Dixon2002), although since microsatellites are fast mutating markers relative to coding sequences (e.g. Wilson et al., Reference Wilson, Sunnucks and Hales1999; see also Loxdale & Lushai, Reference Loxdale and Lushai2003 and references therein), it is probable that some of the variability is the direct consequence of mutations within lineages during the parthenogenetic phase of propagation (Loxdale, personal observation). If annual population bottlenecks are not too severe such that the newly mutated alleles/genotypes are eliminated (by stochastic events including genetic drift/bottlenecks/founder events), aphids bearing such new variants may persist until the clone dies out, which perhaps is soon due to clonal preference/selection (e.g. see Vorburger, Reference Vorburger2006, and Fenton et al., Reference Fenton, Kasprowicz, Malloch and Pickup2009, in the case of some M. persicae clones); or maybe clones persist for longer periods of time, as appears to be true for S. avenae in Britain and France, seemingly at least over several growing seasons (Llewellyn, Reference Llewellyn2000). In cyclically parthenogenetic M. persicae, samples collected by suction trapping in regions of France with cold winters, i.e. with an annual sexual phase involving return to P. persica in the autumn, Guillemaud et al. (Reference Guillemaud, Mieuzet and Simon2003) also found predominantly unique MLGs (seven microsatellite loci tested) compared with obligate asexual forms collected from milder regions, which showed many more multiple copy MLGs. In addition, the sexually-derived populations in the following spring showed pairwise linkage equilibrium between loci tested, in contrast with the asexual samples sampled in spring-summer and autumn which displayed abundant clonal copies as well as linkage disequilibrium (see Guillemaud et al., Reference Guillemaud, Mieuzet and Simon2003, for details).
In conclusion, aphid populations, both terrestrial and aerial, appear not to be dominated – certainly in the species here described inhabiting semi-natural habitats – by a few major clones in terms of their large-scale population genetic structure. This being so, whatever the so-called ‘aerial plankton’ consists of in terms of aphids (in relation to other small flying insects), for many species it may well comprise a multitude of winged forms bearing mainly unique MLGs, rather than numerous individuals with relatively few such genotypes, as found in the case of M. persicae inhabiting intensively cultivated agro-ecosystems. This then is further evidence against Dan Janzen's (Reference Janzen1977) view that aphid clones represent some kind of super-organism or widespread ‘evolutionary individual’ (Loxdale, Reference Loxdale2008a). We also feel that the lack of widespread and dominant clones is further evidence against ideas of ‘General Purpose Genotypes’ or GPGs and, if so, thereby supports the work of Vorburger et al. (Reference Vorburger, Sunnucks and Ward2003b) that such entities probably do not exist, certainly in aphids, and perhaps generally.
Acknowledgements
We thank Tobias Kaiser of the MPICE for his help with data analysis, Dr Kate Llewellyn for allowing us to re-analyse her 1997/1998 S. avenae genotype frequency data (from Llewellyn, Reference Llewellyn2000), Lynda Alderson of the RIS for aerial density information concerning the two tansy aphid species, and two anonymous reviewers for their helpful comments on an earlier draft of the manuscript. HDL was supported by an EU Marie Curie Senior Research Fellowship (TOK FP6-029983).