Carrier transport in graphene
Graphene has some outstanding physical properties that make it extremely appealing for applications in electronics. Of these, the extraordinarily rapid charge-carrier transport of graphene has received the most attention, and mobilitiesReference Bolotin, Sikes, Jiang, Klima, Fudenberg, Hone, Kim and Stormer1, Reference Du, Skachko, Barker and Andrei2 in excess of 200,000 cm2 V–1 s–1 and saturation velocitiesReference Schwierz3 of ∼5 × 107 cm s–1 have been reported. In addition, the one-atom thickness, mechanical strength, flexibility, high current-carrying capacity (up to 109 A/cm2), and high thermal conductivity (up to 50 W cm–1 K–1)Reference Balandin4 of graphene all contribute to its appeal.
Most of these record properties refer to a pristine material under somewhat idealized conditions. In technology, however, graphene is part of a more complex structure and is used under conditions that are dictated by the application. Under such realistic conditions, electronic transport is subject to a variety of scattering interactions,Reference Adam, Hwang, Galitski and Das Sarma5–Reference Katsnelson and Geim10 including long-range interactions with charged impurities on graphene or the supporting insulator substrate and short-range interactions involving neutral defects or adsorbates, surface roughness, and phonons.
Which of these mechanisms dominates the scattering depends on both the quality of the graphene sample and the characteristics of its environment.Reference Farmer, Perebeinos, Lin, Dimitrakopoulos and Avouris11 For instance, Coulomb scattering from charged impurities typically dominates at low temperatures for graphene on insulating substrates (e.g., SiO2, SiC, Al2O3).Reference Chen, Chaun, Jang, Xiao, Ishigami and Fuhrer7 Even in suspended graphene, transport is influenced by adsorbed species, so the mobility is greatly enhanced after these species are volatilized by heating.Reference Bolotin, Sikes, Jiang, Klima, Fudenberg, Hone, Kim and Stormer1, Reference Du, Skachko, Barker and Andrei2 When all impurities and structural defects are eliminated, phonon scattering remains.
The magnitude of the carrier mobility (μ) and its dependence on temperature (T) and carrier density (n) are indicative of the dominant scattering mechanism.Reference Farmer, Perebeinos, Lin, Dimitrakopoulos and Avouris11 Thus, mobilities that are greater than about 100,000 cm2 V–1 s–1 and are proportional to 1/nT indicate transport dominated by acoustic-phonon scattering, whereas Coulomb scattering typically leads to mobilities on the order of 1000–10,000 cm2 V–1 s–1 that are independent of n, and short-range scattering by neutral defects leads to a temperature-independent mobility that is proportional to 1/n.Reference Adam, Hwang, Galitski and Das Sarma5, Reference Zhu, Perebeinos, Freitag and Avouris9, Reference Chen, Cullen, Jang, Fuhrer and Williams12–Reference Chen, Jang, Ishigami, Xiao, Cullen, Williams and Fuhrer14
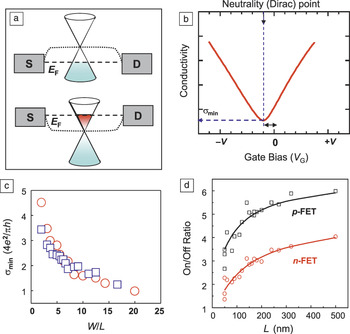
Although a number of different electronic devices based on graphene can be envisioned, we focus here on the most widely explored concept, that of field-effect transistors. Transport in graphene is intrinsically ambipolar, meaning that both positive and negative carriers are important. As illustrated in Figure 1a–b, when, through application of the appropriate gate bias, the Fermi level, E F, is brought below the neutrality point, E NP (the energy of the Dirac point), transport involves holes, whereas for E F> E NP, electrons are transported. As the Fermi energy is changed by the gate, the density of states (DOS) and, correspondingly, the carrier density ( $n\, \propto \,E_F^2 $) are changed. This is the basis of “switching” in graphene field-effect transistors (GFETs).
General electrical characteristics of a graphene field-effect transistor (GFET): (a) Ambipolar operation: (Top) Hole conduction between source S and drain D occurs when the Fermi energy E F lies below the neutrality (Dirac) point where the bands meet. (Bottom) Electron conduction occurs when E F lies above the neutrality point. (b) Schematic of GFET conductivity versus gate voltage (V G), illustrating the minimum conductivity, σmin. (c) Variation of σmin (scaled to the theoretical minimum conductance 4e 2/πh, where e is the electron charge and h is Planck’s constant) of a GFET as a function of the channel width-to- length ratio (W/L) at 300 K (red) and 4.3 K (blue). (d) Ratio of the on current (with a large gate voltage) to the off current (at the minimum) of a GFET as a function of the channel length L. Reproduced with permission from Reference Reference Wu, Perebeinos, Lin, Low, Xia and Avouris15. ©2012, American Chemical Society.

However, unlike transistors made of conventional semiconductors with a bandgap, a GFET does not turn off completely, even though the DOS is zero at the neutrality point. A residual conductivity, the so-called minimum conductivity (σmin), remains.Reference Tan, Zhang, Bolotin, Zhao, Adam, Hwang, Das Sarma, Stormer and Kim16 This is illustrated in Figure 1c, which shows the variation of the minimum conductivity as a function of the width-to-length ratio (W/L) for a graphene FET.Reference Wu, Perebeinos, Lin, Low, Xia and Avouris15, Reference Wu, Jerkins, Valdes-Garcia, Farmer, Zhu, Bol, Dimitrakopoulos, Zhu, Xia, Avouris and Lin17 As can be seen, the conductivity decreases with increasing W/L, and at a high ratio, it approaches the theoretically predicted valueReference Wu, Perebeinos, Lin, Low, Xia and Avouris15 of 4e 2/πh.
The fact that the current in the graphene channel cannot be completely shut off by the gate limits the achievable current on/off ratio to around 10, although the exact value depends on the quality of the graphene and the effectiveness of the gating. Figure 1d shows the variation of the on/off ratio as a function of the channel length of a GFET operated in the p and n branches of graphene at 4.3 K.Reference Wu, Perebeinos, Lin, Low, Xia and Avouris15 The origin of the variation is discussed later in this section. The key point is that digital transistors used in logic applications require on/off ratios higher than about 104. It is therefore clear that graphene in its natural form is not appropriate for a digital switch.
The operation of graphene devices is not only dependent on the electrical properties of the graphene material used, but is also strongly affected or even dominated by what happens in other parts of the device. Specifically, carriers have to be injected into a graphene channel and then collected through metal contacts. These contacts generate potential energy barriers for carriers, similar to the Schottky barriers in conventional semiconductors that strongly affect the performance of those devices. Graphene and metals typically have different work functions, which causes charge transfer between them. This charge transfer leads to the doping of graphene underneath the metal and induces a local band bending. If more-reactive metals such as nickel or platinum are used, there can be significant hybridization and modification of the graphene band structure under them.
A carrier injected into graphene from the metal must overcome or tunnel through a barrier formed at the metal–graphene interface by the charge-transfer process and also another barrier generated at the junction between the thus-doped graphene under the metal and the graphene of the channel (a doping barrier similar to a p–n junction).Reference Giovannetti, Khomyakov, Brocks, Karpan, van den Brink and Kelly18–Reference Xia, Perebeinos, Lin, Wu and Avouris20 Typically, tunneling through this barrier is described as a form of Klein tunneling (gapless interband tunneling).Reference Huard, Stander, Sulpizio and Goldhaber-Gordon21, Reference Cayssol, Huard and Goldhaber-Gordon22 This transmission ultimately depends on the steepness of the barrier near E Fand the angle of incidence.
In practice, experimental factors such as improper metal adhesion and the presence of metal oxides, other impurities, and roughness at the metal–graphene interface can make important contributions to the measured contact resistance. For these reasons, the experimental values of metal–graphene contact resistance tend to vary significantly, from a couple hundred to several thousand ohm micrometers.Reference Xia, Perebeinos, Lin, Wu and Avouris20 Moreover, the value of the contact resistance is a function of the gate voltage, because of the varying density of states, and is also weakly dependent on temperature.Reference Xia, Perebeinos, Lin, Wu and Avouris20
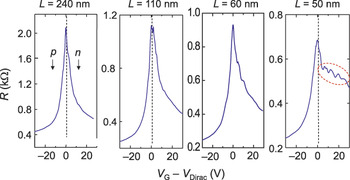
Critically, the contact resistances are comparable to the resistance of the graphene channel itself. Furthermore, the high contact resistance becomes more significant as the channel length is scaled down and more of the potential drop occurs at the contacts. Eventually, when transport in the channel becomes ballistic, contacts dominate the function of devices.Reference Wu, Perebeinos, Lin, Low, Xia and Avouris15 This behavior is demonstrated in Figure 2, which shows the resistance of back-gated devices with different channel lengths as a function of the difference of the back-gate voltage from the Dirac point. The work function of palladium used as the contact metal in this case is high, so charge transfer leads to hole (p) doping of the graphene under the metal.
Resistance (R) of a back-gated GFET prepared by chemical vapor deposition (CVD) as a function of the difference between the gate voltage (V G) and the Dirac voltage (V Dirac) in devices with different channel lengths (L), demonstrating the role of metal contacts in electron- and hole-transport asymmetry. The contact metal is palladium, which dopes graphene p-type. As the channel length decreases, the resistance for electron transport (V G > V Dirac) increases, reflecting the formation of a p–n–p structure and the increasing relative contribution of the contacts to the overall resistance. For the shortest channel (L = 50 nm), transport is quasiballistic and coherent, and the carriers reflected by the contact barriers show quantum interference and Fabry–Perot-like oscillations (indicated by the red dashed oval). Reproduced with permission from Reference Reference Wu, Perebeinos, Lin, Low, Xia and Avouris15. ©2012, American Chemical Society.

In the device with the longest channel shown (250 nm), the doping profile along the channel varies depending on the bias of the gate (V G) with respect to the Dirac voltage (V Dirac, the gate voltage for which the maximum longitudinal resistivity occurs): It is p′–p–p′ (where p and p′ indicate two different degrees of hole doping) for V G – V Dirac < 0, but becomes p–n–p for V G – V Dirac > 0. The formation of p–n junctions leads to a larger resistance for electrons than for holes, breaking the electron–hole transport symmetry of graphene.Reference Huard, Stander, Sulpizio and Goldhaber-Gordon21, Reference Cayssol, Huard and Goldhaber-Gordon22 As the channel length is decreased, the asymmetry becomes more pronounced. Finally, in the shortest device studied (50 nm), transport is quasiballistic (almost free of scattering) and coherent: Not only is the asymmetry very pronounced, but the electron transport shows a clear oscillatory behavior.Reference Wu, Perebeinos, Lin, Low, Xia and Avouris15 Experiment and theoretical modeling have shown that these oscillations are due to electron reflection and quantum interference produced by the potential barriers introduced by the contacts, that is, the channel acts as a Fabry–Perot cavity.Reference Wu, Perebeinos, Lin, Low, Xia and Avouris15
Graphene transistors and circuits
Whereas the lack of a bandgap and the resulting incomplete switching of graphene do not support its use as a digital switch, the outstanding carrier mobility of graphene, the high transconductance of graphene devices, and the ultimate thinness and stability of the material make it an excellent choice for fast analog electronics, specifically radio-frequency (RF) transistors. In analog RF operation, the ability to completely switch off the device, although desirable, is not necessary. For example, in signal amplifiers, a major application of this type of device, the transistor is always in the on state, and the RF signal to be amplified is superimposed on the dc gate bias.
Whereas the easy preparation of graphene by graphite exfoliationReference Novoselov, Geim, Morozov, Jiang, Zhang, Dubonos, Grigorieva and Firsov23 provided the impetus for the development of the graphene field, this method is not appropriate for large-scale industrial production. In particular, in electronics technology, one needs large-scale graphene on an insulating substrate. Furthermore, to be able to use the already highly advanced silicon device processing techniques in graphene technology, graphene in wafer form is highly desirable.
Currently, two general types of methods for the large-scale synthesis of graphene are utilized, as discussed in the articles by Nyakiti et al. and Bartelt and McCarty in this issue of MRS Bulletin. One is based on the thermal decomposition of SiC.Reference Badami24–Reference Avouris and Dimitrakopoulos28 When SiC wafers are heated, typically in the presence of an argon atmosphere, at temperatures on the order of 1500°C, silicon desorbs, and the remaining carbon rebonds to form (depending on the experimental conditions) one or more layers of graphene on top of the SiC, which itself acts as the insulating substrate. Both the growth rate and the characteristics of the resulting graphene depend on whether the silicon-terminated or carbon-terminated face of SiC is used for growth. Growth is much faster on the carbon face, leading to multilayer graphene with many surface wrinkles and a material that tends to be p-doped after exposure to the environment. Silicon-face growth is slower, can be controlled, and typically gives rise to n-type graphene.
Another widely used approach involves the growth of graphene on metals. Two main mechanisms for growth have generally been employed. One involves catalytic metals such as nickel, ruthenium, platinum, and iron, which not only can dissociate the carbon precursors (e.g., CH4, C2H2) but can also dissolve significant amounts of carbon at high temperature.Reference May29, Reference Reina, Jia, Ho, Nezich, Son, Bulovic, Dresselhaus and Kong30 Upon cooling, the carbon segregates as graphene on the metal surface. The other approach is a catalytic chemical vapor deposition (CVD) process whereby the precursor is decomposed at elevated temperatures (>1000°C) on copper, which has very limited solubility for carbon.Reference Li, Cai, An, Kim, Nah, Yang, Piner, Velamakanni, Jung, Tutuc, Banerjee, Colombo and Ruoff31, Reference Chen, Cai, Piner, Suk, Wu, Ren, Kang and Ruoff32 This simple, rather inexpensive technique yields primarily monolayer graphene and has the advantage that, after the dissolution of the copper, the thus-formed monolayer can be transferred to another substrate, such as any of the optically transparent substrates used in photonic applications. Once a graphene film is in place, devices can be fabricated in it using electron-beam or photolithography, and oxygen plasma can be used to etch away the unwanted graphene. Metal contacts are formed using some form of metal evaporation.
A key materials issue encountered in the fabrication of graphene devices involves finding an appropriate gate dielectric insulator and substrate. To optimize the field effect of the gate, a very thin high-dielectric-constant film is needed. Graphene is both inert and hydrophobic. Therefore, very thin polar insulators (e.g., SiO2, HfO2, Al2O3) form poor-quality, nonuniform, and leaky films on it. In addition, such materials tend to trap charges near or at the insulator–graphene interface, leading to Coulomb scattering and a dramatic decrease in carrier mobility.Reference Farmer, Chiu, Lin, Jenkins, Xia and Avouris33 A number of different approaches have been used to address this problem, including deposition of a thin, inert buffer layer that wets the surface before atomic-layer deposition (ALD) of the main film,Reference Farmer, Chiu, Lin, Jenkins, Xia and Avouris33 plasma-assisted deposition of Si3N4,Reference Zhu, Neumayer, Perebeinos and Avouris34 or deposition of a thin metal film seed layer (usually aluminum) that is then oxidized in situ prior to ALD of the insulator film.Reference Kim, Nah, Jo, Shahrjerdi, Colombo, Yao, Tutuc and Banerjee35
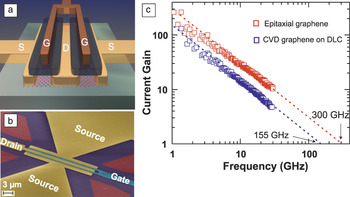
Because graphene produced by different methods is unintentionally p- or n-doped, there is a need to shift the neutrality point close to V G = 0 V. This can be accomplished through compensation by choosing the appropriate insulator, for example, AlOx for CVD graphene or SiNx for epitaxial graphene. A schematic of the structure and a colorized image of a fabricated RF GFET are shown in Figure 3a–b.Reference Wu, Farmer, Valdes-Garcia, Zhu, Jenkins, Dimitrakopoulos, Avouris and Lin36 See the sidebar for a description of some metrics used to evaluate GFETs.
GFET Metrics
Several metrics are used to evaluate GFETs. Assessment of the intrinsic capabilities of a new channel material, such as graphene, should be insensitive to contact resistance and fabrication details. The metric used for this purpose is the cutoff frequency, f T, which is defined as the frequency at which the current gain becomes 1 when the drain is short-circuited to the source. In a well-behaved device, f T is given by f T = g m/2πC, where g m (g m = dI/dV G) and C are the transconductance and gate capacitance of the device, respectively.Reference Schwierz3
(a) Schematic and (b) colorized optical image of a top-gated GFET, in which the voltage on the gate (G) controls the current flowing in the underlying graphene between the source (S) and drain (D). In both cases, the tan region including the source and drain represents graphene. (c) Current gains of two radio-frequency (RF) GFETs as functions of frequency. One (blue squares) is a CVD graphene FET on a diamond-like carbon (DLC) film for which the current gain extrapolates to unity at f T = 155 GHz,Reference Wu, Lin, Bol, Jenkins, Xia, Farmer, Zhu and Avouris37 and the other (red squares) is an epitaxial graphene FET from SiC with f T= 300 GHz.Reference Wu, Farmer, Valdes-Garcia, Zhu, Jenkins, Dimitrakopoulos, Avouris and Lin36

In contrast to this indicator of ultimate potential, for working devices, it is the voltage gain that is usually demanded. This voltage gain is defined as the ratio of the output voltage (at the drain) to the input voltage (at the gate) and is given by the ratio of the transconductance, g m, to the output conductance, g d (g d = dI/dV d). High voltage gain requires g m to be as high as possible and g d to be as small as possible. The latter condition requires that the transistor be operated at conditions of current saturation, where the current is almost independent of V d.
Many applications also require power gain, for which the appropriate metric is the maximum frequency, f max, which is the frequency at which the unilateral power gain becomes unity.Reference Schwierz3 This metric is strongly dependent not only on the channel material (i.e., graphene), but also on the actual structure of the device.
The first experimental graphene transistors used graphene exfoliated from graphite and deposited on SiO2 to initially make dcReference Lemme, Echtermeyer, Baus and Kurz38, Reference Kedzierski, Hsu, Healey, Wyatt, Keast, Sprinkle, Berger and de Heer39 and later RFReference Wu, Farmer, Valdes-Garcia, Zhu, Jenkins, Dimitrakopoulos, Avouris and Lin36, Reference Wu, Lin, Bol, Jenkins, Xia, Farmer, Zhu and Avouris37, Reference Meric, Baklitskaya, Kim and Shepard40–Reference Lin, Valdes-Garcia, Han, Farmer, Meric, Sun, Wu, Dimitrakopoulos, Grill, Avouris and Jenkins46 GFET devices. The first technologically relevant efforts utilizing wafer-scale synthesized graphene were based on the thermal decomposition of SiC.Reference Meric, Baklitskaya, Kim and Shepard40–Reference Lin, Dimitrakopoulos, Jenkins, Farmer, Chiu, Grill and Avouris44 A highly encouraging result came in 2010, when wafer-scale RF GFETs were produced with f T values of 100 GHz.Reference Lin, Dimitrakopoulos, Jenkins, Farmer, Chiu, Grill and Avouris44 However, the lack of a bandgap, the high optical-phonon frequency in graphene, and the presence of defects made current saturation hard to achieve; g dwas large, and thus voltage gain was low.
In these early studies, however, the graphene used had a rather modest mobility of ∼1500 cm2 V–1 s–1, and the gate length was, by today’s silicon-industry standards, quite long (240 nm), suggesting that dramatic enhancements in performance could be achieved by additional materials and device improvements. Indeed, the second generation of SiC-based GFETs attained f T values exceeding 300 GHz, in part by employing channel lengths as low as 40 nm17 (see Figure 3c), and voltage gains up to 20 dB were obtained with optimized device architectures. Operation closer to current-saturation conditions and use of thinner gate oxides have already produced an improved f maxvalue of ∼40 GHz.Reference Wu, Jerkins, Valdes-Garcia, Farmer, Zhu, Bol, Dimitrakopoulos, Zhu, Xia, Avouris and Lin17, Reference Wu, Farmer, Valdes-Garcia, Zhu, Jenkins, Dimitrakopoulos, Avouris and Lin36
The development of CVD graphene that can be transferred onto any substrate also provided the opportunity for a wide selection of substrates. The commonly used SiO2 is hydrophilic and prone to containing charged defects, both of which substantially degrade the value and reproducibility of the mobility in GFETs. One alternative substrate that was used successfully is diamond-like carbon (DLC), which is fully compatible with graphene, readily available, hydrophobic, and nonpolar. Initial results with this substrate yielded GFETs with f T = 155 GHz (see Figure 3c),Reference Wu, Lin, Bol, Jenkins, Xia, Farmer, Zhu and Avouris37 and recent improvements have led to f T = 300 GHz.Reference Wu, Jerkins, Valdes-Garcia, Farmer, Zhu, Bol, Dimitrakopoulos, Zhu, Xia, Avouris and Lin17, Reference Wu, Farmer, Valdes-Garcia, Zhu, Jenkins, Dimitrakopoulos, Avouris and Lin36 Most significantly, a study of the temperature dependence of GFETs on DLC showed that the performance remains essentially the same from 300 K to 4 K, indicating the absence of carrier freeze-out and demonstrating that graphene electronics could be used in extreme environments, such as outer space.Reference Wu, Lin, Bol, Jenkins, Xia, Farmer, Zhu and Avouris37
Thin layers of exfoliated, single-crystal, hexagonal boron nitride (h-BN) have also been used successfully as both the gate insulator and the substrate for graphene transistors.Reference Dean, Young, Meric, Lee, Wang, Sorgenfrei, Watanabe, Taniguchi, Kim, Shepard and Hone47, Reference Britnell, Gorbachev, Jalil, Belle, Schedin, Mishchenko, Georgiou, Katsnelson, Eaves, Morozov, Peres, Leist, Geim, Novoselov and Ponomarenko48 h-BN is an isomorph of graphite with a large bandgap (∼6 eV), making it an ideal insulator in this case. Single layers of graphene on h-BN were found to exhibit enhanced carrier mobilities (>100,000 cm2 V–1 s–1) and reduced carrier inhomogeneity and doping compared with graphene on SiO2, leading to scattering mean free paths on the order of 1 μm.Reference Dean, Young, Meric, Lee, Wang, Sorgenfrei, Watanabe, Taniguchi, Kim, Shepard and Hone47–Reference Xue, Sanchez-Yamagishi, Bulmash, Jacquod, Deshpande, Watanabe, Taniguchi, Jarillo-Herrero and LeRoy49 Boron nitride appears to be an ideal material for building graphene devices, provided that fabrication processes such as high-quality CVD can be developed that preserve the qualities of h-BN that is exfoliated from crystals.Reference Decker, Wang, Brar, Regan, Tsai, Wu, Gannett, Zettl and Crommie50, Reference Liu, Song, Zhao, Huang, Ma, Zhang, Lou and Ajayan51
The intrinsic cutoff frequency of graphene transistors has already reached the range of 100–400 GHz, demonstrating that, with further development, graphene technology can be competitive with other well-established RF technologies such as GaAs or InP high-electron-mobility transistors (f T = 100–600 GHz). A performance gap still exists, however, between graphene and the other mature technologies with respect to gain, f max.Reference Schwierz3 We note that, rather than representing the intrinsic performance of graphene, f maxis a metric that is strongly affected by the extrinsic components and layout of the circuit, and therefore, this performance gap can be reduced through further improvement of these other aspects.
In addition to efforts to enhance the performance of individual GFETs, initial results on device integration into circuits are appearing. A number of problems have to be resolved, primarily adapting technologies developed for silicon technology to the special requirements of graphene, such as adhesion to metals and electrical isolation. The contacts also limit how densely graphene devices can be packed. The transfer length required to achieve the lowest contact resistance, typically on the order of 100 nm for graphene,Reference Xia, Perebeinos, Lin, Wu and Avouris20 could eventually determine the ultimate pitch of the devices.
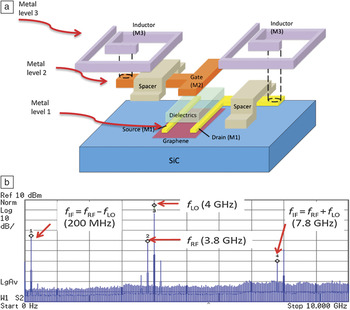
The first monolithically integrated graphene circuit, reported in 2011, involved a gigahertz-frequency unipolar mixer based on epitaxially grown grapheneReference Lin, Valdes-Garcia, Han, Farmer, Meric, Sun, Wu, Dimitrakopoulos, Grill, Avouris and Jenkins46 (see Figure 4). This one-transistor integrated circuit (IC) mixed two microwave signals to generate sum-frequency and difference-frequency signals and demonstrated the advantage that graphene offers in such applications because of the insensitivity of the resulting mixer performance to temperature variations. Earlier, frequency mixing based on the ambipolar behavior of graphene was successfully demonstrated.Reference Han, Hsu, Wu, Kong and Palacios52 A key application of analog transistors involves RF signal amplification. Other published demonstrations include an audio-range (kilohertz) amplifier using exfoliated grapheneReference Guerriero, Polloni, Giorgi Rizzi, Bianchi, Mondello and Sordan53 and wafer-scale IC structures.Reference Wu, Jerkins, Valdes-Garcia, Farmer, Zhu, Bol, Dimitrakopoulos, Zhu, Xia, Avouris and Lin17, Reference Han, Jenkins, Valdes-Garcia, Franklin, Bol and Haensch54
Graphene frequency-mixer integrated circuit (IC). (a) Schematic illustration of a graphene mixer. The key components include a top-gated graphene transistor and two inductors connected to the gate and the drain of the GFET. Three distinct metal layers of the graphene IC are represented by M1, M2, and M3. A layer of 120-nm-thick SiO2 is used as the isolation spacer to electrically separate the inductors (M3) from the underlying interconnects (M1 and M2). (b) Output spectrum of the mixer between 0 GHz and 10 GHz using an input RF frequency of f RF = 3.8 GHz and a local-oscillator frequency of f LO = 4 GHz. Each x and y division corresponds to 1 GHz and 10 dB, respectively. The frequency mixing is observed as two peaks (f IF) at the difference and sum frequencies 200 MHz and 7.8 GHz, respectively. Reproduced with permission from Reference Reference Lin, Valdes-Garcia, Han, Farmer, Meric, Sun, Wu, Dimitrakopoulos, Grill, Avouris and Jenkins46. ©2011, American Association for the Advancement of Science.

Graphene photonics
Graphene interacts very strongly with light. In the near-infrared and visible regions of the electromagnetic spectrum, where the electronic dispersion relation of graphene is nearly linear, suspended graphene in air absorbs about 2.3% of the normally incident light (calculated as πα, where α = e 2/ħc ≈ 1/137 is the fine structure constant).Reference Nair, Blake, Grigorenko, Novoselov, Booth, Stauber, Peres and Geim55, Reference Kuzmenko, Van Heumen, Carbone and van der Marel56 This implies an absorption coefficient for single-layer graphene (of thickness t G = 3.35 Å) of –ln(1 – πα)/t G ≈ 7 × 105 cm–1, which is one to three orders of magnitude higher than those of technologically relevant photonic materials such as In0.53Ga0.47As, GaAs, and germanium at 1.55 μm.Reference Nair, Blake, Grigorenko, Novoselov, Booth, Stauber, Peres and Geim55 A number of experimental studies have verified the ∼2.3% absorption per layer at visible and near-infrared energies.Reference Nair, Blake, Grigorenko, Novoselov, Booth, Stauber, Peres and Geim55, Reference Mak, Sfeir, Wu, Lui, Misewich and Heinz57, Reference Wang, Zhang, Tian, Girit, Zettl, Crommie and Shen58 Moreover, the absorption of graphene multilayers is approximately additive, if one excludes the energy region below 0.5 eV, where the absorption depends on both the number of layers and their stacking.
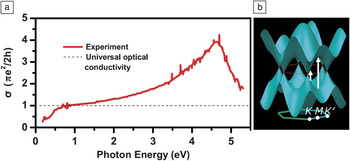
Studies of graphene absorption over broad energy rangesReference Mak, Shan and Heinz59, Reference Chae, Utikal, Weisenburger, Giessen, Klitzing, Lippitz and Smet60 have become available more recently. As seen in Figure 5a, at energies above the infrared region, the absorption increases steadily, peaks at about 4.6 eV, and has an asymmetric line shape.Reference Mak, Shan and Heinz59 This is the range expected for π–π* interband transitions at the saddle-point singularity near the high-symmetry M point of the graphene Brillouin zone (see Figure 5b). However, ab initio calculations, using the well-known GW approximation (G stands for Green’s function, and W is the screened Coulomb interaction), predict the energy of this transition to be significantly higher, 5.2 eV.Reference Yang, Cohen and Louie61 These observations can be explained by the presence of strong electron–hole interactions that form a saddle-point exciton and red shift the excitation energy. The asymmetric line shape develops through Fano-type interference between this exciton and the continuum of interband transitions near the M point.Reference Mak, Shan and Heinz59, Reference Chae, Utikal, Weisenburger, Giessen, Klitzing, Lippitz and Smet60, Reference Malic, Winzer, Bobkin and Knorr62
Absorption spectrum of graphene. (a) Optical conductivity (solid line) and “universal” optical conductivity πe 2/2h (dashed line) of monolayer graphene in the spectral range of 0.2–5.5 eV. The experimental peak energy is 4.6 eV. The deviation of the optical conductivity from the universal value at energies below 1 eV is attributed to Pauli blocking of the absorption due to the doping of the sample. Part (a) reproduced with permission from Reference Reference Mak, Shan and Heinz59. ©2011, American Physical Society. (b) Schematic of the band structure of graphene. Interband transitions near the K point (short vertical arrow) give rise to the universal absorption. The saddle point at the M point and the associated excitons (long vertical arrow) give rise to the conductivity peak, and interference with the interband absorption causes its asymmetry.

Interband excitations of graphene decay very rapidly. Pulsed excitation generates electron–hole pairs in a nonequilibrium state. Electron–electron interactions lead to a fast redistribution of energy, which, in turn, leads to a Fermi–Dirac distribution with a high electron temperature, T e.Reference Malic, Winzer, Bobkin and Knorr62, Reference Kim, Perebeinos and Avouris63 This process takes place in 100–300 fs and depends on the carrier concentration/doping. The lattice is heated on a picosecond time scale by optical-phonon emission.Reference Malic, Winzer, Bobkin and Knorr62, Reference Kim, Perebeinos and Avouris63 When the remaining energy falls below the optical-phonon energy (∼200 meV), acoustic-phonon emission, which proceeds slowly (on the order of nanoseconds),Reference Bistritzer and MacDonald64 provides an energy-dissipation bottleneck. The fast decay of graphene excitations leads to the absence of resonant fluorescence, allows the fast recovery of saturated absorption exploited in Q switching, and affects the size of photocurrents, whereas the “hot” carriers resulting from the acoustic-phonon bottleneck play a role in the generation of photothermoelectric effects.
In the presence of a field gradient, photoexcitation of graphene can produce a photocurrent, which can be used in a number of optoelectronic applications. As a photodetector, graphene has the advantages of having a very wide absorption range, having a fast time response due to the high mobilities of both electrons and holes, being a thin and low-cost material, and having the ability to operate at ambient temperature. The required electric field could be simply produced by applying a voltage bias. However, because graphene does not have a bandgap, this would produce a sizable dark current, leading to heating and excessive shot and thermal noise.
For these reasons, the use of internal fields is desirable for photodetection. Such fields are present at metal–semiconductor junctions (Schottky junctions). These junctions form naturally at metal–graphene contacts as a result of work-function differences between the two materials,Reference Xia, Perebeinos, Lin, Wu and Avouris20 or they can be formed by, for example, differential doping of grapheneReference Farmer, Golizadeh-Mojarad, Perebeinos, Lin, Tulevski, Tsang and Avouris65 or fabrication of split-gate devices.Reference Williams, DiCarlo and Marcus66 The carriers are driven by the potential gradient at the p–n junctionReference Lee, Balasubramanian, Weitz, Burghard and Kern67–Reference Mueller, Xia, Freitag, Tsang and Avouris70 and by photothermal effects (PTEs),Reference Xu, Gabor, Alden, van der Zande and McEuen71–Reference Gabor, Song, Ma, Nair, Taychatanapwat, Watanabe, Taniguchi, Levitov and Jarillo-Herrero73 which can arise because of laser-induced heating and the difference in Seebeck coefficients, S, of the two differently doped sides, V PTE = (S 2 – S 1)ΔT. Even in the case of photothermal effects, the response can be fast because the hot carriers (T e > T lattice) produced by the acoustic-phonon bottleneck, which transport the heat, have a much lower heat capacity than phonons.Reference Song, Rudner, Marcus and Levitov72
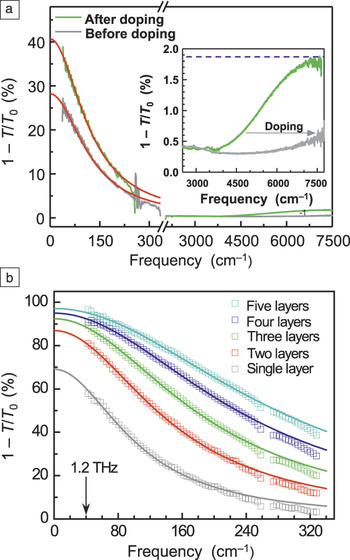
So far, we have focused on the spectral properties of graphene arising from interband transitions. In the far-infrared and terahertz regions, however, intraband transitions or free-carrier absorption dominates. The frequency dependence of the free-carrier response in graphene can be adequately described by the Drude model of metallic absorption, in which the dynamical conductivity at angular frequency ω is given by  $\sigma (\omega) = iD/[\pi (\omega + i\Gamma)]$, where D is the Drude weight and Γ is the carrier scattering width. Figure 6a shows near- and far-infrared extinction spectra (in terms of 1 – T/T 0, where T and T 0 are the transmissions through graphene and the reference substrate, respectively) of CVD graphene and the different effects that chemical (or electrostatic) doping have on these two regions of the graphene absorption spectra. Analysis of the light extinction in the Drude regime can provide the dynamical conductivity at optical frequencies, the degree of doping (through Pauli blocking), and the carrier mobility (through the scattering rate).Reference Yan, Xia, Zhu, Freitag, Dimitrakopoulos, Bol, Tulevski and Avouris74 In addition to the single-particle interband and intraband excitations of graphene, its collective excitations (i.e., plasmons) are interesting and of technological importance. Graphene can sustain surface plasmons (SPs) propagating along its surface. Because of the different light and plasmon dispersions, the SPs cannot be excited directly by light.Reference Koppens, Chang and García de Abajo76 However, SP excitation can be achieved by patterning graphene lithographically.Reference Yan, Li, Chandra, Tulevski, Wu, Freitag, Zhu, Avouris and Xia75, Reference Ju, Geng, Horng, Girit, Martin, Hao, Bechtel, Liang, Zettl, Shen and Wang77
Transmission extinction of graphene, expressed as 1 – T/T 0, where T and T 0 are the transmissions through graphene on the substrate and through the substrate only, respectively. (Frequency is expressed in wavenumbers [cm–1], with 1 THz ≈ 33.3 cm–1. In terms of equivalent energy, 1 eV ≈ 8000 cm–1.) (a) Near-infrared (right side) and far-infrared (left side) absorption spectra of CVD graphene as transferred onto quartz (gray) and after chemical doping with (C2H5)3OSbCl6 (green). The fit of the data to the Drude model is shown in red. Inset: Expansion showing the effect of doping (Pauli blocking) on the near-infrared spectrum. The blue line shows the 1.9% universal absorption, as corrected for the refractive-index mismatch with quartz. Part (a) reproduced with permission from Reference Reference Yan, Xia, Zhu, Freitag, Dimitrakopoulos, Bol, Tulevski and Avouris74. ©2011, American Chemical Society. (b) Transmission extinction in the terahertz range of CVD graphene superlattices with one, two, three, four, and five layers of graphene. The extinction scales with the number of layers at the higher frequencies, but not at low frequencies. Solid lines are fits to Drude conductivity. Part (b) reproduced with permission from Reference Reference Yan, Li, Chandra, Tulevski, Wu, Freitag, Zhu, Avouris and Xia75. ©2012, Nature Publishing Group.

Research into plasmonics based on noble-metal nanoparticles is highly active and advancing rapidly (as discussed in detail in the August 2012 issue of MRS Bulletin),Reference Halas, Lal, Chang, Link and Nordlander78 yet graphene offers new opportunities and advantages in plasmonics. These are associated with the extreme confinement, longer SP lifetimes,Reference Koppens, Chang and García de Abajo76 and longer propagation distances in graphene and, most importantly, with the unique ability to tune the carrier density in graphene electrostatically or chemically.
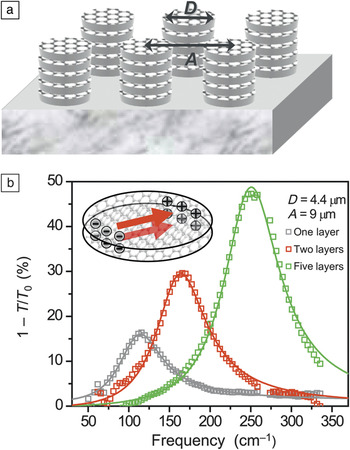
In patterned graphene structures, strong light–graphene coupling can be used to enhance and tune the optical properties. Both two-dimensional graphene disk arrays and multilayer graphene stacks (superlattices) have been demonstrated that, although transparent in the visible range, can screen out terahertz radiation by means of the plasmons of the ensemble of these layers.Reference Yan, Li, Chandra, Tulevski, Wu, Freitag, Zhu, Avouris and Xia75 These devices were formed by depositing alternating wafer-scale sheets of graphene and thin layers of insulating polymer and then patterning them all together into photonic-crystal-like structures of arrays of columns of circular dots (see Figure 7a).Reference Yan, Li, Chandra, Tulevski, Wu, Freitag, Zhu, Avouris and Xia75 It was shown that, as a result of the carrier-concentration scaling law of the plasmonic resonances of Dirac fermions, distributing the carriers into multiple layers strongly enhances the plasmonic resonance frequency and dynamical conductivity at resonance to that obtained by doping single-layer graphene. These structures allowed the construction of widely tunable far-infrared notch filters (see Figure 7b), terahertz linear polarizers, and phase shifters. An unpatterned five-layer graphene stack can shield up to 97.5% of the incident electromagnetic radiation below 1.2 THz (see Figure 6b).
(a) Schematic illustration of the structure of plasmonic graphene/insulator disk stacks arranged in a triangular lattice, showing the disk diameter, D, and the array lattice constant, A. The graphene plasmonic stacks were formed by patterning the graphene layers into microdisks. (b) Extinction in transmission of plasmonic stacks with one, two, and five graphene layers. Inset: A schematic illustration of dipole coupling in two closely spaced graphene disks, which enhances both the magnitude and frequency of the plasmon resonance. Reproduced with permission from Reference Reference Yan, Li, Chandra, Tulevski, Wu, Freitag, Zhu, Avouris and Xia75. ©2012, Nature Publishing Group.

Recent work explored the behavior of these patterned graphene plasmons in a high magnetic field.Reference Yan, Li, Li, Zhu, Avouris and Xia79 It was shown that the initial plasmon resonance splits into two, with an energy splitting proportional to the strength of the magnetic field. This effect provides an additional tuning mechanism for the plasmonic absorption of graphene. What is particularly intriguing is that the field tunes not only the energy but also the lifetime of the split plasmons, increasing the lifetime of the lowest-energy branch (edge plasmon) and decreasing the lifetime of the high-energy branch (bulk plasmon).Reference Yan, Li, Li, Zhu, Avouris and Xia79
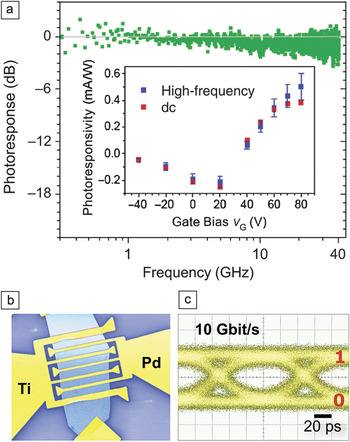
In terms of active optoelectronic devices employing graphene, the first demonstration of a graphene photodetector was based on a metal–graphene contact. In that case, a metal–graphene junction was irradiated by light in the infrared and visible spectrum.Reference Xia, Mueller, Lin, Valdes-Garcia and Avouris80Figure 8a shows the measured ac photoresponse of a simple junction detector to a 1.55-μm intensity-modulated light beam. A nearly constant response was observed up to 40 GHz, which was the upper frequency limit of the measurement system. Modeling, however, suggests that, eventually, the detector response will be limited to about 0.6 THz by the RC time constant required to charge the device capacitance C through its series resistance R.Reference Xia, Mueller, Lin, Valdes-Garcia and Avouris80
(a) Relative ac photoresponse of a single-contact graphene photodetector as a function of the light-intensity modulation frequency. No degradation of response is seen up to 40 GHz, except for a small degradation of about 1 dB caused by the microwave probes. Inset: Peak dc and high-frequency (ac) photoresponsivities as functions of gate bias. Part (a) reproduced with permission from Reference Reference Xia, Mueller, Lin, Valdes-Garcia and Avouris80. ©2009, Nature Publishing Group. (b) Interdigitated electrode photodetector based on two different metals: one with a high work function (palladium) and one with a low work function (titanium). This configuration allows enhanced photocurrent generation with full device illumination. (c) Standard receiver “eye diagram” obtained using the interdigitated graphene photodetector to test the detection of optical data streams. The completely “open eye” at a transmission rate of 10 Gbit/s indicates that, at this data rate, there is a time window in which the levels of a digital 1 and 0 can be reliably distinguished. Parts (b) and (c) reproduced with permission from Reference Xia, Mueller, Lin, Valdes-Garcia and AvourisReferenceReference Mueller, Xia and Avouris81. ©2010, Nature Publishing Group.

In a symmetric device, simultaneous illumination of both contact regions would produce equal but opposite polarity currents and, therefore, no net photocurrent. The improved design shown in Figure 8b provides a significantly increased photoresponse and allows the full surface of the device to be used for photodetection.Reference Mueller, Xia and Avouris81 This device utilizes interdigitated metal electrodes made of two different metals, one with a high work function and the other with a low work function. These two different work functions produce different doping and band bending in graphene that allows photodetection over the entire area of the device. Photodetectors of this design were shown to reliably detect optical data streams of 1.55-μm light pulses at a rate of 10 Gbit/sReference Mueller, Xia and Avouris81 (Figure 8c).
Because of the high electron–hole recombination rate in graphene, the photoresponse of graphene detectors is generally modest. To further increase the photoresponse, a number of different approaches have been employed. In one case, enhanced light absorption and photocurrent generation were achieved through excitation of the plasmons of gold nanoparticles deposited on graphene.Reference Echtermeyer, Britnell, Jasnos, Lombardo, Gorbachev, Grigorenko, Geim, Ferrari and Novoselov82 Another approach involves incorporating graphene inside planar Fabry–Perot microcavities. In one such study, two semitransparent metallic mirrors defined the resonant cavity, and the graphene was placed at the position of the maximum field, leading to a 20-fold enhancement of the photocurrent at the resonant wavelength.Reference Engel, Steiner, Lombardo, Ferrari, Loehneysen, Avouris and Krupke83 Another study utilized multilayer Bragg reflectors to enhance the reflectance and reported 60% absorption at a resonance wavelength of 850 nm.Reference Furchi, Urich, Pospischil, Lilley, Unterrainer, Detz, Klang, Andrews, Schrenk, Strasser and Mueller84 Most recently, yet another enhancement approach involving the deposition of semiconductor (PbS) quantum dots on graphene was reported.Reference Konstantatos, Badioli, Gaudreau, Osmond, Bernechea, de Arquer, Gatti and Koppens85
The ability to modulate the Fermi level of graphene by a gate field naturally leads to its application as a fast electroabsorption modulator.Reference Liu, Yin, Ulin-Avila, Geng, Zentgraf, Ju, Wang and Zhang86 High-speed, small-footprint, and high-bandwidth modulators are highly desirable for optical communications. However, although the interaction of light with graphene is strong considering how thin graphene is, the absorption of a perpendicular light beam by a single graphene layer is insufficient. For this purpose, graphene was integrated with a silicon waveguide to increase the absorption of light traveling parallel to the graphene sheet, and modulation of the guided light by 0.1 dB/μm (from 1.35 μm to 1.6 μm) at frequencies over 1 GHz was demonstrated.Reference Liu, Yin, Ulin-Avila, Geng, Zentgraf, Ju, Wang and Zhang86 An alternative modulator design involving bilayer graphene has also been successfully demonstrated.Reference Liu, Yin and Zhang87
Saturable absorption describes the condition whereby the absorption of light by a material decreases with increasing light intensity. Most materials show some saturable absorption, but often only at very high optical intensities (close to the optical damage threshold). Saturable absorbers are used in laser cavities for mode locking and Q switching. With its wide absorption range, fast decay, and high stability, graphene is well-suited for this application and indeed has been successfully used to produce picosecond laser pulses.Reference Bao, Zhang, Wang, Ni, Yan, Shen, Loh and Tang88, Reference Sun, Hasan, Torrisi, Popa, Privitera, Wang, Bonaccorso, Basko and Ferrari89
Conclusions
In summary, graphene is a unique two-dimensional material that offers a wide range of opportunities for applications in electronics and photonics. Key factors are its excellent transport properties and its strong optical response over a very wide wavelength range, especially in the far-infrared and terahertz ranges. Graphene also has the properties of ultimate thinness, flexibility, and mechanical strength in its favor. High-frequency electronic devices and circuits have been successfully demonstrated, as have optoelectronic devices such as fast photodetectors; modulators; and passive optical components such as polarizers, notch filters, and mode lockers. Graphene fabrication can be inexpensive, as carbon is an abundant material and its two-dimensional character allows nanofabrication techniques, already developed in planar silicon technology, to be directly applied. However, significant improvements of the material itself are still required, such as structural homogeneity, layer control, and controllable and stable chemical doping. Better metal contacts and compatible insulators are highly desirable, and performance improvements such as the voltage gain of electronic devices are necessary. Although this article describes only a narrow selection of applications of graphene in electronics and photonics, more innovations that take advantage of the unique properties of graphene are expected in the future.
Acknowledgments
The authors are grateful to Bruce Ek and Jim Bucchignano for technical assistance; Yu-ming Lin, Yanqing Wu, Hugen Yan, Christos Dimitrakopoulos, Alberto Valdes Garcia, Marcus Freitag, Thomas Mueller, Vasili Perebeinos, Mathias Steiner, Wen-juan Zhu, and Xuesong Li for helpful discussions; and the Defense Advanced Research Projects Agency (DARPA) for partial financial support through the Carbon Electronics for RF Applications (CERA) program (Contract FA8650-08-C-7838).