1 Introduction
There are two trills present in the Czech language, represented orthographically as /r/ and /ř/. The transcription of the latter sound has been controversial, having been examined by many researchers over the last century. Dvořák (Reference Dvořák, Staroverov, Altshuler, Braver, Fasola and Murray2010) notes that its earliest IPA transcription was [ɼ], denoting a voiced strident apico-alveolar trill – a symbol still occasionally used by the Prague School of linguists. Instrumental phonetic studies have resulted in a number of varying analyses, ranging from an alveolar trill with a lower tongue body and tighter tongue tip constriction than contrasting /r/ (Hála Reference Hála1923), to a laminal trill [
 ] (Ladefoged & Maddieson Reference Ladefoged and Maddieson1996). Since 1989, however, /ř/ has appeared in the IPA as a raised-alveolar trill denoted by the symbol [
 ] (Dankovičová Reference Dankovičová1997). All of these descriptions focus on tongue position as the primary factor distinguishing these trills.
Despite this primary focus on tongue position, a number of laryngeal properties and factors relating to tongue tip vibration (specifically, the number of contacts and degree of constriction) of /ř/ have been observed, even though they have been largely absent from current and previous IPA transcriptions. Dankovičová (Reference Dankovičová1997) describes /ř/ as characteristically different from the Czech trill /r/ in respect to increased velocity of airflow and to the number of vibrations of the tongue. Specifically, she notes that /ř/ vibrates 1–2 times more than /r/, which is stated to vibrate from 1 to 3 periods. Skaličková (Reference Skaličková1974) further describes a difference in voicing assimilation properties between /r/ and /ř/, and Dvořák (Reference Dvořák, Staroverov, Altshuler, Braver, Fasola and Murray2010) confirms Vachek's (Reference Vachek1963) assertion that /ř/ exhibits voicing assimilation behavior that is at odds with the otherwise predictable voicing and assimilation rules of Czech: it takes part in regressive and progressive voicing, always agreeing with adjacent consonants. It also induces regressive voicing across a word boundary, causing underlyingly voiceless obstruents to voice. Furthermore, /ř/ does not have a contrastive voiceless counterpart (Grepl & Hladká Reference Grepl and Hladká1995).
Ladefoged & Maddieson (Reference Ladefoged and Maddieson1996) cite /ř/ as the only regularly occurring trill produced with the tongue blade. Based on palatograms and linguograms published by Hála (Reference Hála1923), they describe /ř/ as ‘[having] a narrow open channel at the center of the mouth, formed further forward than the contrasting /r/’ (Ladefoged & Maddieson Reference Ladefoged and Maddieson1996: 233). They further concur with Short (Reference Short and Comrie1987), who describes /ř/ as a ‘rolled post-alveolar fricative,’ in that /ř/ can be trilled and exhibits non-‘ʒ’-type frication. They make the additional claim that ‘this sound is usually a sequential combination of a trill and a fricative’ (page 229), with the frication being ‘a distinctive whistle-type of relatively narrow-band noise’ (page 229), with some speakers only producing the fricative portion. In the section of the book where Ladefoged & Maddieson (Reference Ladefoged and Maddieson1996: 228–230, 233) discuss Hála's findings, possibly in line with their mention of the occurrence of a trill-less /ř/, they switch from their earlier laminal transcription, [
] (page 230), to an approximant one, [
 ] (page 233, Figure 7.15), a classification that is absent from Hála's description. In spite of its remarkable detail, Hála's study is limited in that it is based on a single speaker (Hála himself) recorded nearly a century ago. For a translation of Hála's (Reference Hála1923) section on /r/ and /ř/, see the Appendix.
Cross-linguistically, rhotic trills pattern together in phonological systems and with other liquids (sounds like /l/ and /ɹ/) (Walsh-Dickey Reference Walsh-Dickey1997). Proctor (Reference Proctor2009) suggests that a large number of the phonological phenomena associated with liquids in Spanish and Russian might be a result of shared sonorant properties inherent in articulation which involves continuous, non-turbulent airflow in the vocal tract. This study attributes the difference among rhotics to variation in the stiffness and degree of damping of tongue tip and tongue body gestures associated with a more constrained tongue dorsum. This requires a more complex conditioning of the tongue tissue in order to adjust the tension and inertia required in the part of the tongue that vibrates. There is also a requirement to adjust for the correct pressure and air flow conditions required to allow vibration to occur (McGowan Reference McGowan1992; Barry Reference Barry1997; Solé Reference Solé, Gussenhoven and Warner2002a, Reference Soléb; Iskarous & Kavitskaya Reference Iskarous and Kavitskaya2010).
Thus, the literature encompasses a wide range of possible factors that might contribute to a distinction between the Czech trills. For the purposes of the present study, we group these broadly into lingual and laryngeal characteristics. Consideration is also given to the possibility of time-course changes in /ř/ to reflect the sequential sound combination proposed by Ladefoged & Maddieson (Reference Ladefoged and Maddieson1996). In addition, in view of the very small number of speakers included in previous studies and the wide variance across available descriptions, it is likely that these sounds may be subject to substantial variation by geographic region, individual speaker, and position within a word. The present paper examines all of these factors in an attempt to better understand the distinction between these trills and to clarify their IPA transcription. Issues relating to tongue position are investigated in Section 2 using lingual ultrasound imaging, while laryngeal characteristics are measured in Section 3 using electroglottography (EGG) and acoustic analysis.
2 Experiment 1: Lingual characteristics
The present analysis aims to test whether there are distinct and consistent tongue positions associated with the articulation of /r/ and /ř/, and the extent to which these are subject to systematic variation. In order to accomplish this task, we use ultrasound imaging to record and compare the production of /r/ and /ř/ among our participants.
Lingual ultrasound imaging has been used extensively in phonetics in order to obtain information about the tongue during speech production, both in the laboratory and in the field (see Gick Reference Gick2002). It allows two-dimensional (B-mode) imaging, which is able to show the complete mid-sagittal tongue contour on a single plane, as well as ‘movement’ mode (M-mode) imaging, which shows a one-dimensional intersect line plotted over time. Some models even permit three-dimensional imaging. The use of ultrasound for speech production has improved with technology and has been used increasingly since ultrasound devices were first introduced in medical settings (Kelsey, Woodhouse & Minifie Reference Kelsey, Woodhouse and Minifie1969; MacKay Reference MacKay1977; Sonies et al. Reference Sonies, Shawker, Hall, Gerber and Leighton1981; Stone et al. Reference Stone, Morish, Sonies and Shawker1987, Reference Stone, Shawker, Talbot and Rich1988, Reference Stone, Faber, Raphael and Shawker1992; Gick, Bird & Wilson Reference Gick, Bird and Wilson2005, among others).
2.1 Experiment 1: Introduction
Experiment 1 uses ultrasound to image the tongue, extracting tokens of both /r/ and /ř/ produced by a number of speakers, and using traced contours of the tongue surface to compare their respective tongue height. In the previous studies, little attention was given to specifying the number of participants or the words used for elicitation; for this reason, over-generalization of data could have contributed to the varying characterizations. In order to avoid such pitfalls, our paper tests for three types of variation: (i) individual variation between speakers, (ii) variation across word positions, and (iii) time-course variation within the production span of /ř/. Overall, the aim of the first experiment is to characterize the role of tongue height in the production of /r/ and /ř/ and, where possible, to explicate contradictions found in the literature in light of these forms of variation.
2.2 Method
2.2.1 Subjects
Ten speakers of Czech participated in this study. There were four male speakers and six female speakers. Their mean age was 40 years at the time of the study.
The Czech speakers were recruited from the Czech community in Vancouver, British Columbia. This was done on the basis of their native language (Czech), language spoken at home (Czech), and place of birth (Czech Republic). All of the speakers had spent, at minimum, the first twenty-five years of their life in the Czech Republic, with the exception of one speaker, who left the Czech Republic at the age of five but spoke Czech daily at home throughout his development. The speakers cover three major regional dialects in Czech (Common Czech, Mid-Moravian and Seleszian), covering most of the regions of the Czech Republic. One of the subjects failed to produce /r/, despite being able to produce /ř/. This speaker produced something closer to a uvular fricative, /ʁ/; therefore, his data were discarded from the results.
2.2.2 Stimuli
The stimuli tokens used were all real words, rád ‘like’, řád ‘order’, paráda ‘great’, pařát ‘talon’, tvar ‘shape’, and tvář ‘face’, which capture both of the trills across all major word positions, #rV, VrV, and Vr# (word-initial, intervocalic and word-final). The tokens were presented using PowerPoint, with individual words appearing at the center of the screen and cycling at three-second intervals. They were grouped into a series of all six tokens in a pseudo-random order for a total of 200 tokens altogether.
2.2.3 Equipment
The apparatus used for imaging the tongue was an Aloka Pro sound SSD-5000 ultrasound machine with a 180-degree EV probe, used with a gel spacer to reduce potential interference with jaw movement. Audio was recorded with a Sennheiser MK66 short shotgun microphone, and video and audio were fed through Canopus ADVC-110 advanced digital video recorder into iMovie on a MacPro.
2.2.4 Procedure
Participants sat in a modified ophthalmic examination chair with a two-point headrest to reduce head movement and a mechanical arm to hold the ultrasound probe firmly in a fixed position against the neck just below the chin. The current project made use of simultaneous B- and M-mode ultrasound imaging. B-mode images were taken along both the mid-sagittal and the coronal plane (in different trials) at standard video rate (29.97 frames per second (fps)). M-mode images tracked fast movements (such as the periodic displacement associated with trilling) of the tongue tip and blade along a single intersect line over time. This was taken at standard video rate (29.97 fps), but because of the nature of the M-mode (showing a single line plotted over time), it allowed for each frame to show not only the position of the tongue tip at that particular sample, but also the tongue movements between samples. This allowed the vibrations characteristic of trills to be captured with ultrasound technology. A Sennheiser microphone was mounted on a microphone stand and placed approximately eight inches from the participant's mouth. A computer monitor was placed about 1.5 m in front of the participant. The PowerPoint slides were then played for the participant to read aloud. Coronal section images were taken first, then the probe was turned 180 degrees for mid-sagittal images and the PowerPoint slides were replayed. The M-mode intersect line was moved at 10-degree intervals to capture the entire tongue. After cycling through the entire tongue three times at 10-degree intervals, the tongue tip was the focus for the remainder of the repetitions. The total number of repetitions was 13 complete cycles. The coronal results are not discussed further in this paper as we cannot ensure that they were taken at the same point on each speaker's tongue.
2.2.5 Analysis
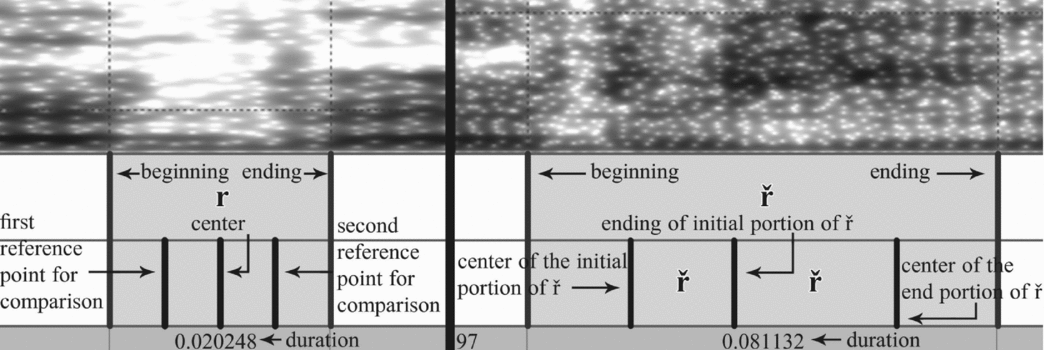
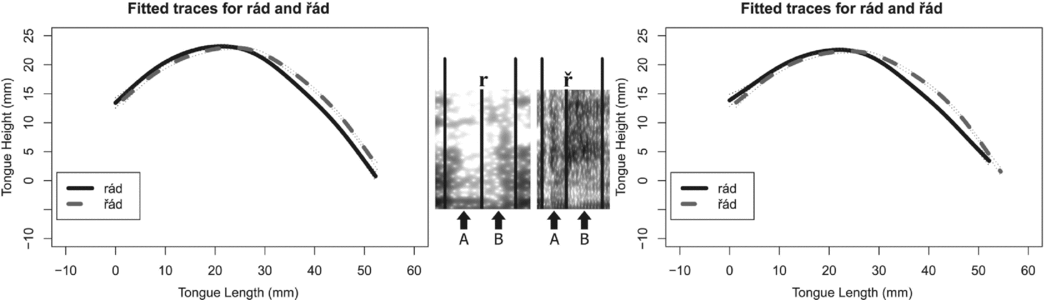
Quicktime Pro software was used to extract sound files from the recorded A/V files. The sound files were then opened in Praat (Boersma Reference Boersma2001), which was used to tag the duration of the target trills /r/ and /ř/, and to identify mid-points. In order to analyze the time-course variation of /ř/, each token was divided into two segments. For some subjects, the tokens of /ř/ exhibited a qualitative distinction between the initial portions and ending portions in their spectrographic representations; in these cases, a marker was placed at the transition between these two sections. In the tokens where there was no qualitative distinction, the segmentation was done at the midpoint of the entire sound and data were taken from the mid-point of each segment. To form a control set, /r/ tokens were also divided in half and the center points of each half were marked (see Figure 1).
Text-grids marking ultrasound measurement points for /r/ (left) and /ř/ (right).

Video was then loaded into Elan and the Praat text-grid was imported. Ultrasound images were exported at all marked center points and stored on a PC. EdgeTrak software (Li, Kambhamettu & Stone Reference Li, Kambhamettu and Stone2003, Reference Li, Kambhamettu and Stone2005) was then used to identify the tongue contours. For both /r/ and /ř/, the first image was taken during or directly after the first contact, while the second image for /r/ was taken after the trilling was complete, and the second image for /ř/ was taken at the mid-point of frication after the completion of trilling (labelled center of the ‘end portion of ř’ in Figure 1). Tongue contour values were copied to Excel and saved as a .txt file, then R statistical software was used to run the SSANOVA (smoothing spline analysis of variance) script to compare tongue contours (Davidson Reference Davidson2006). The smoothing spline ANOVA (Gu Reference Gu2002) employs a statistical method to compare the entire tongue curve. It shows where statistically significant areas of interests are when comparing tongue contours (Davidson Reference Davidson2006). The dotted lines represent 95% confidence intervals, so that the graphs can be interpreted as showing a statistically significant difference in areas where dotted lines for different tongue shapes do not overlap. Contours of /r/ and /ř/ were compared in all the corresponding word positions (word-initially, intervocalically, and word-finally).
2.3 Ultrasound results
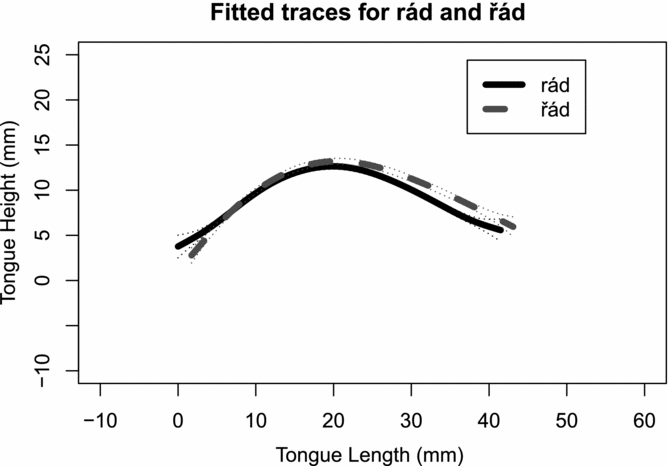
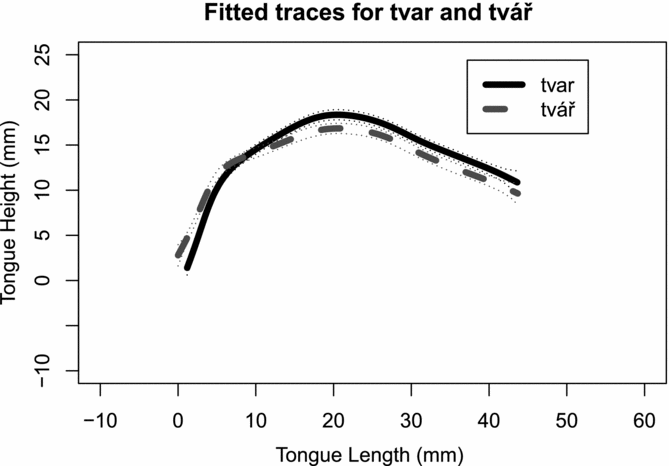
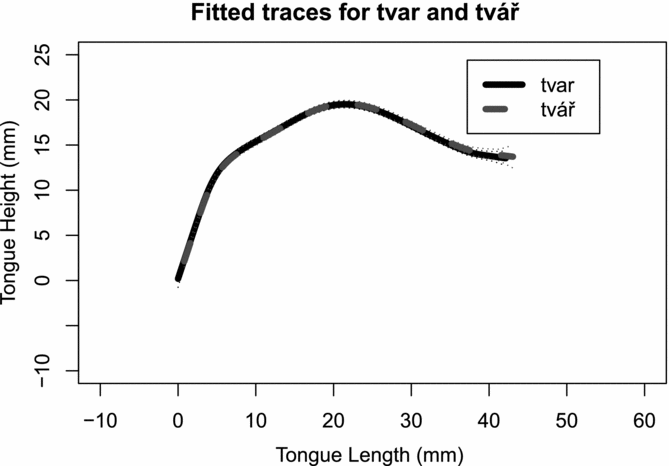
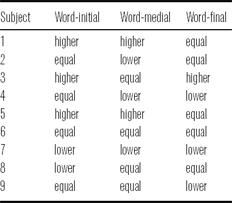
Sagittal results in tongue position patterns for /ř/ were categorized into three distinct sets based on comparison with the contrasting trill /r/: higher, lower, and no significant difference. The data were analyzed for each group separately. The three groups, which will be discussed later, represent speakers who exhibited a higher or lower tongue position for /ř/ than for contrasting /r/, or for whom there was no significant difference in tongue height between the two trills. Representative examples of each type are shown in Figures 2–4, and results by subject are given in Table 1.
Tongue contour for Subject 3 where the speaker's tongue body is higher during production of /ř/ than /r/. The dotted lines surrounding the tongue contours indicate the 95% confidence intervals.

Tongue contour for Subject 7 where the speaker's tongue body during production of /ř/ is lower than /r/. The dotted lines surrounding the tongue contours indicate the 95% confidence intervals.

Subject 6 showing no significant difference between /ř/ and /r/. The dotted lines surrounding the tongue contours indicate the 95% confidence intervals.

Production patterns of /ř/ as compared to /r/ across subjects and word positions.

For the speaker in Figure 2, SSANOVA results show that the tongue body for /ř/ is significantly higher during the production of řád than the contrasting /r/, while the tongue dorsum and root show no significant difference between the two trills. This type of pattern was typical for speakers who exhibited tongue position higher for /ř/ than for /r/.
Figure 3 shows an example where the tongue body for /ř/ is significantly lower than that for /r/, while tongue position is essentially identical for the two articulations shown in Figure 4.
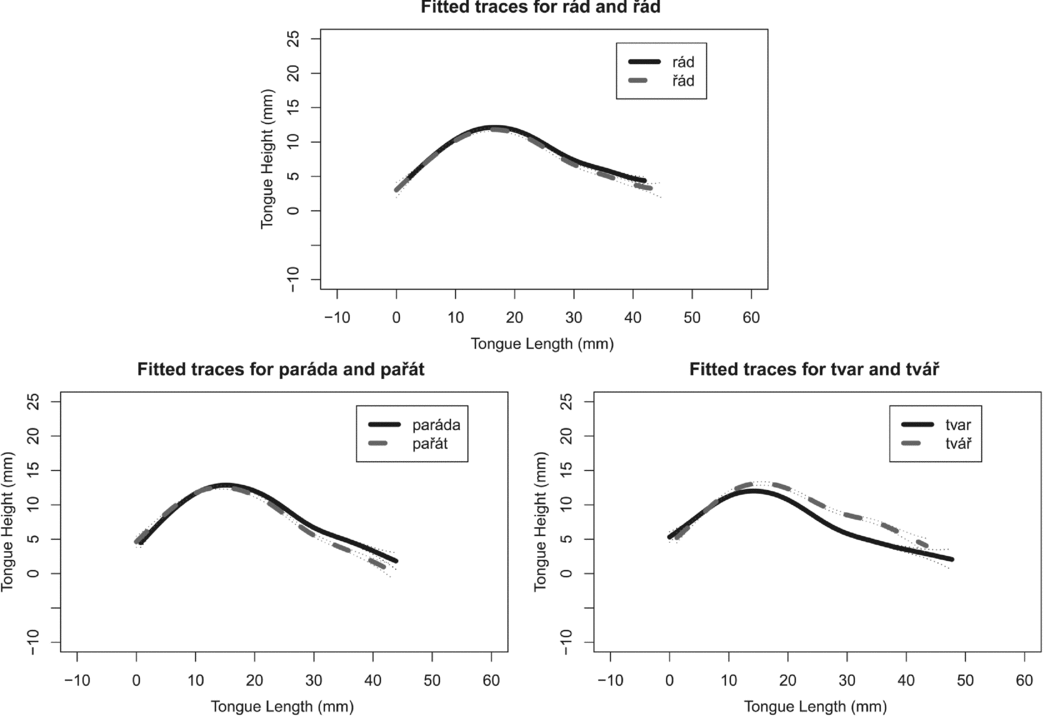
As is clear from Table 1, most speakers showed significant difference in tongue height between /r/ and /ř/ across word positions. An example of this is shown in Figure 5.
Variation in tongue height in a single speaker (Subject 4) across word positions: rád ‘like’ vs. řád ‘order’, paráda ‘great’ vs. pařát ‘talon’, and tvar ‘shape’ vs. tvář ‘face’. The dotted lines surrounding the tongue contours indicate the 95% confidence intervals.

The above results show, tongue height differences for /ř/ vary by individual speaker, and by the position of /ř/ in the word.
Figure 6, which shows contours extracted at 25% and 75% into the production of /r/ and /ř/, illustrates that, despite the apparent shift in acoustic properties partway through the /ř/ sound, there is no significant time-dependent change in tongue position during the course of articulation. This suggests that the difference seen in the spectrogram is not due to a change in tongue position. This pattern holds true for all subjects.
Marked spectrogram showing time points of articulation and accompanying tongue traces for Subject 1. The dotted lines surrounding the tongue contours indicate the 95% confidence intervals.

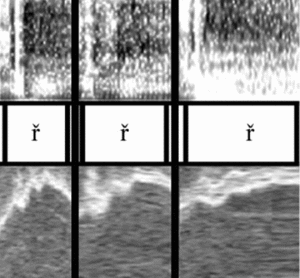
M-mode imaging allowed us to plot the change over time in tongue position through a single intersect line normal to the tongue surface. The primary location of interest was the tongue tip, although M-mode ultrasound was also measured at various places along the tongue body. The images in Figure 7 illustrate that the trilling seems always to occur during the frication portion of /ř/. The images show tongue tip vibration over the course of the production of /ř/ in word-initial, intervocalic and word-final positions. The top of the figure shows the spectrograph, while the bottom of the image shows the M-mode results. The white line seen in the M-mode images is the air just above the tongue surface, and thus tracks the location of the tongue surface over time.
M-mode imaging examples of tongue tip trilling for /ř/ during: řád ‘order’ (A), pařát ‘talon’ (B), and tvář ‘face’ (C), Subject #1. The top image shows the spectrograms for /ř/ in the three words mentioned in the previous sentence. The bottom image shows the M-mode image of the tongue tip during that time. The thick white line that can be seen shows the surface of the tongue, while the bumps indicate vibration of the tongue tip.

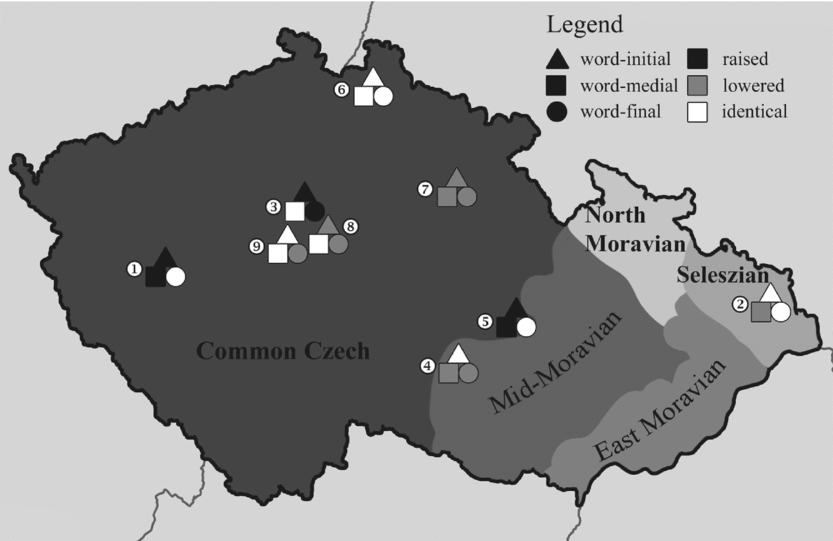
The map in Figure 8 plots the different speakers in the study according to their birth regions, denoting the different pattern they use across all word positions. There appears to be no regional consistency across speakers, although there is a great deal of variation across word positions within each speaker, as was evident from Table 1.
Dialectal plotting of tongue position patterns employed in the study (Speakers 1, 3, 5, 6, 7, 8, 9: Common Czech; Speaker 4: Mid-Moravian; Speaker 2: Seleszian). Plotted shapes correspond to word position: triangle = word-initial, square = word-medial, circle = word-final; tongue body height of /ř/ relative to /r/ is shown via colors, with black, grey and white showing higher, lower and no significant difference, respectively (map adapted from Cvrček Reference Cvrček2010).

2.4 Discussion of ultrasound results
Contrary to the dominant stance in the literature and the current IPA transcription (see Dankovičová Reference Dankovičová1997), our results indicate that tongue position, and specifically tongue height, does not appear to be a decisive factor distinguishing /r/ and /ř/. While some individuals exhibited a raised tongue position over the duration of /ř/ compared to /r/, many others demonstrated strategies with lowered tongue position or no significant difference. Variation was also noted within individuals across different word positions, with perhaps a slight tendency for /ř/ to show a higher tongue position in word-initial position than in word-medial or word-final position. Due to the lack of systematic regional variation, the data further suggest that the variation found is not dialectal. These findings lend further credence to the suggestion that previous characterizations of /ř/ based on a small number of speakers are unlikely to be representative of the general population.
These tongue position results are consistent with the view that the inconsistencies in the previous literature are the result of over-generalization of data from a small number of speakers, or from tokens produced in different word positions. Previous studies do not specify subject information or the exact tokens tested, making it impossible to determine definitively the origin of the problem.
It was also shown that relative tongue height does not change over the duration of a given sound for a given speaker, in turn suggesting that there is no transition in tongue position happening over the time-course of /ř/ that could account for the perceived segmenting of the sound. This supports Ketner's (Reference Ketner2005) conclusion that this trill is not a sequential combination of /r/ and /ʒ/. Further, the co-occurrence of trilling and frication throughout the entire duration of /ř/ is at odds with the sequencing proposed by Ladefoged & Maddieson (Reference Ladefoged and Maddieson1996). The distinctive acoustic quality associated specifically with the fricated trilling during articulation of /ř/ thus cannot be attributed to a narrower opening achieved by the raising of the tongue because the participants’ data indicate varying degrees of tongue height when compared to contrasting /r/. Speakers did not uniformly exhibit a pattern of raising, which would be expected if a narrower opening was responsible for the frication.
These results indicate that tongue height is not a reliable distinguishing factor, suggesting that it is likely that there exists another important distinction between /r/ and /ř/. The following experiment explores the possibility that the larynx may provide a clearer source for this distinction.
3 Experiment 2: Laryngeal characteristics
The first experiment demonstrates that tongue posture is not consistently differentiated between /r/ and /ř/, and describes some of its variation, including variation by individual, word position, and region. The second experiment seeks an alternative source for the phonetic distinction between these two Czech trills; based on previous descriptions, we proposed that these trills may be distinguished by laryngeal differences.
3.1 Experiment 2: Introduction
Dankovičová (Reference Dankovičová1997) and others have described /ř/ as having greater airflow than /r/. Because Experiment 1 found no reliable tongue position difference between /r/ and /ř/, we hypothesize that this difference in airflow between /r/ and /ř/ is the result of a wider glottal opening. According to Skaličková (Reference Skaličková1974), in some word positions (particularly word-final), this wider glottal aperture results in a fully voiceless allophone of /ř/; we propose that, in word positions where voicing is not entirely lost, the increase in glottal aperture may be realized as breathiness during the trill. We tested this hypothesis using three methods to measure glottal aperture: electroglottography (EGG), spectral tilt and F1. EGG directly measures the degree of closure of the vocal folds; spectral tilt (H1-H2) correlates to the open quotient of the vocal folds (Holmberg et al. Reference Holmberg, Hillman, Perkell, Guiod and Goldman1995); and F1 corresponds to breathiness in vowels (Henderson Reference Henderson1952, Reference Henderson1977; Huffman Reference Huffman1987; Hombert Reference Hombert and Fromkin1978; Bradley Reference Bradley and Bradley1982; Denning Reference Denning1989; among others). This is related to the lack of complete vocal fold closure and an increase in subglottal coupling (Klatt & Klatt Reference Klatt and Klatt1990), resulting in a lowering of F1.
3.2 Method
The method for Experiment 2 was the same as those for Experiment 1, except as indicated below.
3.2.1 Subjects
Two male and four female native Czech speakers participated in this study; with the exception of one speaker, all of these speakers were also subjects in Experiment 1 and were rerecorded on a date separate from Experiment 1. The new subject was a resident of Ostrava in the Czech Republic and does not speak any language other than Czech. She was not included in the ultrasound study because she was only in Canada for a short period of time before returning to the Czech Republic. The mean age of the subjects was 42 years at the time of the study.
3.2.2 Stimuli
Stimuli for Experiment 2 were the same as those in Experiment 1 (see Section 2.2.2 above), with 10 repetitions of each token per subject. The participants from the previous experiment who took part in this experiment were re-recorded in a separate session using the EGG equipment.
3.2.3 Equipment
The EGG investigation was conducted with a Kay Model 6103 electroglottograph. A Sennheiser MK66 short shotgun microphone was used in conjunction with Praat to record and save the audio data files. All data for each subject were collected in one session.
3.2.4 Analysis
Audacity (v. 1.3 Beta) was used to separate the acoustic waveform from the EGG signal in order to do an acoustic analysis of the data. Praat analysis software was used to create text-grids with labels marking time points at 5% into the vowel following /r/ and /ř/. The ending of frication and onset of the following vowel was taken to be the end point for /ř/, while the onset of the vowel after the contact or contacts of the tongue observed on the spectrograms was taken to be the end point for /r/. The EGG signal was analyzed and smoothed using EGG works (Tehrani Reference Tehrani2011). For the spectral tilt measures, Wavesurfer [v. 1.8.5] (Beskow & Sjölander Reference Beskow and Sjölander2009) was used in tandem with a 512-point FFT spectrum to measure the H1 and H2 values. These measurements were taken at 5% into the vowel following the trills. F1 and spectral tilt were taken from the beginning of the following vowel, as it is not possible to measure H1-H2 or F1 during the trills themselves. Tokens without a following vowel, namely in the word-final position, were not included in the analysis. Results were compared statistically using JMP statistical software.
3.3 Results
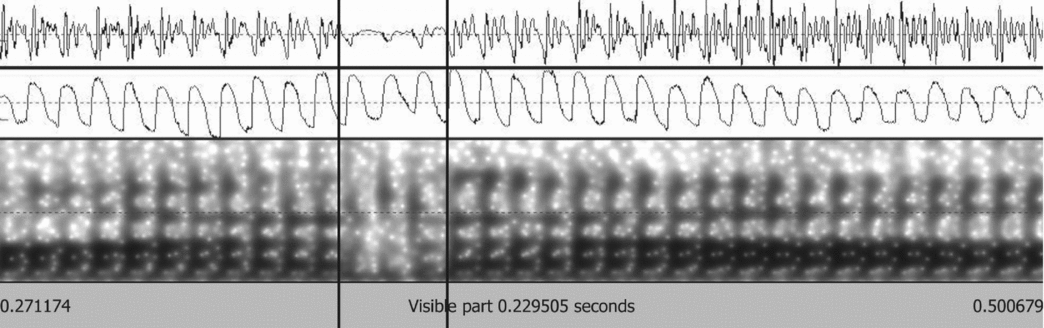
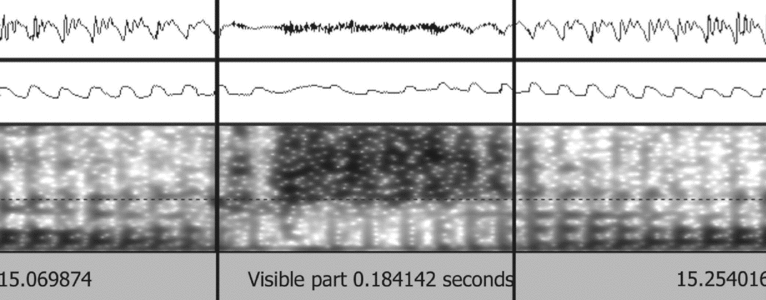
Figures 9 and 10 show examples of typical EGG patterns observed for /r/ and /ř/. One difference that is immediately apparent is the substantially longer duration for /ř/ as compared to /r/, which held across all word positions. The average duration of /ř/ was 78 ms, 71 ms, and 130 ms in intervocalic, word-initial and word-final positions, respectively, while the average duration of /r/ was 19 ms, 22 ms, and 30 ms in the same positions. Very distinct patterns of vocal fold contact were also observed. In Figure 9, /r/ exhibits clear modal voicing, continuous with the modal voice EGG in the preceding and following vowels. The EGG for /ř/, however, exhibits a pattern different from modal voicing, lacking clear peaks or glottal pulses and showing a general decrease in vocal fold closure throughout most of the /ř/.
Waveform, EGG and Spectrogram for the -ará- portion of paráda ‘great’; the section between the two vertical lines delineates /r/.

Waveform, EGG and Spectrogram for the -ařá- portion of pařát ‘talon’; the section between the two vertical lines delineates /ř/.

3.3.1 EGG results
While none of the tokens of /ř/ demonstrated typical modal voicing, observed patterns for /ř/ varied from an open glottis (as shown in Figure 10) to a pattern more obviously typical of breathy voice, with reduced vocal fold contact corresponding to a greater open quotient. Furthermore, both the EGG trace and acoustic wave forms immediately before and after the duration marked as /ř/ in Figure 10 exhibit characteristics associated with breathy voice. Unfortunately, because many of the EGGs for /ř/ entirely lack clear peaks, the open quotient (OQ) cannot be calculated reliably (see Henrich et al. Reference Henrich, Doval, d'Alessandro and Castellengo2000). Therefore, due to the unreliable OQ calculations, we did not utilize them in this analysis.
3.3.2 Acoustic results
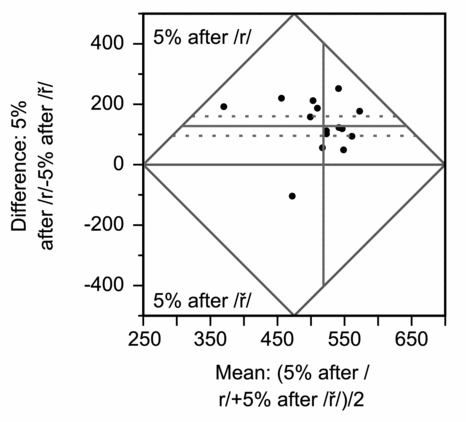
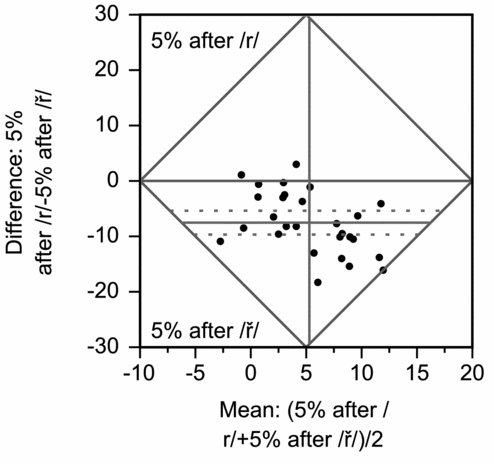
Results for comparison of F1 show a significant difference between /r/ and /ř/. Figure 11 shows the result of the F1 difference for a single subject, using a Student's t-test with a hypothesized mean of zero, represented by the horizontal grey line at 0. The numbers on the y-axis correspond to how different /r/ or /ř/ is from the opposing phoneme. The x-axis corresponds to the means of each matched pair of /r/ and /ř/. The horizontal line represents the mean difference while the dotted horizontal lines represent the 95% confidence intervals. If none of the horizontal lines cross the hypothesized mean of 0 represented by the grey line, the difference between the two phonemes is to be read as significant. All speakers showed this same direction of difference, and all differences were significant (p < .001), indicating a consistently lower F1 for /ř/ than for /r/.
Student's t-test comparing F1 of 5% after /r/ and /ř/.

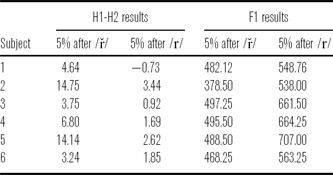
Similar results were found with the spectral tilt (H1-H2) measures at 5% after the trills, as shown in Figure 12. Here, the spectral tilt difference for a single subject is shown, again using a Student's t-test with a hypothesized mean of zero. All speakers exhibited this same direction of difference, and all differences were significant (p < .001), indicating a consistently higher spectral tilt for /ř/ than for /r/. Table 2 shows the average H1-H2 and F1 for all six participants.
Student's t-test comparing H1-H2 5% after /r/ and /ř/.

Average values of H1-H2 and F1 5% after /ř/ and /r/ for each speaker.

The higher H1-H2 for /ř/ correlates strongly with a more open glottis, which is expected given the EGG results. The systematically lower F1 correlates with incomplete vocal cord closure, which is typical of breathy voice and supports both the EGG and the H1-H2 findings.
3.4 Discussion
After the first experiment ruled out tongue height as distinguishing /r/ and /ř/, the EGG and acoustic analyses of Experiment 2 were conducted to test whether the difference between the two trills could be attributed to glottal aperture.
As predicted, the EGG results indicate a significantly more spread glottis over the course of /ř/ in comparison to /r/. The EGG signal indicates little or no closure over the duration of articulation, which is associated with breathy voice (Fischer-Jørgensen Reference Fischer-Jørgensen1967, Bickley Reference Bickley1982, Huffman Reference Huffman1987 and Hillenbrand, Cleveland & Erickson Reference Hillenbrand, Cleveland and Erickson1994). Acoustic measures of spectral tilt and F1 additionally support an interpretation of /ř/ as breathy in comparison with /r/, where modal voicing is maintained throughout. The increased H1 amplitude observed for /ř/ is associated strongly with breathy voice quality (Fischer-Jørgensen Reference Fischer-Jørgensen1967, Bickley Reference Bickley1982, Ladefoged Reference Ladefoged, Bless and Abbs1983, Huffman Reference Huffman1987, Keating et al. Reference Keating, Esposito, Garellek, Khan and Kuang2010).
The overall duration of /ř/ was also found to be longer than that of /r/, in line with its description by Dankovičová (Reference Dankovičová1997). This increased duration may be needed to allow time to initiate tongue anterior vibration, possibly because the weak or absent vocal fold pulses result in reduced coupling between the excitation source and the tongue tip (Dhananjaya, Yegnanarayana & Bhaskararao Reference Dhananjaya, Yegnanarayana and Bhaskararao2012). All indications are thus consistent with our hypothesis for Experiment 2, suggesting that the contrast in the degree of glottal opening constitutes a key point of distinction between /r/ and /ř/.
4 Conclusion
Previous descriptions of Czech /r/ and /ř/ have focused primarily on tongue position as the defining difference between the two trills. The present study measured a much larger subject pool than previous studies, and considered both the lingual and laryngeal properties that have been suggested but not fully explored in earlier studies.
The first part of our study failed to support tongue position as a likely source of reliable distinction between the trills. Rather, variation in tongue position was found to be more associated with variation by word position or individual speaker (but not by region or by time-course during the sounds themselves).
The second experiment used electroglottography and acoustic analyses to evaluate the laryngeal properties of /r/ and /ř/, where significant differences were found. The EGG for /ř/ indicated that the vocal folds were partly or completely open in all word positions, while the EGG signal for /r/ indicated modal voicing throughout the trill. The spectral tilt data confirmed this, with /ř/ exhibiting a significantly higher H1-H2 value. F1 and duration measures further corroborated an interpretation of /ř/ as breathy. While we did find that the more open glottal aperture is associated with the production of /ř/, Experiment 2 did not show significant spectral tilt for /r/. Skarnitzl (Reference Skarnitzl2011) does report an increase in the H1-H2 of fricatives in Czech; it seems that the airflow requirements necessary to produce fricatives in general correspond with a somewhat more open glottis.
Breathy trills are not unique cross-linguistically, with a number of trills in the world's languages having been associated with breathiness. Dialectal variations of Spanish trills include pre-breathiness followed by one or more contacts, which can be transcribed as either [ɦɾ] for the single contact, or [ɦr] for the multiple contacts (Willis Reference Willis, Sagarra and Toribio2006, Willis & Bradley Reference Willis, Bradley, Colantoni and Steele2008). Henriksen & Willis (Reference Henriksen, Willis and Ortega-Llebaria2010) describe a variant of /r/ in Jerezano Spanish which has post-contact frication, and which seems to have a breathy component. Kadenge & Mudzingwa (Reference Kadenge and Mudzingwa2012: 4) describe a ‘breathy voiced trill /
 /’ (4) variant in Shona.
We interpret our results as strongly supporting the position that the action of the vocal folds provides the main difference between the production of the two Czech trills, with /ř/ being characterized by a more open glottis than /r/ throughout. Because at least some voicing is generally maintained throughout the production of /ř/, our data converge on an interpretation of /ř/ as breathy rather than voiceless. Based on these findings, we advocate the use of the symbol [
], denoting a breathy alveolar trill, as a revised IPA transcription for the Czech trill /ř/. We further suggest that phonetic and phonological feature analyses (such as Volín Reference Volín2010) might employ a feature such as [+spread glottis] for /ř/.
Acknowledgements
We would like to acknowledge the few people whose help and support made this paper possible. First and foremost, we would like to thank Jan Černý for getting us in contact with all of the Czech participants, and we extend our gratitude to all of the subjects who took part in our study. We would like to thank the reviewers; their comments significantly improved the overall quality of this paper. We would also like to thank Denise Tom for her technical support and instruction on using the ultrasound device. Finally, we would like to thank Donald Derrick for his technical support and clear instruction on the EGG. This research was funded in part by an NSERC Discovery grant to the third author.
Appendix. Translation of Hála's (Reference Hála1923) section on /r/ and /ř/
19. R in the word ‘pára’
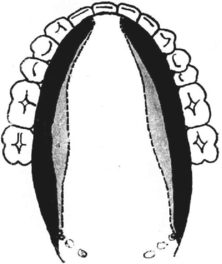
a) Palate. The contact is made along the edges of the soft palate and going along the teeth until the first molars, where it transitions forward along the protruding gum; in the center, the impression is interrupted for the span of 7–8 mm in width (only 4–5 mm during enunciated production; see images 53, 54). The primary place of articulation is the central gum, as can be seen from the image of R with enunciated production (image 53).
R on artificial palate: normal pronunciation (dark) and enunciated production (light).

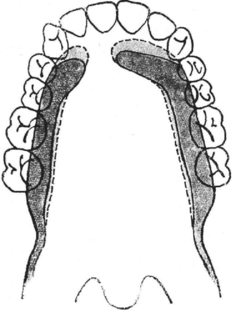
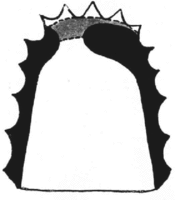
b) The tongue (image 55) adheres to the palate along its edges with the exception of the tip (7–8 mm), which detaches from the palate and vibrates during articulation. The contact is very narrow (4–6 mm) and corresponds to the anterior rugae of the palate.
Palatograms of R and Ř (R = dark area, Ř = light area with a dotted margin).

R and Ř as they appear on the tongue (in image 54).

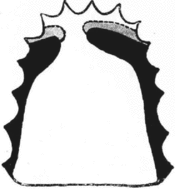
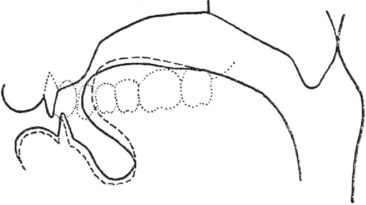
c) Jaw angle = 6 mm; the edges of the upper and lower incisors are separated from each other 1 mm vertically and 2 mm horizontally. The movement of the jaw is very pronounced (image 56).
Cross-section of the mouth during R (dotted line) and Ř (solid line).

d) The lips (image 56) have no effect on articulation. Length of opening = 35 mm, width = 5.5 mm.
20. Ř in the word ‘Mářa’
Ř resembles R, as can be seen from the images of the palate (images 54, 57) and of the tongue (image 55). The primary place of articulation is again on the central gum, although slightly forwarded. (The opening – image 56 – is slightly exaggerated for the purposes of distinction; this opening is in fact only an approximation due to the difficulty of taking its measure using the Atkinson wire.) The larger width of the imprint shows that Ř is articulated with a somewhat greater force than R. A more marked distinction, however, is found in the jaw angle (= 3 mm) and in the position of the teeth: they are separated by 2 mm horizontally and are very close to each other vertically, leaving an opening of barely 1 mm; this means that the lower jaw extends forward by 1 mm.
Lips. Length of opening = 33 mm (smaller than with R), width = 3.5 mm (smaller than with R). The lower lip exhibits minor movement forward.
Note: During enunciated production of Ř, the imprint shifts all the way to the roots of the front incisors, forming a complete closure.
Ř on an artificial palate: normal pronunciation (dark area) and enunciated production (light are).