INTRODUCTION
The radiocarbon (14C) laboratory in Jena, Germany, has already been described in the literature. For example, the accelerator mass spectrometry (AMS) system based on a 3 MV Tandetron accelerator with simultaneous injection of all three carbon isotopes (High Voltage Engineering Europe B.V., Amersfoort, The Netherlands) and its modifications during the years of operation are described in Steinhof et al. (Reference Steinhof, Baatzsch, Hejja and Wagner2001 and references therein). Also described are the data-analysis procedures (Steinhof Reference Steinhof2013). This report provides an update on the status of the sample preparation techniques, which were last reported more than a decade ago (Steinhof et al. Reference Steinhof, Adamiec, Gleixner, van Klinken and Wagner2004).
The Jena 14C laboratory is dedicated to understanding the global carbon cycle. The first sample was prepared in 1999 using an elemental analyzer–isotope ratio mass spectrometer (EA-IRMS) combination. Thus, it specializes in the preparation of soil, plant, gas, charcoal, and wood samples. This report describes the procedures used in the preparation of samples from the different categories and the methods employed to deal with the efficiencies and backgrounds of these samples.
The background, i.e. all extraneous carbon not resulting from the original sample, affects the measured 14C ratio. This background can be categorized according to the processes or places where the contamination occurs. Contamination may occur during AMS measurement (machine background), storage, graphitization, combustion, or (chemical) treatment (e.g., Vogel et al. Reference Vogel, Nelson and Southon1987; Brown et al. Reference Brown and Southon1997; Schleicher et al. Reference Schleicher, Grootes, Nadeau and Schoon1998). As there are already many investigations of the different contributions but not the storage, this was investigated.
SAMPLE PREPARATION
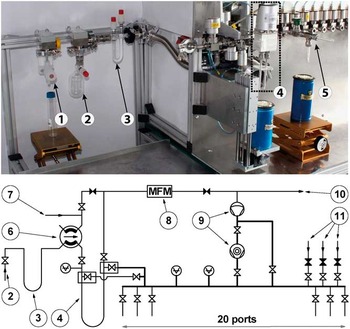
The core of the sample preparation in our lab is the EA-IRMS combination. Between 5% and 10% of the CO2 from the EA (NC2500, Carlo Erba, Milano, Italy) reaches the IRMS (Delta Plus, ThermoQuest, Bremen, Germany) via an open-split device (Conflow II, Finnigan Mat, Bremen, Germany). The majority of the CO2 (90–95%) is directed into the UGCS (universal gas collection system) line (Figure 1), which includes a cryogenic CO2 trap and 20 ports for graphitization reactors. The procedure as described in Steinhof et al. (Reference Steinhof, Adamiec, Gleixner, van Klinken and Wagner2004), has been modified in the following ways:
-
1. the gas chromatography column is no longer used (Aerts-Bijma et al. Reference Aerts Bijma, van der Plicht and Meijer2001);
-
2. the preparation line for the air samples is now combined with a second line analogous to the UGCS to build up a separate unit (see the “Gas Samples” section); and
-
3. an additional special inlet port with a water trap directly connected via a four-port Valco valve (Valco, Schenkon, Switzerland) to the CO2 trap of the UGCS has been installed (Figure 1).
Photo and schematic setup of the line UGCS (universal gas collection system) with the special inlet port. (1) shows the (unmounted) syringe needle connection for use with septum-sealed gas vials, (2) shows a 115-mL flask, which is mounted at the special inlet port, (3) is the water trap filled with pellets of magnesium perchlorate Mg(ClO4)2, (4) shows the CO2 trap operated with liquid nitrogen (LN2), and (5) shows a graphitization reactor (only on the photo). Only in the schematic setup are furthermore shown (6) the 4-port Valco valve (Valco, Schenkon, Switzerland) connecting the special inlet port and the inlet port of the EA (7) with the CO2 trap, (8) a mass flow meter (only used in connection with the EA), (9) the pre-vacuum (Scroll) pump and the molecular turbo pump, (10) the exhaust, and (11) gas supplies for H2, CO2, and N2. In the front are 20 outlet ports to mount graphitization reactors. The needles shown with filled symbols are regulation valves. The other valves and the LN2 dewar for the CO2 trap can be operated by a switch board. Not shown are, at the special port, an additional pressure sensor and a valve connecting a scroll vacuum pump for faster switching between different samples.

At this special inlet port, different sample vessels can be mounted. For example, gas flasks with tubes may be mounted via a Swagelok Ultra-Torr connector, a septum may be connected via a syringe needle, or sealed ampoules may be mounted in an ampoule opener. The water trap of the special port is filled with pellets of magnesium perchlorate Mg(ClO4)2. Thus, there are three approaches to “produce” CO2 from a sample (i.e., via the EA, the special inlet port, and extraction from air).
Initially, EA samples were combusted in ø5/9 tin capsules, but such capsules have a relatively high carbon content of 0.92 µg per capsule. (The numbers give the diameter and the height of the capsules; all capsules are purchases from IVA Analysentechnik, Meerbusch, Germany.) The carbon contents of the capsules were measured in batches of 5 or 10 with the EA-IRMS. Since 2007, we have used ø5/9 silver capsules for normal and ø10/10 silver capsules for large samples. The carbon content of these capsules is 1.5 and 2.2 µg, but after heating these to 500°C in air overnight (within the six-week period prior to use) the carbon contents are reduced to 82 and 300 ng, respectively.
All the glassware made from Duran® (borosilicate 3.3) used for the sample treatment is cleaned by heating at 500°C overnight in air. Water is freshly processed using an Astacus AL TI device (MembraPure, Berlin, Germany), which yields water with <1 ppb total organic carbon (TOC).
The graphitization reactors are based on a Swagelok Ultra-Torr 3/8″ Tee. On one side is a valve, while 60-mm-long Duran® glass tubes are mounted on the other two sides (Figure 1). The horizontally mounted glass tube contains 1.5 mg of iron; the vertical tube is cooled to −15°C during the graphitization to trap water. Before the reaction container is used, the iron is heated for 2 hr to 350°C in an atmosphere of H2 (800 mbar pressure) to clean its surface. To test for the presence of leaks, each container is then evacuated, sealed for 2 hr, and the resulting pressure increase measured. In the first years of operation of the lab, tubes made from quartz glass were used, but the samples were found to stick on the tube walls, most likely because of electrostatic charging. With the Duran® tubes, the graphitization temperature was reduced to 550°C (compared with a previous temperature of 650°C), but no loss in efficiency was observed. The graphitization is performed in the presence of H2 (at ~2.2 times the CO2 pressure) with iron as a catalyst (Vogel et al. 1984).
With respect to the treatments used to obtain CO2 from the samples, the samples processed in the Jena lab can be divided in seven categories, each of which is explained in the following sections. The sample categories are as follows:
1.aSolid samples requiring no chemical pretreatment
1.bSolid samples requiring chemical pretreatment
2.aGas samples with atmospheric CO2 concentrations
2.bGas samples with higher than atmospheric CO2 concentrations
2.cGas samples collected on molecular sieves
3.aSoil inorganic carbon (SIC)
3.bDissolved inorganic carbon (DIC) in water
As the processes used for each category are different, different process standards using appropriate chemical compounds are required for the background determination. In the following, the background is given by a fraction of mass m z with zero 14C content and a fraction of mass m m with with modern 14C content R m=1 F14C (see Appendix). The 14C concentrations are given by fraction modern F14C. The mass of the non-contaminated sample is denoted m sam; therefore, its 14C isotope ratio, R sam, can be calculated from the measured R meas, determined according to Equation (A1) by
 $$R_{{{\rm sam}}} {\equals}R_{{{\rm meas}}} \cdot \left( {1{\plus}{{m_{\rm m} {\plus}m_{\rm z} } \over {m_{{{\rm sam}}} }}} \right){\minus}{{m_{{\rm m}} } \over {m_{{{\rm sam}}} }}$$
if the values m z, m m, and m sam are known. Note that m sam follows from the total carbon sample mass m tot=m z+m m+m sam. As there are two unknowns, this procedure also requires the measurement of two process standards, usually a blank standard and a modern standard. In the case of samples of the category 1.a with constant sample masses, the contaminations resulting from machine, graphitization, and combustion backgrounds (Table 1) affect the standards and the samples in the same way, therefore the respective corrections are performed automatically (Appendix).
Values of the different background components. The (so-called) machine background results from measurements of commercial graphite (Art. No. 50870, Fluka Chemie, Buchs, Switzerland), directly pressed into targets without any treatment. Strictly seen the machine background not only includes contributions from the AMS measurement, but also from the pressing of targets. The sum of machine and graphitization backgrounds results from measurements on COR gas. The sum of all three backgrounds is measured using IAEA-C1. The σ (standard deviation) within a wheel is used for a background correction, the σ of different wheels indicate the long-term stability of the AMS system.

Depending on the kind of sample and treatment, there might be no applicable modern standard available, and the special production of such is a significant undertaking that is not usually performed. In this case, only the modern fraction of the background can be corrected
 $$R_{{{\rm sam}}} {\equals}R_{{{\rm meas}}} {\plus}m_{{\rm m}} \,/\,m_{{{\rm sam}}} \cdot (R_{{{\rm meas}}} {\minus}1)$$
which corrections are applied for the different sample categories is explained below in connection with the description of the different procedures.
The contributions to the background are determined for every “wheel,” which means the measurement series of all targets put into the ion source at one time. A usual wheel consists of 10 NOX (new oxalic acid or HOxII or SRM-4990C, NIST), and six blank IAEA-C1 standards (Rozanski et al. Reference Rozanski, Stichler, Confiantini, Scott, Beukens, Kromer and van der Plicht1992; Le Clercq et al. Reference Le Clercq, van der Plicht and Groning1998) samples, one sample each of IAEA-C5, -C6, and -C7, one HOxI (SRM-4990B, NIST) sample, and up to 52 unknown samples. Any additional process standards reduce the maximum number of unknown samples.
Solid Samples without Chemical Pretreatment
Solid samples requiring no chemical pretreatment (category 1.a) are directly combusted in the EA. The decisive criterion for this treatment is that the total carbon content can be used to measure the amount of 14C present in the sample. In the 14C Jena lab, samples in this category are primarily soil samples that contain no inorganic carbon, shells, or seeds. Liquid samples requiring no pretreatment are put into a matrix of carbon-free sand (see the section “Organic Carbon in Soils with Carbonate”) and are combusted analogously. As the amount of these liquids is in the range of µL, a few mg of the matrix are sufficient and the respective contamination is negligible.
For samples that require no chemical pretreatment (category 1.a), the background correction is performed by the linear regression of the data of the NOX and IAEA-C1 standard samples during the data analysis (see Appendix). The calibrated interception b of the linear regression represents the ratio m m/m tot (see Appendix) and is closely watched for quality assurance. The average value and standard deviation of 20 arbitrarily chosen wheels in the year 2015 were b=(4.64±0.63)×10−3 F14C (see Table 1). The standard deviation gives a measure of the reproducibility of the different wheels, but the uncertainty in the background subtraction has to be based on variations between the background samples within a wheel, denoted Δb. The value of Δb cannot be determined from the statistical uncertainty of the 14C events; on the basis of six IAEA-C1 targets per wheel, we found values of Δb up to four times larger than the statistical uncertainty. The mean value and the standard deviations of Δb in the same 20 wheels were Δb=(0.51±0.22)×10−3 F14C; this is much smaller than the empirical rule proposed by (Nadeau and Grootes Reference Nadeau and Grootes2013), which states that Δb=b/3.
Solid Samples with Pretreatment
In cases where only a specific chemical fraction (compound) of the carbon must be measured, chemical pretreatment is required (category 1.b). These pretreatments are specific to the respective compounds of interest. Pretreated samples are combusted in the EA in the same way as other solid samples. Owing to the restricted number of sample types, only three main chemical pretreatment procedures are applied at the Jena 14C lab: decalcification of soil samples, purification of charcoal, and extraction of α-cellulose from wood and leaves. The classical acid–alkali–acid treatment is applied only in very rare cases. Further pretreatments like density fractionation or separation by HPLC are performed in-house, but outside of the 14C laboratory.
Charcoal, Wood, and Leaf Samples
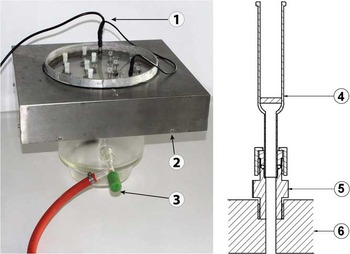
For the purification of charcoal and the extraction of α-cellulose from wood and leaves, we have a device called the “multiport” (Figure 2). This device is also used if an acid–base–acid treatment is applied. To use the multiport, up to 12 samples at a time are placed into the micro-filter funnels (MFFs) (Part nr 27203, ROBU Glasfilter-Geräte GmbH, Hattert, Germany). The MFFs are fitted with integrated sintered glass filter plates made of borosilicate glass 3.3, the porous size of the applied type is 16–40 µm, and the diameter of the filter plate is 10 mm (Figure 2, right). The MFFs are mounted into Swagelok Ultra-Torr connectors in the base plate of the multiport (Figure 2, left). After mounting the MFFs, the upper part of the multiport (i.e., the portion above the base plate) is filled with water to a few mm below the top of the MFFs. This water transfers the ultrasound and heat of the surrounding ultrasonic transducer (Bandelin, Berlin, Germany) and heater, respectively, to the MFFs, enhancing the interactions between the added reagents and the sample inside the MFFs. Through the Swagelok Ultra-Torr connectors, the inner parts of the MFFs are connected to a vacuum below the base plate, suctioning the liquid reagents through the sintered glass filter. If the interaction time of the reagents with the sample needs to be increased, the flow of a single MFF can be individually stopped by using a plug placed on the top of the MFF; this is important because the flows in single MFFs are sometimes very different. Note that during the vacuum pumping all MFFs must either contain liquid or be closed with a plug. After usage, the MFFs are cleaned in an ultrasonic bath and by heating in air at 500°C.
Left: photo of the complete multiport with 12 mounted micro-filter funnels (MFF), 6 with and 6 without plugs. (1) shows the heater, (2) the ultrasonic transducer (Bandelin, Berlin, Germany), and (3) the connection to the vacuum pump. Right: cross section of a MFF (4), held by a Swagelok ¼″ Ultra-Torr connector (5), which is mounted into the base plate (6). The MFF is made of borosilicate glass 3.3 with an integrated sintered glass filter plate (see text), and the base plate is made of polyoxymethylene (POM).

The first and last steps in our pretreatments are Soxhlet extractions, which are not commonly performed in MFFs. However, in all our procedures, the samples should stay in one vessel to avoid further contamination, and so we use the MFFs also for Soxhlet extractions. Teflon plugs are used to keep the wood samples, which might float in the liquid, from escaping the MFFs.
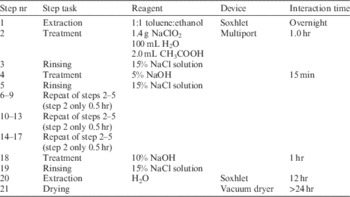
The different steps involved in charcoal purification are given in Table 2, and they are very similar to those of the acid–base–oxidation (ABOx) procedure described by Bird et al. (Reference Bird, Ayliffe, Fifield, Turney, Cresswell, Barrows and David1999). But in this context “charcoal” stands for all forms of pyrogenic carbon, which covers a large variety of features (e.g. Bird and Ascough Reference Bird and Ascough2012). Many samples at the Jena 14C lab contain the less resistant type of pyrogenic carbon, are small samples, and are older than 10 kyr in age. Therefore, the applied steps are not the harshest pretreatments of Bird et al. (Reference Bird, Levchenko, Ascough, Meredith, Wurster, Williams, Tilston, Snape and Apperley2014), but a compromise between purification and loss of sample material. The efficiency, determined using by commercially available charcoal, graphite, and black coal, was found to be between 80% and 90% (with respect to carbon content), but could also be much smaller for samples with less resistant pyrogenic carbon. As some samples contain mainly soil with a few charcoal fragments, the removal of soil organic carbon was also tested using a carbon-free soil sample with added humic acid (product number 53680, Fluka Chemie, Buchs, Switzerland) or Kauri wood (IAEA-C4), as an analog to the test of the decalcification procedure (see the section “Organic Carbon in Soils with Carbonate”).
Procedure for the purification of charcoal (see text). The device “multiport” is explained in the text and Figure 2. All reagents are exchanged at least 3–4 times during each single step. The temperature inside the multiport is 65–70°C. Note, the last heating step is not for drying, but for combusting remains of organic carbon.

For the precise dating of wood, α-cellulose should be used (Tans et al. Reference Tans, de Jong and Mook1978; Hoper et al. 1998). The steps involved in α-cellulose extraction are given in Table 3. The procedure is inspired by e.g. Stuiver et al. (Reference Stuiver, Burk and Quay1984) and Loader et al. (Reference Loader, Robertson, Barker, Switsur and Waterhouse1997). The efficiency of the procedure has been difficult to determine, as it is challenging to determine the amount of α-cellulose present in a certain piece of wood before the treatment. For samples of pine, spruce, ash, and beech wood with a typical sample weight between 5 and 50 mg, the yield is around 16% of the wood weight. Certainly, the efficiency would decrease and purification would increase if the number of bleaching steps were increased.
Procedure for the extraction of α-cellulose. The device “multiport” is explained in the text and Figure 2. The leaching reagent in step 2 must be exchanged at least every 30 min. The temperature inside the multiport is 65–70°C. If the cellulose is not “white” after step 18, steps 14–18 are repeated multiple times.

For the processes of cellulose extraction and charcoal purification, there are blank standards available. For cellulose extractions, these are IAEA-C4 and -C5 (both have 14C contents that are not exactly zero; Rozanski et al. Reference Rozanski, Stichler, Confiantini, Scott, Beukens, Kromer and van der Plicht1992) and fossil wood No. 22668, which has a 14C content below the instrument detection limit, and was obtained from the Institut für Umweltphysik, University of Heidelberg, Germany. For charcoal purification, we found a suitable blank standard in the form of commercial graphite (Art. No. 50870, Fluka Chemie, Buchs, Switzerland), which has a 14C content less than (0.26±0.07)×10−3 F14C (see Table 1, machine background). The values of the blank corrections are <10−3 F14C for the cellulose extraction and charcoal purification. The correction is performed according to Equation (2); however, it should be noted that because these blank corrections are based on blank process standards they represent only the modern fraction of the background in our calculation. We have not produced our own modern standards with modern 14C content for these two pretreatments for the following reasons: (1) usually, the sample sizes for these purification protocols are “large” (several mg C) and therefore the relative process background is small; (2) the influence of an old contamination to a modern sample is only a dilution, while the influence of a modern contamination to an old sample scales inversely with the age and can become very large; and (3) the effort required to produce a process standard is large (Sydoff and Stenström 2010). We have therefore not yet produced such a process blank for these types of samples.
Organic Carbon in Soils with Carbonate
The initial (1999) decalcification procedure to measure SOC in soils containing carbonate simply involved adding 1M HCl, controlling the pH value of the solution, waiting, and neutralizing with NaOH before freeze-drying the sample. It was realized, however, that this procedure introduced contamination of up to 10 mg carbon/(g sample) and we therefore started to investigate this background in detail.
For the development of a new decalcification procedure we needed a fast method to measure the contamination and therefore produced a soil standard containing no carbon. After passing the decalcification procedure the (extraneous) carbon content of this soil standard, resulting from contamination, is measured with the EA-IRMS combination. Even though our EA-IRMS set-up is optimized for the sample preparation, we could detect down to 0.2 µg carbon in a sample. The carbon-free soil used in this method is produced by treatment with HCl and subsequent heating to 600°C in air and has a residual carbon content of 20 ppm.
To reduce contamination in the decalcification procedure, we omit the neutralization step, reduce the interaction time (before drying) to 1 hr by using a shaker/mixer (MixMate, Eppendorf, Wesseling-Bersdorf, Germany) to agitate the acidified sample, and increase the concentration of the added HCl. If we have no information about the inorganic content, we add first 500 µL H2O to wet the sample and then 500 µL 8M HCl. After the samples pass the shaker the pH is checked to be ≤ 2. These high HCl concentrations require a new drying method using an HCl-resistant rotational vacuum concentrator (Martin Christ GmbH, Osterode, Germany). Note that until the samples are dry the drying time is adding to the effective interaction time of the samples with HCI. At the applied temperature of 60°C this can be up to 2 h. The amount of C introduced in a sample during processing by the new method amounts to 4±3 µg. Therefore, a background correction is necessary and done with humic acid (see the section “Charcoal, Wood, and Leaf Samples”) added to carbon-free soil as a process standard. The 14C isotope ratio of the humic acid was measured to be < 0.3×10⁻³ F14C. The background values measured by AMS with this process standard agree with the ones determined by the EA-IRMS if a 14C isotope ratio of F14C=1 is assumed for the background.
Gas Samples
To reach the standard Jena sample size of 0.5 mg C, gas samples with atmospheric CO2 concentrations, i.e., ≈400 ppm, (category 2.a) require a flask volume of at least 2 L (at a filling pressure around 1 bar). This volume must pass through three bottlenecks: the flask valve, a water trap at −100°C, and a CO2 trap (at liquid N2 temperature, with pressures low enough to avoid trapping O2). As this causes long extraction times a fully automated gas line, denoted ACES in Steinhof et al. (Reference Steinhof, Adamiec, Gleixner, van Klinken and Wagner2004), was installed and is used for such samples.
For gas samples with higher CO2 concentrations (category 2.b), the volume to be extracted is much smaller; hence, the gain in time resulting from automation is also much less. Flasks having volumes up to 0.5 L (with CO2 levels ≥2000 ppm) are routinely extracted with the special port (Figure 1). Such high CO2 concentrations result from sampling soil respiration, lab incubation experiments, or from CO2 in tree stems (Muhr et al. Reference Muhr, Angert, Negron-Juarez, Munoz, Kraemer, Chambers and Trumbore2013). Occasionally, we have 1 L flasks (with ≥1000 ppm CO2) that may be extracted using the special port as well as the separate gas line.
We are also able to extract gas samples collected on molecular sieves (category 2.c), including zeolites (Bauer et al. Reference Bauer, Williams and Druffel1992; Schuur et al. Reference Schuur, Vogel, Crummer, Lee, Sickman and Osterkamp2009). The zeolite used in the reported case was a molecular sieve 13X-8/12 beads (Grace Davison Discovery Sciences, Columbia, MD, USA). For the extraction, U-shaped tubes containing the zeolite were heated to 500°C and extracted through the special port in a manner identical to that used for a normal flask; i.e., the gas released upon heating was sucked through the CO2 trap. During sampling in the field, a chemical trap removed much of the water so that most CO2 was trapped on the molecular sieve, and no further drying of the extracted sample was needed prior to graphitization.
In the case of gas samples, the kind of vessel used is important for the background. We found only negligible additional background resulting from leaks in gas samples collected in flasks sealed with O-rings that are maintained by the Jena 14C lab, as such flasks are given to the user only after careful cleaning and leak testing. The leakage rates are determined by evacuating the flasks and measuring the pressure increase after 4–8 days. Only flasks with leakage rates below 10−7 mbar L/s passed this test, and these showed no measurable background increase in experiments involving CO2 reference gas (COR, see below). In the case of other vessels provided by the users, e.g., vials with septa or molecular sieves, blank samples have to be measured in cooperation with the users, depending on the integrity of the vessel seal and the required accuracy.
The backgrounds of the IAEA-C1 and NOX standards, which are used for the calibration in the data analysis, include a contribution from the combustion; however, the gas samples do not. This must therefore be corrected. The combustion background is determined using bottled mineral CO2 gas (Linde AG, Pullach, Germany) with zero 14C content (Table 1). The respective targets are denoted internally as “COR” from CO2 reference gas, as it is also used as an internal standard for δ13C measurements with the IRMS. The 14C isotope ratio measured with this gas shows the lowest values of all samples being graphitized and is therefore believed to result from only the machine and graphitization background. Therefore, the COR values are negative after the normal data analysis, and the correction for gas samples is performed in a manner analogous to that described in Equation (2) but with a negative value of m m. The absolute value gives the combustion background and is usually around 3.1×10⁻³ F14C (difference of the fourth and third row in Table 1). Analogous to category 1.a samples, the background correction and its uncertainty are deduced from the mean value and the scattering of the six COR targets within the respective wheel.
The Jena 14C lab often measures CO2 levels in gas samples obtained from incubation experiments. In the past, the CO2 was filled into separate vials. As a simplification, we now extract directly from the vessels containing the incubation sample. In this case, we have yet to find an appropriate standard. Instead, we can only fill a test vessels with carbon-free air and the COR gas, so to at least measure the contamination resulting from the expected leaks in the vessels.
Headspace Extraction
The inorganic carbon in soil (SIC) (category 3.a) and DIC from water (category 3.b) samples are measured by a “headspace” extraction at the special inlet port (Figure 1).
For SIC samples, a portion of soil equivalent to 0.8 mg of carbon is placed in a vessel sealed with a septum (12 mL Exetainer, Labco, Ceredigion, UK). The vessel is closed, and 1 mL of 85% H3PO4 is added with a syringe. The resulting CO2 is extracted. Efficiencies of 70% were measured using samples with known carbonate contents. The difference between samples of category 2.b and those here is that, in the former case, a solid, “cleaned” extract is produced and measured, while in the latter case, the carbon to be measured is volatilized from the sample, and the residue is discarded. Furthermore, the samples of category 2.b are combusted using the EA, while in the case of SIC, the CO2 is released by the action of an acid. The protocol described in this section is also applied to shells if their inorganic carbon has to be separated from their organic carbon.
To extract the DIC from water (category 3.b), 25 mL of the sample water is placed into a 60-mL vial (Amber VOA glass, Thermo Scientific), which is then closed with a Viton septum (Sigma Aldrich, product nr 27354) under a N2 atmosphere, and 0.5 mL of 85% degassed H3PO4 is added with a syringe. After an interaction time of at least 12 hr, the gas of the headspace volume is extracted via the syringe of the special port of the UGCS. The extraction is performed by an expansion to 0.25 L, after which the bottle is disconnected to avoid further water evaporation. The efficiency and the background of this procedure were tested with procedural standards prepared from 17.5 mg IAEA-C1 dissolved in 25 mL water and varied between 20% and 35%. Until now, the concentrations of the water samples measured have been between 60 and 120 µg C/g H2O. The low efficiency level prompted us to test the setup for fractionation using the Irvine coral standard (CSTD) with 0.9445±0.0018 F14C (ERM Druffel, University of California, Irvine, personal communication 2016), which is made from modern corals. The mean value measured at Jena was 0.9466±0.0039 F14C, showing that any fractionation resulting from the low efficiency is completely corrected for by δ13C. Analogous agreement was found when CSTD was used as a process standard for SIC samples.
Using the two available standards, i.e., IAEA-C1 and CSTD, the masses of the two fractions m z +m m of the background could be determined and a correction performed according to Equation (1). As long as we have a sufficient number of samples of either SIC or DIC to build a complete wheel that contains no other samples, the equivalent background correction based on CSTD and IAEA-C1 is done by performing a linear regression on the data analysis (see Appendix).
Background Caused by Storage of Graphite
The storage background was investigated in this work not because it is a large contribution, but because it is usually not investigated; one exception to this is Paul et al. (Reference Paul, Been, Aerts-Bijma and Meijer2016). We sought to understand the effects of several months’ storage, as storage for such extended periods could be necessary under some circumstances, e.g., significant damage to the AMS system followed by urgent measurement requests increasing further the delay of some samples. But to be able to clearly quantify the effects, the storage time in the investigation was extended up to 30 months, much longer than any expected delay. The long-term observations of this work are supplementary to those of Paul et al. (Reference Paul, Been, Aerts-Bijma and Meijer2016), which focus on the chemical nature of this contamination.
In general, a measured 14C isotope ratio, R meas, is derived from the 14C isotope ratios of the real sample, R sam, the contributions from the storage, and of all other backgrounds (included under the sum)
 $$R_{{{\rm meas}}} {\equals}\left( {m_{{{\rm sam}}} \,R_{{{\rm sam}}} {\plus}m_{{{\rm storage}}} \,R_{{{\rm storage}}} {\plus}\mathop{\sum}{m_{{{\rm other}}} \,R_{{{\rm other }}} } } \right)\,/\,M$$
where m x is the mass of the respective contribution x, and M is the sum of all masses. In Equation (1), the background is split according to the 14C content, whereas in Equation (3) it is divided according to the origin of the background. For samples with zero 14C content (R sam=0), and with the definition of the 14C storage background as B storage=m storage · R storage /M
 $$R_{{{\rm meas}}} {\equals}B_{{{\rm storage}}} {\plus}\mathop{\sum}{m_{{{\rm other}}} \cdot R_{{{\rm other}}} } \,/\,M$$
The value of B storage is determined by measuring two subgroups of targets that are as equal as possible, one of which has not undergone storage (i.e., B storage=0), and subtracting the results. The different subgroups of targets were measured in the same wheel, and all targets were produced under the same conditions (i.e., sample mass, mass of the iron catalyst, devices used).
In the case of the non-stored targets, the question arises, what does “fresh” mean? Can there be a fast and a slow contamination? Therefore, these targets were further divided into two subsets. The first was produced 2–4 days before use, and the second was produced on the same day that the targets were inserted into the ion source and evacuated. As there was no difference noted between the two types of “freshly made” targets; the average of all 20 targets was used to calculate ∑ m other/ R other/M. Note that this does not excluded the possibility that there is a contamination process with a time constant less than hours, but such a process could not be detected using our equipment.
A good signal-to-noise ratio requires low variations in the other background contributions shown in Equation (4). In contrast to the targets from IAEA-C1, targets prepared from the COR gas (see the “Gas Samples” section) do not need to be combusted; thus, their background is lower and exhibits lower variation (Table 1). The measured isotope ratio, F14C=(1.55±0.39)×10−3, is attributed to the graphitization and machine background. The carbon content of all targets was 0.8 mg, which was the standard mass at the Jena AMS lab when this investigation commenced. (Currently, the standard mass at the Jena lab is 0.5 mg C.)
The background B storage was investigated for three different storage times (12½, 23½, and 30 months). A set of 10 samples stored under identical conditions was considered to be sufficient for a good signal-to-noise ratio. Therefore, the capacity of a wheel allowed for testing four different storage conditions plus the 20 “freshly made” targets (see above). The storage conditions were as follows:
-
1. The target material was kept in the test tubes used for graphitization and stored in lab air, only covered to protect from dust. This condition is denoted as “powder, lab air.”
-
2. The target material was kept in the test tubes used for graphitization but stored under reduced partial CO2 pressure in a desiccator. This condition is denoted as “powder, desiccator.”
-
3. The targets were pressed directly after graphitization and then stored under reduced partial CO2 pressure in a desiccator. This condition is denoted as “pressed.”
-
4. The targets were pressed directly after graphitization in the same manner to the “pressed” condition, but each target was moistened every third month with 3 µL H2O. The targets were then stored under reduced partial CO2 pressure. This treatment is indicated as “pressed, moist.”
These storage conditions were selected for the following reasons:
-
1. Under the two conditions “powder, lab air” and “powder, desiccator,” the targets were not pressed in order to verify the idea of Harro A J Meijer of the Centre for Isotope Research in Groningen, The Netherlands (personal communication 2011), who suggested that it is better not to press the targets before storing them.
-
2. The treatment “pressed” was based on the idea that pressing reduces the surface area exposed to the surrounding air. This was the usual procedure used before this investigation.
-
3. The condition “pressed, moist” was based on the idea that CO2 contamination from the air arises because the graphite resulting from the graphitization is activated carbon. The idea was to saturate the binding sites of the activated carbon with water and thereby reduce the absorption of CO2.
The desiccators used for storage had glass walls (model 1342, Boekel Scientific, Faesterville, PA, USA) and were filled with moistened NaOH pellets to absorb the CO2. The CO2 concentration in one of the desiccators was measured with a Testo 535 (Testo AG, Lenzkirch, Germany) and found to be close to the detection threshold of 5±5 ppm. After opening the door of the desiccator, less than 2 hr was required before the CO2 was completely absorbed by the NaOH pellets.
The targets were measured in the usual manner for older samples, i.e., the first two runs are “cleaning runs,” which should clean the graphite surface and are not included in the data analysis. A “run” consist of 12 single measurements of 40 s each and 8–12 runs on each target are included in a “wheel.” No secondary standards were included in these wheels. Each of the three wheels consisted of 10 NOX samples 20 “freshly made” COR samples, and 40 COR samples that had been stored for the same storage time but under the four different conditions.
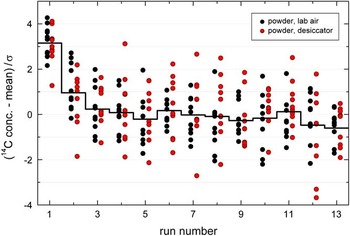
We use an operational diagram such as Figure 3 to determine (1) how significant the runs 1 and 2 are influenced by a surface contamination, and (2) if there are outliers in the remaining runs. In a Gaussian distribution, 60.7% of the data points are within±1σ, which is confirmed in the example of Figure 3 as there are 139 of the 220 points within ±1 (in the runs 3–13).
Deviations of the 14C content to the mean divided by its uncertainty as a function of the run numbers. The figure shows the data of the graphite stored as powder (see legend) for a storage time of 30 months. The step function shows the mean values of both subsets. The first two runs were excluded from any further analysis of the storage background.

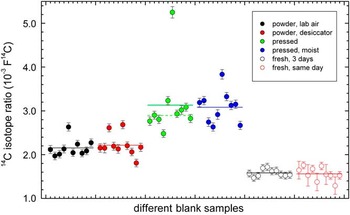
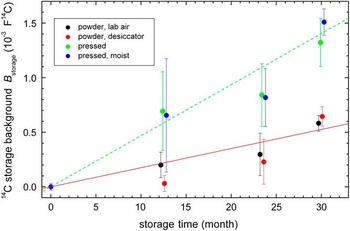
As explained, 10 targets are sufficient to give a good signal-to-noise ratio, but it is still too small to ignore non-statistical outliers. The largest outlier in the present investigation is shown in Figure 4, which is the only one excluded from further analysis. The resulting storage backgrounds are shown in Figure 5. As shown in this figure, the two storage conditions as unpressed graphite give, within the uncertainties, similar increases in B storage of 1.8×10⁻⁵ and analogous, the ones as pressed graphite increases of 4.7×10⁻⁵ F14C/month.
Measured 14C isotope ratios of blank samples after a storage time of 30 months. The different storage conditions are given by the symbols (see legend). The lines indicate the respective mean values. The data have one outlier at storage condition “pressed.” This outlier was excluded from the mean value. The new mean value is indicated by the dashed line and is used in Figure 5. Five targets of the freshly made, same-day subset had for unknown reasons a lower ion current.

14C storage background B storage under different conditions as a function of storage time. The storage times were 13, 24, and 30 months; the data points have been slightly shifted horizontally for better visibility. The different storage conditions are given by the symbols (see legend). For lines fitting the two powder storage conditions are fitted together (solid line, 1.8×10⁻⁵ F14C/month) and the two pressed storage conditions are fitted together (dotted line, 4.7×10⁻⁵ F14C/month).

The present investigation could neither determine the mass of the storage contamination nor the value of its 14C concentration, only their product in form of background B storage=m storage · R storage/M. The mass introduced by the contamination can be estimated by assuming a modern 14C concentration for the contamination, which yields 15 and 40 ng/month respectively.
CONCLUSIONS
The Jena 14C lab uses a number of procedures to process the range of samples analyzed in support of carbon cycle research. For wet-chemistry pretreatments, the procedures applied in Jena are inspired strongly by analogous procedures reported in the literature and adapted to the Jena multiport, as we see advantages arising from both the simultaneous application of an ultrasonic heating bath and vacuum filtration.
Unfortunately, we have no modern process standards available for the procedures described in the section “Solid Samples with Pretreatment.” However, for the applied procedures and the available blank standards, we have no indication that the lack of modern process standards reduces the accuracy of the results. Our experience is based on sample masses of about 0.5 mg C and its applicability to smaller masses would have to be verified. In the case of SOC measurements, we hope to reduce the amount of extraneous C introduced during decalcification further. In the case of measurements involving gas from incubation experiments however, we can only check the integrity of the vessels with an appropriate soil standard.
The measurement of the storage background shows that it is better to store the graphite as a powder, especially as this means no additional effort. The effort to store the samples under reduced partial CO2 pressure and especially to moisten them is not meaningful. If the samples as well as the standards are stored under identical conditions, what should be the usual case, not the absolute value of the storage background, but its variability is important. The error bars in Figure 5 are only an upper limit for the variability as they include the uncertainty of the AMS measurements of the stored and the fresh targets. (The large uncertainties at the 23.5-month storage time are due to a less smoothly running AMS system.) Taking the uncertainty at the 30-month storage time of 0.08×10⁻³ F14C as estimate of the variability, it can be seen that the additional background due to storage is not relevant, even if for modern samples an accuracy of 1‰ is aimed for. Furthermore, the results reveal that further measures, such as sealing the samples in glass ampoules, are not necessary.
ACKNOWLEDGMENT
We thank S. Schott (Max-Planck Institut für Biogeochemie) for producing the photos in Figures 1 and 2.
APPENDIX
In the following, it is shown that the background correction in the data analysis is equivalent to Equation (1), i.e. it takes into account that the 14C isotope ratio of the background R b must not be modern. The derivation is adapted to the Jena lab, therefore as blank standard IAEA-C1 and as reference standard NOX (SRM-4990B, NIST) are used. Furthermore, the formalism is based on the linear regression of the measured versus the nominal values, allowing the Jena analysis program (Steinhof Reference Steinhof2013) to include more standards in the analysis (see remark at the end).
The background can be parametrized either by its carbon mass, m b and R b, or by the two masses m z and m m, which represent a fraction with zero 14C content (index “z”) and a modern fraction (index “m”). In the following, R m is set to 1 F14C. Note that this is only possible if R b ≤ 1 F14C, but the modifications of the formulas for R b>1 would be straightforward. The masses m z and m m are determined by m b=m z +m m and R b=m m/m b. The mass of the non-contaminated samples is denoted m sam and its 14C isotope ratio R sam, therefore, the measured 14C isotope ratio R meas is given by
 $$R_{{{\rm meas}}} {\equals}{{m_{{\rm m}} {\plus}R_{{{\rm sam}}} \cdot m_{{{\rm sam}}} } \over {m_{{{\rm tot}}} }}$$
where m tot=m z+m m+m sam. For the blank standard IAEA-C1, i.e., R sam=0 and the reference standard NOX (SRM-4990B, NIST), R meas is calculated according to Equation (A1):
 $$\eqalignno{ & {\rm for}\,{\rm C1}\,{\rm targets\,\colon\,}\,\,\,R_{{{\rm meas}}} {\equals}m_{{\rm m}} \,/\,m_{{{\rm tot}}} \cr & {\rm for}\,{\rm NOX}\,{\rm targets\,\colon\,}\,\,\,R_{{{\rm meas}}} {\equals}(m_{{\rm m}} {\plus}R_{{{\rm NOX}}} \cdot m_{{{\rm sam}}} )\,/\,m_{{{\rm tot}}} $$
where the 14C isotope ratio of the NOX standard is denoted R NOX. The linear regression in the data analysis gives an intersection B and a slope A:
 $$\eqalignno{ & A{\equals}{{m_{{\rm m}} {\plus}R_{{{\rm NOX}}} \cdot m_{{{\rm sam}}} {\minus}m_{{\rm m}} } \over {R_{{{\rm NOX}}} \cdot m_{{{\rm tot}}} }}{\equals}{{m_{{{\rm sam}}} } \over {m_{{{\rm tot}}} }} \cr & B{\equals}m_{{\rm m}} \,/\,m_{{{\rm tot}}} $$
The calculation of the result, R res, of an unknown sample from its measured value, R meas, is performed with these linear regression parameters
 $$\eqalignno{ R_{{{\rm res}}} {\equals} & (R_{{{\rm meas}}} {\minus}B)\,/\,A \cr \!\!\!\!\!\!{\equals}\left( {(m_{{\rm m}} {\plus}R_{{{\rm sam}}} \cdot m_{{{\rm sam}}} )\,/\,m_{{{\rm tot}}} {\minus}m_{{\rm m}} \,/\,m_{{{\rm tot}}} } \right) \cdot m_{{{\rm tot}}} \,/\,m_{{{\rm sam}}} \cr \!\!\!\!\!\!{\equals}R_{{{\rm sam}}} $$
The linear regression used at Jena also performs the transformation from arbitrary units to F14C; the background correction b, discussed in the text, is therefore not B but b=B/A. As can be seen from the first line of Equation (A4), a subtraction of the background value with subsequent calibration, as done by every decent analysis program, is equivalent to the linear regression, as long as only one blank and one calibration standard is used.