I. INTRODUCTION
Welding is a primary manufacturing process used in many industrial sectors, and it is important to understand the mechanical and metallurgical phenomena concerned to the welding. Laser welding is a new-type technology which is high-energy-density, fast, and precise in joining various materials with different thicknesses and types.Reference Cao and Jahazi1–Reference Sokolov, Salminen, Kuznetsov and Tsibulskiy3 In the present automotive industry, there is a growing interest in laser welding technology for joining new materials to meet the increasing demand of corrosion resistant, lightweight, and durable auto-body parts. To reduce the consumption of materials and fuel as well as the weight of body in white, laser welded blank (LWB) which can weld two or more sheets having different thicknesses or mechanical properties together has been widely used in automotive manufacturing.
With the demand for lightweight and safety, advanced high strength steels (AHSSs) are widely applied in automotive industry. Especially, the hot stamping boron steel (B) such as 22MnB5 with a fully martensitic microstructure and the highest strength among the present AHSSs has played an important role in the automobile components and safety parts such as B-pillars and bumpers.Reference Karbasian and Tekkaya4–Reference Hyunwoo, Dennis, Hartmut, Roland and Mirko6 Dual-phase (DP) steel is also one of the popular members in the AHSS family, which is produced through intercritical annealing followed by quenching to form a two-phase microstructure containing martensite islands embedded in the ferrite matrix.
The combination of LBW with AHSS has been the focus in automobile manufacturing and research. Many studiesReference Chen, Ackerson and Molian7–Reference Farabi, Chen and Zhou11 have been carried out to investigate the laser welding of AHSS used in light weight vehicles. Among the present laser welding technologies, fiber laser welding (FLW) is the newest one with several advantages over other types, such as higher power density, efficiency, smaller beam diameter, good quality, and a robust setup for mobile applications.Reference Quinto, Costa, Miranda, Yapp, Kumar and Kong12–Reference Cui, Cui, Ren, Liu, Hu and Wang14
To provide a basic theory and experience of FLW blanks and promote the quality of laser welded joints in vehicles, in this study, microstructural, microhardness, tensile and fatigue properties of the fiber laser welded joints were studied. Few studies have been reported so far on the similar welded joints of 22MnB5 and dissimilar combination with DP steels using the FLW process. Therefore, this study was a previous work which aimed at studying the microstructure and mechanical properties of fiber laser welded joints of ultrahigh-strength steel 22MnB5 and dual-phase steels.
II. EXPERIMENTAL DETAILS
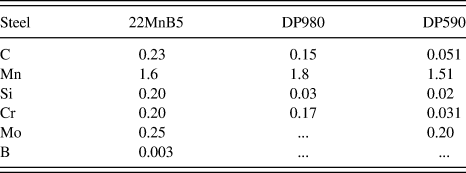
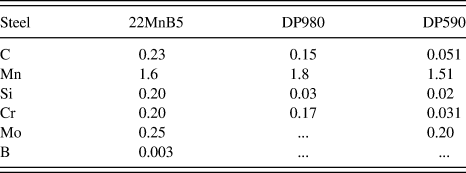
In this study, Al–Si precoated boron steel 22MnB5 (Arcelor USIBOR 1500P, Arcelor Group, France, quenched) and galvanized DP steel sheets were used as the base materials, with a thickness of 1.5 mm. The chemistries and thickness of these steels are shown in Table I.
Chemistry (wt%) and thickness of 22MnB5, DP780, and DP980.
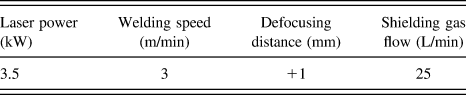
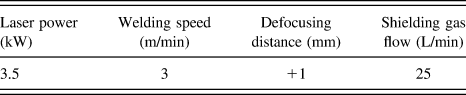
Steel sheets were butt welded by an IPG YLS-5000 fiber laser system with a maximum output power of 5 kW attached with a KUKA robotic arm. The laser with a beam focal length of 150 mm, a spot size/diameter of 0.2 mm, and a wave length of 1070 nm, was used to weld the blanks. The welding was performed with a head angle of 4° and the shielding gas was Ar. The welding parameters used in this experiment are shown in Table II.
Details of the FLW parameters used in the present study.
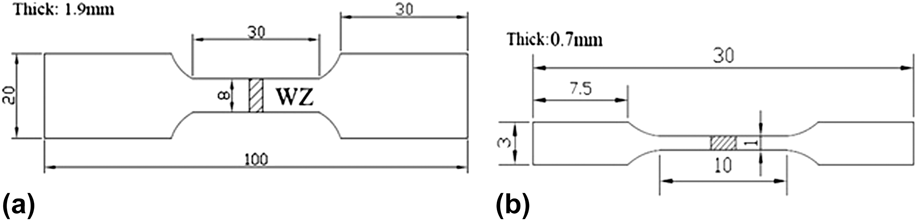
The microstructure of the weldments was observed using an optical microscope (VHX-600, Keyence, Japan) and an S-3400N scanning electron microscope (SEM) with the metallographic specimen etched with 4% nital solution. The hardness was tested by a HXD-1000 microhardness tester under a load of 100 g held for 15 s. Tensile and fatigue test specimens are shown in Fig. 1. Tensile tests were carried out via a universal material testing machine (AG-25TA) at room temperature and a strain rate of 1 × 10⁻⁴ s−1. Fatigue tests were conducted on a computerized IBTC-300 testing system under load control. All the fatigue specimens were polished without any nick before the test. The tension–tension cyclic loading at a stress ratio of R = 0.1 was applied at a frequency of 1 Hz and sinusoidal waveform. The fracture surfaces were observed by SEM.
Tensile and fatigue test specimens (unit: mm): (a) tensile specimen of welded joints, (b) tensile specimen of welded zone, (c) fatigue specimen of welded joints.

III. RESULTS AND DISCUSSION
A. Microstructure
With the welding process parameters in Table II, the cross-section profiles of the 22MnB5–DP590, 22MnB5–DP980, and 22MnB5–22MnB5 welded joints and the BM microstructure are shown in Fig. 2. The weld formation of each welded combination was good without cracks, pores, or any other defects, signifying an insignificant effect of chemical contents on the microstructure and formability of the WZ. However, a small WZ depression appeared due to no wire filling and high welding temperature. The cross-section of the welded joints showed a significant microstructural change after welding, indicating the formation of the middle WZ and two HAZs which coexisted with the unaffected BM at both the left and right ends as indicated in Figs. 1(a)–1(c). Both the color and structure were observably different between the HAZ and WZ of every welded joint, the details of which will be discussed later. The microstructure of BM is indicated in Figs. 2(d)–2(f). DP590 and DP980 had a similar BM which consisted of typical martensite in the ferrite matrix, while the martensite in DP980 was more than that of DP590. 22MnB5 had a fully martensitic microstructure in its BM.
Optical microscopy images showing the cross-sections of welded joints and BM: (a) 22MnB5–DP590, (b) 22MnB5–DP980, (c) 22MnB5–22MnB5, (d) 22MnB5 BM, (e) DP980 BM, (f) DP590 BM.
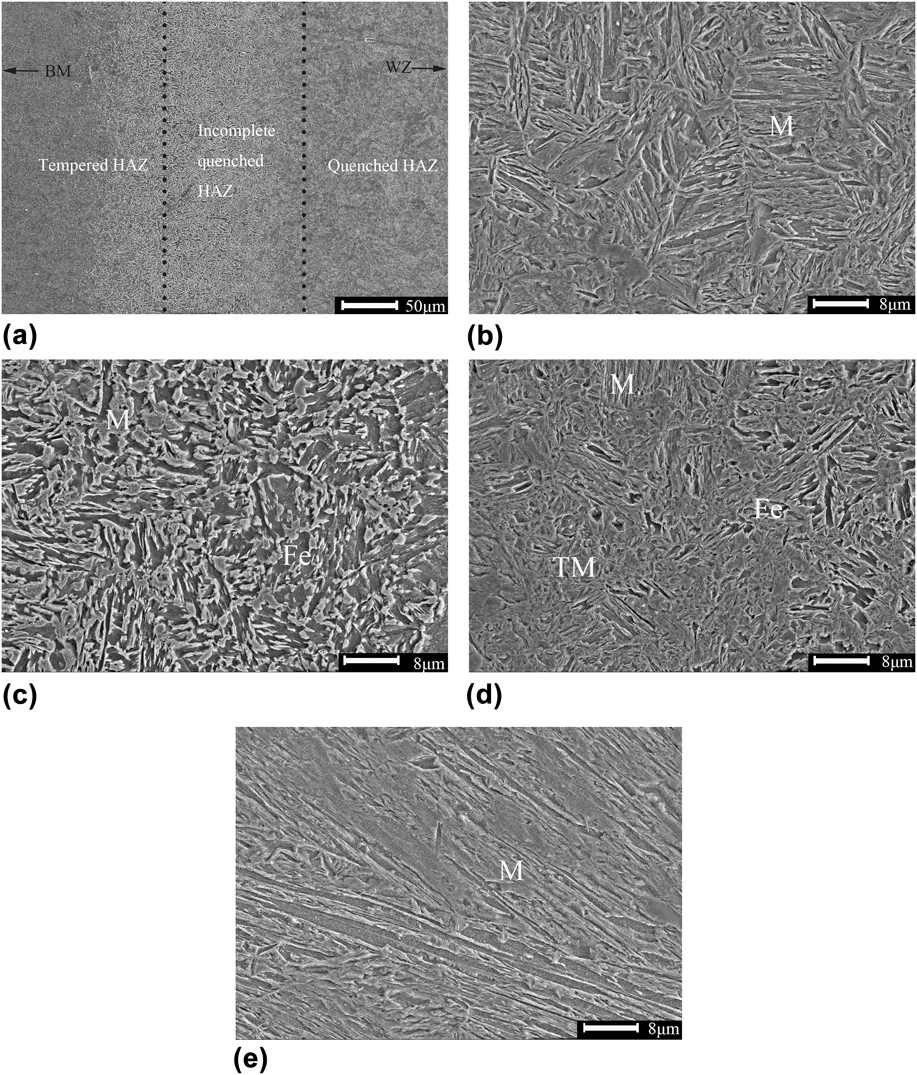
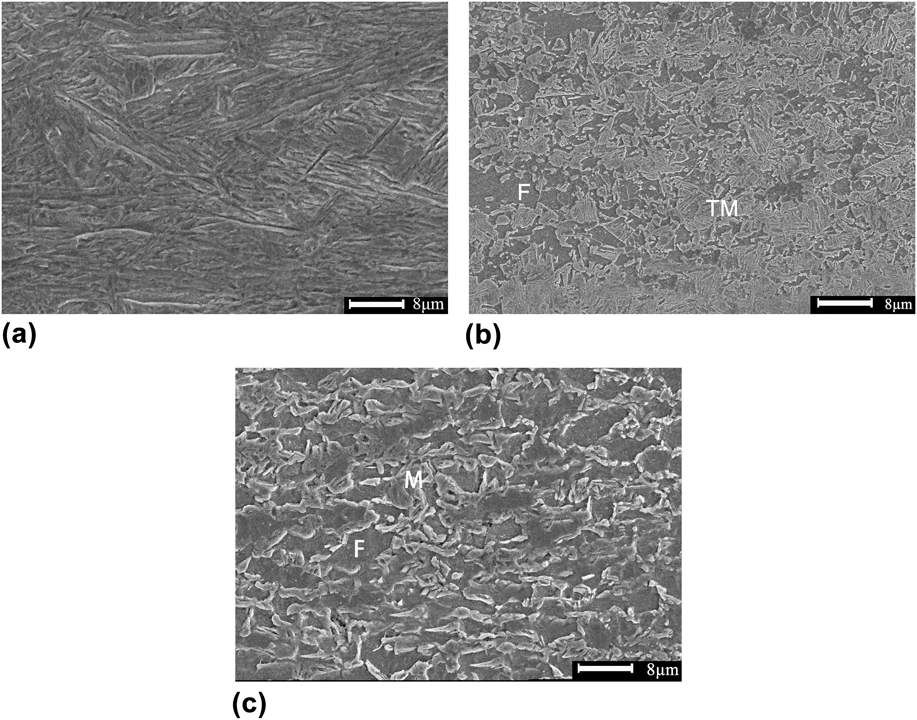
SEM images of the microstructure in the 22MnB5 similar welded joint are shown in Fig. 3. The microstructure of the WZ fully consisted of martensite with a lath morphology, as can be seen in Fig. 3(e), due to the high cooling rate during FLW. When solidifying, the WZ transformed into martensite, and the martensitic phase firstly nucleated in the austenite grain boundary. The microstructure of primary martensite was fine and grew like a column toward the grain interior, due to a low content of carbon, so the final morphology was like a lath.Reference Jia, Yang, Ni, Bai and Ding15 Different places in the welded joints had a different distance from the welding heat source as well as the distinct experience during the welding thermal cycle, so that it would result in forming different microstructures in the HAZ. Figure 3(a) indicates that the HAZ of 22MnB5 can be divided into 3 parts: quenched HAZ, incomplete quenched HAZ, and tempered HAZ. In the incomplete quenched zone, the temperature here was between Ac1 and Ac3 lines during FLW. Ac3 was the ending line of austenitic transformation. However, the temperature in this area was always below Ac3, leading to amounts of original martensite transforming into ferrite rather than austenite, as can be seen in Fig. 3(c). This was the primary cause of the incomplete martensitic transformation in this area. In quenched zone [Fig. 3(d)], the steel experienced temperature above Ac3 line during FLW with a complete austenitic transformation, exhibiting a much higher content of transformed martensite compared with incomplete quenched zone. The tempered HAZ experienced a temperature below Ac1 line, which made amounts of pre-existing martensite of the BM tempered. In this region, the microstructure was consisted of martensite, tempered martensite, and ferrite as shown in Fig. 3(e).
SEM micrographs showing the microstructure of 22MnB5–22MnB5 welded joint: (a) overall view of the 22MnB5 HAZ, (b) quenched region, (c) incomplete quenched region, (d) tempered region, (e) WZ (where M: martensite, TM: tempered martensite, and Fe: ferrite).
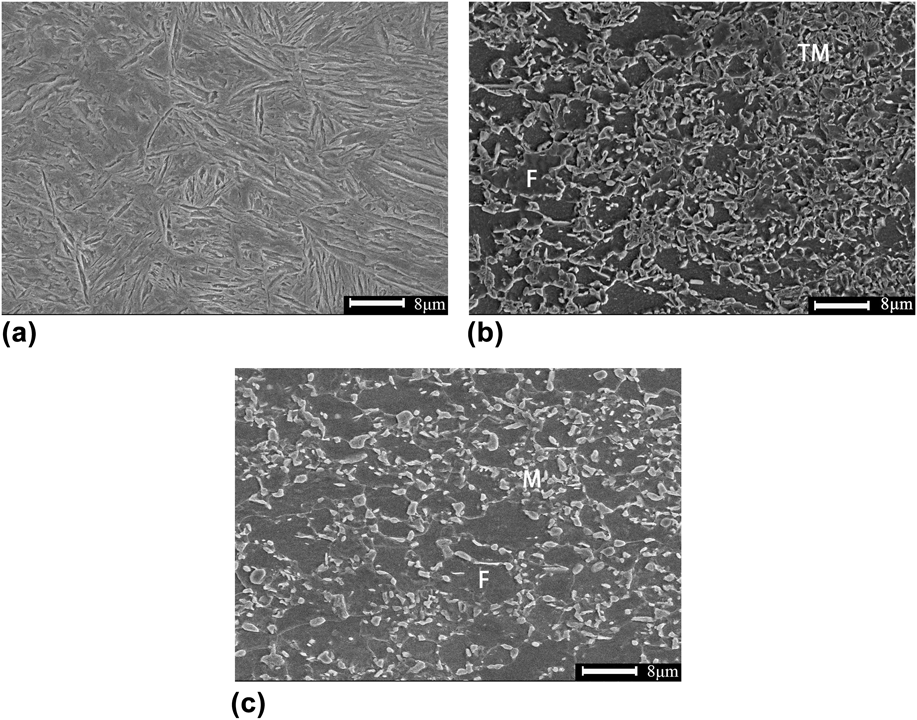
The changes in microstructure of the 22MnB5–DP980 and 22MnB5–DP590 dissimilar welded joints are shown in Figs. 4 and 5. Figures 4(a) and 5(a) clearly show that the microstructure of WZ still basically consisted of lath martensite, with the morphology similar to the WZ observed in the 22MnB5–22MnB5 similar welded joint. Compared with the content of martensite in Figs. 3(e), 4(a), and a5(a), the 22MnB5 similar welded joints owned the highest content of martensite in the WZ, while the 22MnB5–DP590 dissimilar welded joint had the lowest. According to the CCT diagram of DP steels and the cooling time t T/T0 equationReference Xia, Biro, Tian and Zhou16 below, the microstructure in WZ after FLW can be inferred.
 $${t_{T/T0}} = {\alpha \over {4\Pi {\lambda ^2}}}{\rm{\ }}{\left( {{q \over {vh}}} \right)^2}\left( {{1 \over {{{\left( {T - t} \right)}^2}}} - {1 \over {{{\left( {{T_0} - t} \right)}^2}}}} \right)\quad {\rm{,}}$$
where λ, α(=λ/ρc), q, h, v, and T 0 were heat conductivity, heat diffusivity (heat conductivity/density × specific heat), heat efficiency, plate thickness, welding speed, and preheating temperature. After referring present studiesReference Han, Park and Kang17 (thermal conductivity 30.0 W/m/K, density 7860 kg/m3, heat efficiency 50%, and specific heat capacity 680 J/(kg K) and the data in Tables I and II, the t 9/4 of each steel in this study was calculated to be about 1.4 s, much faster than the critical cooling time of martensitic transformation of 22MnB5,Reference Turetta, Bruschi and Ghiotti18 while a little slower than that of DP590.Reference Han, Park and Kang17 This was the reason why the WZ in 22MnB5–DP590 dissimilar welded joint did not have a full martensitic transformation at a speed of 3 m/min. As the BM of DP steels contained some martensite, leading to a tempered region [Figs. 4(b) and 5(b)] in HAZ as well. Compared with the BM of DP steels [Figs. 4(c) and 5(c)], it can be easily seen that the original martensite had partly transformed into tempered martensite in the tempered region.
SEM micrographs showing the microstructure of 22MnB5–DP980 welded joint: (a) WZ, (b) tempered zone in DP980 HAZ, (c) DP980 BM.
SEM micrographs showing the microstructure of 22MnB5–DP590 welded joint: (a) WZ, (b) tempered zone in DP590 HAZ, (c) DP590 BM.
B. Microhardness
The microhardness distribution across the 22MnB5–22MnB5 similar welded joints is presented in Fig. 6. It can be seen that the hardness profile exhibited a nonuniform characteristic with the highest hardness in WZ and the lowest hardness in HAZ. The microhardness did not drop very quickly when began to transit from the WZ to HAZ, as the microstructure in the quenched HAZ adjacent to the WZ still mainly consisted of martensite, as can be seen in Fig. 3(b) with Fig. 3(e). Across the HAZ into the BM, the microhardness dropped quickly with the lowest hardness just 63% of that in the BM, a soft zone formed in the HAZ. This was a result of the tempering of the BM with a decrease in hardness in the hardness profile. Compared with the BM, most parts in HAZ had lower hardness, resulting in the most HAZ being the weak area.
The microhardness distribution of the 22MnB5 welded joints.
To have a better comparison, the microhardness across the 22MnB5–22MnB5 similar and the 22MnB5–DP590, 22MnB5–DP980 dissimilar welded joints is plotted in Fig. 7. The correspondence between the microstructural zones (quenched, incomplete quenched zone, and tempered zone or upper-critical and two-phase zone) and the hardness is also marked in Fig. 7 according to the overview of the HAZ in Fig. 3(a). All the 22MnB5 sides in different welded joints had a similar trend of hardness distribution in HAZ with a uniform BM hardness. Similarly, the highest hardness of dissimilar welded joints was also in the WZ. However, it is particularly observed that there were two distinct hardness regions in WZ of the 22MnB5 side and the DP steels side (∼440HV on the DP590 side, ∼480HV on the DP980 side, and ∼540HV on the 22MnB5 side). This was a result of the difference in the BM and chemistry in 22MnB5 and DP steels where the alloying elements and the carbon contents were much lower than that of 22MnB5, resulting in a poor hardenability and a higher critical speed on DP steels side. Moreover, since the WZ solidification time during the FLW was very short, there was little or insufficient diffusion in the WZ, which made the WZ still in the condition of segregation between the two steels. Compared with the soft zone of 22MnB5 and DP steels, the degree of the soft zones was different. As can be seen in Fig. 7, the lowest hardness in DP980 was 77% of that in BM and the DP590 reached 93%, worse than the soft zone degree of 22MnB5 whose lowest hardness was just 63% of that in BM as mentioned in the last section. In addition, the width of soft zone in 22MnB5, DP980, and DP590 was measured to be 0.7, 0.4, and 0.2 mm. With the different degrees of soft zone, the welded joints of different steels must have the different properties.
Comparison of hardness for the similar and dissimilar welded joints.
C. Tensile tests
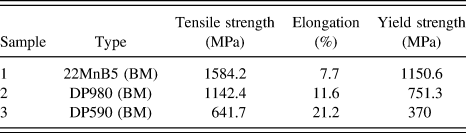
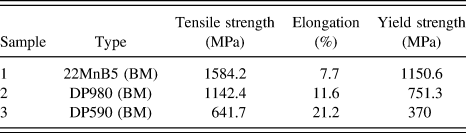
The engineering stress versus engineering strain curves, controlled at a strain rate of 1 × 10⁻³ s−1 of the 22MnB5 BM, 22MnB5–22MnB5, 22MnB5–DP980, and 22MnB5–DP590 welded joints, are illustrated in Fig. 8. The details of the BMs’ tensile test results are given in Table III. In the 22MnB5–22MnB5 similar welded joints, both the strain to failure and the tensile strength after welding were observed to be lower than those of the BM. Some of the fractured samples are shown in Fig. 9. It can be seen that the fracture of the 22MnB5–22MnB5 similar welded joints occurred in HAZ. This was because the plastic deformation of the welded joints concentrated in the soft zone due to its lower strength. The 22MnB5–DP980 welded joints showed a lower strain to failure (Fig. 8 and Table III) than that of DP980 BM, with the failure site still in HAZ. However, the tensile strength was basically unaffected by the FLW. The lower ductility in these two welds above was due to the fact that yielding occurred first in the soft zones and the subsequent plastic deformation was predominantly concentrated there leading to necking and premature failure at that location, which resulted in a reduction in the overall specimen elongation.
Representative engineering stress versus engineering strain curves at a strain rate of 1 × 10⁻³ s−1.
Results of tensile test.
Fractured locations in the specimens.
On the contrary, the samples of 22MnB5–DP590 dissimilar welded joints all failed in BM (DP590) due to its small and slight soft zone, indicating a similar tensile strength with that of BM. As the elongation of 22MnB5 is much lower than DP590, leading to the most plastic deformation occurring on the DP590 side with little on the 22MnB5 side, which reduced the elongation of the whole welded joint. The results indicated that the presence of a slight soft zone in the HAZ was not detrimental to the tensile strength, and the high welding speed could greatly reduce the harmful influence of the soft zone by narrowing it down. FLW is an excellent and viable joining process that gave a superior tensile performance approaching that of BMs when the degree of soft zone was appropriate.
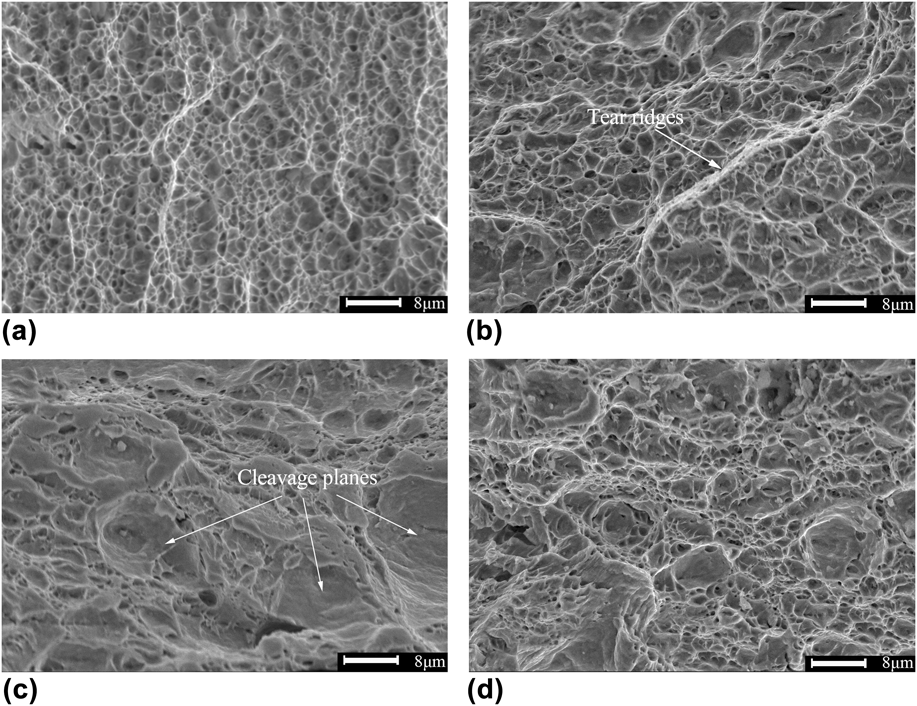
Some typical SEM images of the tensile fracture surface are shown in Fig. 10. The fracture edge of 22MnB5 BM displayed typical dimple patterns which were small and shallow along with some small cleavage planes in Fig. 10(a). While in the center of the fracture [Fig. 10(b)], the dimples became bigger and deeper. There were some big dimples surrounded by small dimples and a few ridges appeared, presenting a characteristic of ductile fracture. However, the fracture surface of the 22MnB5–22MnB5 welded joints exhibited obvious feature of quasi-cleavage. In Fig. 10(d), it can be seen that the fracture contained some small dimples along with some cleavage planes. While on the edge of its fracture surface [Fig. 10(c)], the dimples reduced and the cleavage planes increased and grew up. This was because that the cleavage planes initiated on the grain boundary and then connected with each other by the plastic deformation. Quasi-cleavage fracture is the typical form which mainly appears in the regions consisted of lath martensite. It can be easily summarized that the ductility and toughness of 22MnB5–DP980 welded joints were obviously better than the 22MnB5–22MnB5 welded joints.
SEM morphologies of tensile fracture at different locations: (a) fracture edge of 22MnB5–DP980, (b) fracture center of 22MnB5–DP980, (c) fracture edge of 22MnB5–22MnB5, (d) fracture center of 22MnB5–22MnB5.
D. Fatigue tests
Uniaxial tensile cyclic loading fatigue tests of the DP980–DP980, 22MnB5–22MnB5 similar welded joints and the 22MnB5 BM were experienced at a stress ratio of R = 0.1 and the maximum stress σmax = 800 MPa. The results showed that the 22MnB5–22MnB5 similar welded joints exhibited a fatigue life of 2.62 × 10⁵ cycles lower than that of the 22MnB5 BM (1.36 × 10⁶ cycles) while the 22MnB5–DP980 dissimilar welded joints just had a life of 36752 cycles. As shown in Fig. 11(a), after etched by 4% nital solution, the failure in the 22MnB5–22MnB5 welded joint fatigue samples occurred in HAZ, and this was due to a sensitive effect of the soft zone in the HAZ. As explained earlier, the grain was much coarser in the soft zone, increasing the degree of slippage under the alternating stress. The initiation of fatigue cracks in this region was accelerated. Furthermore, when the cracks propagated to the grain boundary, both the spread path and fatigue striation width were changed, avoiding the cracks to keep growing. As the coarse grains had fewer boundaries to avoid the growth of cracks, it would result in a low fatigue life of the welded joint. The relationship between the grain size and the fatigue life was just like the Hall Petch formula.Reference Liu, Shi, Wang, Ji, Cai and Song19 In addition, some studiesReference Grishunin, Gromov, Ivanov, Volkov and Konovalov20,Reference Takeda, Shindo and Narita21 indicated that the ferrite and austenite were the centralization slippage zone under alternating stress, having great effects on the fatigue crack initiation. This is also the result why the soft zone had a lower fatigue life than the BM. However, it can be seen in Fig. 11(b) that the 22MnB5–DP980 welded joint fatigue samples failed in the DP980 BM. Because the σmax was higher than the yield stress of DP980, it caused the yielding and failure in the BM. Though the soft zone in DP980 had a lower hardness than that of DP980 BM, the stress experienced in this study could not break this region in a very short time due to a lighter degree of the soft zone than that of 22MnB5. Soft zone in the DP980 HAZ was small and narrow, would not affect the fatigue resistance, while it is needed to get rid of the degree of the soft zone in 22MnB5 welded joints to enhance its fatigue properties.
Fractured fatigue specimens of welded joints: (a) 22MnB5–22MnB5, (b) 22MnB5–DP980.
Uniaxial hysteretic stress–strain curves of welded joints from the first to the tenth cycle are shown in Fig. 12. The strain did not start from zero because the initial phase set to 0 leading to the data of 270°–360° unrecorded. In Fig. 12(a), hysteretic stress–strain curves of the 22MnB5–22MnB5 similar welded joints are closed with little plastic deformation. And the later cycles' stress–strain curves nearly overlapped without any skewing. However, the hysteretic stress–strain curves of the 22MnB5–DP980 dissimilar welded joints are unclosed in the first cycle owing to the large plastic deformation as shown in Fig. 12(b). It can be easily concluded that the strain rate slowed down rapidly after the first cycle and the strain of the second cycle almost overlapped the latter half of the first cycle. This is because the cyclic strain hardening was generated by the large number of plastic deformations in the first cycle. From the observation of Figs. 12(a) and 12(b), it can also be found that the plastic deformation of 22MnB5 in this fatigue test was smaller than DP980, and the 22MnB5–22MnB5 welded joints had little plastic deformation even at the first cycle and the strain achieved stability from the second cycle.
Uniaxial hysteretic stress–strain curves of welded joints from 1 to 10 cycles: (a) 22MnB5–22MnB5, (b) 22MnB5–DP980.
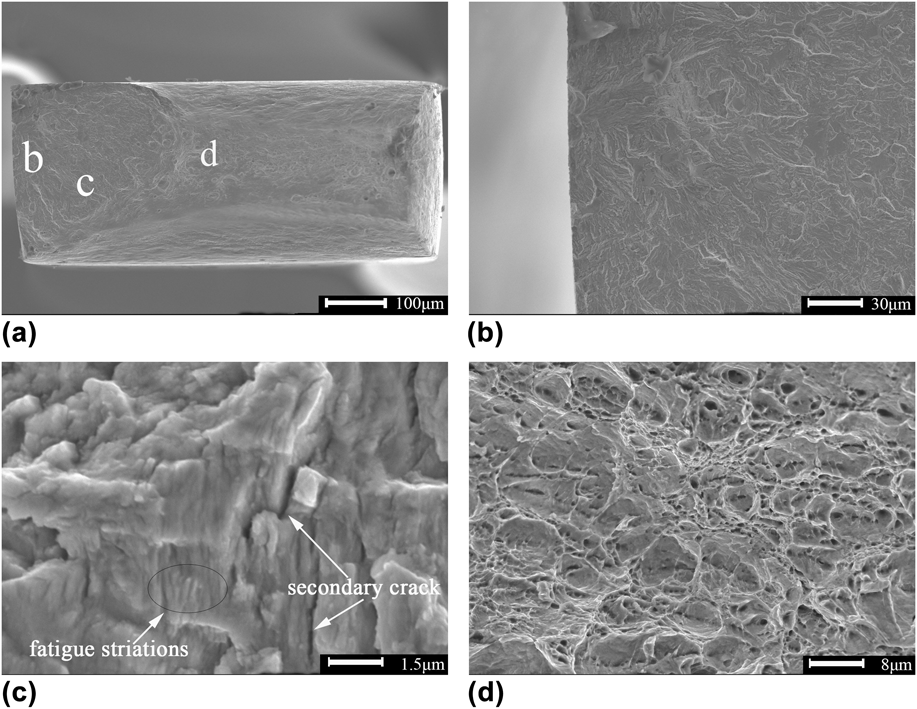
Some typical SEM images of the fatigue fracture surface of the 22MnB5–22MnB5 welded joint are shown in Fig. 13. It can be seen that the fatigue fracture can be divided into 3 parts: the crack initiation region, the crack propagation region, and the final fast fracture region, which were marked as “b, c, d” in Fig. 13(a). Magnified image of the crack initiation region is presented in Fig. 13(b), and it can be seen that crack initiation mainly took place from the specimen surface due to more stress concentration and less constraints than that inside. There is no doubt that more slippage occurred in the surface so that the crack initiation appeared here more easily. In Fig. 13(c), fatigue striations and secondary cracks can be seen in the propagation region where fatigue damage gradually accumulated as the propagation approached the final fracture. Fatigue striations were usually divided into two types, i.e., toughness and brittleness, as shown in the image, many crystal faces appeared in this region, perpendicular with the fatigue striations, suggesting a result of being brittleness fatigue striations. The width of fatigue striations near the crack initiation region was smaller than that of the later period of crack propagation. Figure 13(d) shows the final fast fracture zone that contained the typical dimples along with the plastic ridges just like its tensile fracture surface [Fig. 10(d)].
SEM morphologies of the fatigue fracture surface: (a) overview of the fracture, (b) the crack initiation region, (c) the crack propagation region, (d) the final fast fracture region.
Compared with the fracture surface of 22MnB5–22MnB5 welded joint, the fatigue fracture surface of 22MnB5 BM exhibited a very similar surface, indicating a similar fatigue fracture principle between the BM and welded joints of 22MnB5.
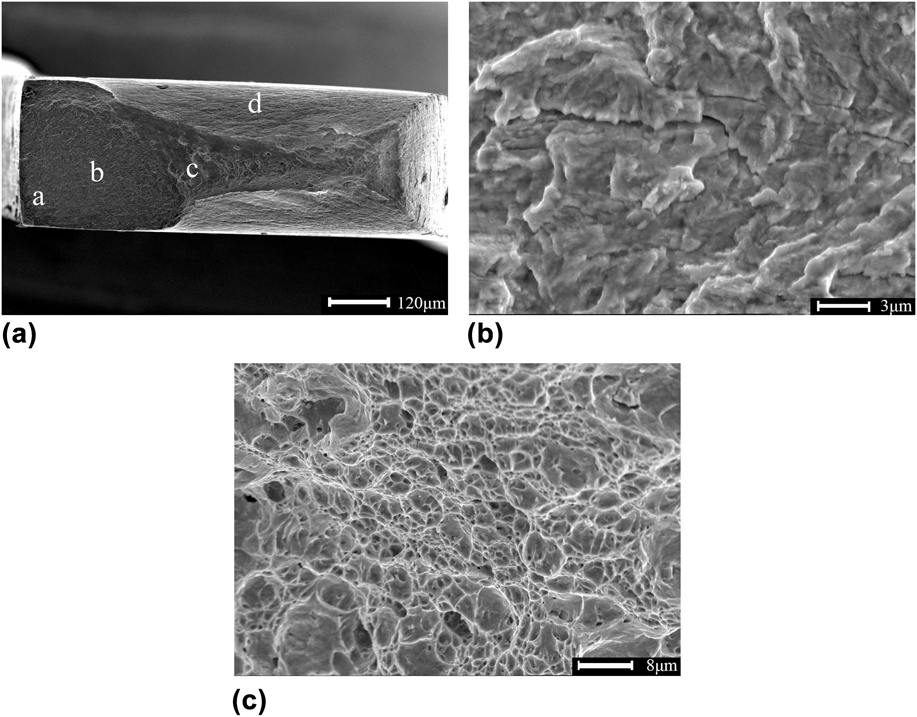
SEM images of the fatigue fracture surface of the 22MnB5–DP980 dissimilar welded joint are shown in Fig. 14. The crack initiation area could not be seen as clearly as the 22MnB5–22MnB5 welded joint [Fig. 13(a)] as the failure was primarily caused by the yielding in the BM region on the DP980 side [Fig. 11(b)]. Because the maximum stress was beyond the YS of DP980 at this cyclic stress level, which could be confirmed by the tapered region seen around the fracture surface, indicated by “d” in Fig. 14(a). Compared with the same region in Fig. 13(a), the tapered region in the fracture surface of DP980 was much larger. Fatigue crack propagation and final fast fracture zone were similarly characterized with the fatigue fracture surface of the 22MnB5–22MnB5 similar welded joint, as shown in Figs. 14(b) and 14(c).
SEM morphologies of fatigue fracture surface: (a) overview of the fracture, (b) the crack propagation region, (c) the final fast fracture region.
IV. CONCLUSIONS
Depending on the present study on the microstructure, microhardness, tensile and fatigue tests of the similar 22MnB5–22MnB5 and the dissimilar 22MnB5–DP980, 22MnB5–DP590 welded joints. Several conclusions can be drawn as given below:
(1) Both the WZ of the similar and dissimilar welded joints consisted of lath martensite due to a fast cooling rate during FLW. The HAZ in 22MnB5 and DP steels can be divided into 3 parts: quenched HAZ, incomplete quenched HAZ, and tempered HAZ.
(2) A characteristic asymmetric microhardness profile across dissimilar 22MnB5 and DP steels welded joints was observed. Inside the WZ, two hardness subregions were observed (∼440HV on the DP590 side, ∼480HV on the DP980 side, and ∼540HV on the 22MnB5 side), due to the difference in the alloying elements among these steels. In addition, a soft zone appeared in the HAZ of all steels used in this study, and the 22MnB5 steel had the highest degree of soft zone.
(3) The failure in the 22MnB5–22MnB5, 22MnB5–DP980 welded joint tensile samples all occurred in HAZ, while it failed in the DP590 BM in the 22MnB5–DP590 dissimilar welded joint. Both the tensile strength and the elongation decreased, compared with the BM of 22MnB5 and DP980. From the SEM observation of the fractured tensile samples, it can be concluded that the 22MnB5–DP980 dissimilar welded joints had a better performance of ductility and toughness than the 22MnB5–22MnB5 similar welded joints.
(4) The 22MnB5 BM had a higher fatigue life (1.36 × 10⁶ cycles) than the 22MnB5 similar welded joints (2.62 × 10⁵ cycles), while the 22MnB5–DP980 had the lowest life of 36752 cycles. Fatigue failure occurred in the HAZ of the 22MnB5–22MnB5 similar welded joints, due to a sensitive effect of its large soft zone, while it was occurred in the DP980 BM in the 22MnB5–DP980 dissimilar welded joints, where yielding was a dominant form of failure.
(5) In the fatigue fracture samples, fatigue crack initiation was observed to occur from the specimen surface. Fatigue striations and secondary cracks can be seen in crack propagation. The final fast fracture zone just looked like its tensile fracture surface.
ACKNOWLEDGMENTS
The authors sincerely would like to thank Dr. Yan from the College of Materials Engineering, Shanghai University of Engineering Science, for his help in preparation of the specimens and helpful discussions. This research was supported by Shanghai Key Technology Development Center of High Intelligent Laser Processing and Equipment Production (Shanghai University of Engineering Science). This work was financially supported by National Natural Science Foundation of China (Project No. 51075256), and a state key project (No. 11ZZ177).