


1. Introduction
The phenomenon of drop impact on a dry rigid surface finds relevance in several natural and industrial applications and has been discussed in excellent reviews by Yarin (Reference Yarin2006) and Josserand & Thoroddsen (Reference Josserand and Thoroddsen2016). Despite sustained research on this problem, several surprises were recently discovered starting with the seminal work of Xu, Zhang & Nagel (Reference Xu, Zhang and Nagel2005) who showed that reducing ambient pressure can completely suppress splashing. Smith, Li & Wu (Reference Smith, Li and Wu2003) developed one of the earliest models of gas cushioning during drop impact. Subsequently, Mandre, Mani & Brenner (Reference Mandre, Mani and Brenner2009) and Mani, Mandre & Brenner (Reference Mani, Mandre and Brenner2010) developed a systematic theoretical model based on lubrication theory using an incompressible as well as an isothermal and adiabatically compressible gas. They ignore intermolecular forces and show that the deformed droplet spreads on a thin film of air before making contact. Hicks & Purvis (Reference Hicks and Purvis2010) studied three-dimensional gas cushioning of a drop and obtained an estimate for the volume of the trapped gas bubble. Hicks & Purvis (Reference Hicks and Purvis2013) relaxed the isothermal and adiabatic constraints on the gas and also extended the model to include a solid body impacting a liquid surface.
In the case of the impact of a drop on a dry solid surface, recent experiments by Kolinski, Mahadevan & Rubinstein (Reference Kolinski, Mahadevan and Rubinstein2014) and de Ruiter et al. (Reference de Ruiter, Lagraauw, van den Ende and Mugele2015c) show that drops can bounce on smooth (hydrophilic) surfaces without making any physical contact. Such bouncing aided by a thin cushion of air film beneath the drop slows down the droplet motion and even causes it to reverse. Using interferometric techniques, de Ruiter et al. (Reference de Ruiter, Lagraauw, van den Ende and Mugele2015c) measured the thickness of the air film and showed them to be in the range of  $1\ \mathrm {\mu }\textrm {m}$ thickness. It is crucial in the above experiments to maintain a very smooth surface. Small asperities on the surface can lead to non-axisymmetric contact as was found in numerous earlier experiments (see Kolinski et al. Reference Kolinski, Rubinstein, Mandre, Brenner, Weitz and Mahadevan2012; de Ruiter et al. Reference de Ruiter, Oh, van den Ende and Mugele2012; Liu, Tan & Xu Reference Liu, Tan and Xu2013; Li, Vakarelski & Thoroddsen Reference Li, Vakarelski and Thoroddsen2015). For high-speed impacts where the drop makes contact with the surface, the air film thickness can reduce to nanometres where non-continuum effects cannot be ignored. To create atomically smooth surfaces, Pack et al. (Reference Pack, Hu, Kim, Zheng, Stone and Sun2017) deposited a thin layer of high viscosity oil on the solid surface and studied the failure of air film during impact. They argue that the thin oil layer results in a more controlled rupture unlike the asperity-driven rupture on regular dry solid surfaces.
We carry out axisymmetric direct numerical simulations of drop impact with no-slip and free-slip boundary conditions on the impact surface. In the case of a no-slip boundary condition the impact surface mimics a dry solid surface, whereas in the case of a free-slip boundary condition the impact surface becomes a surface of symmetry mimicking the head-on collision of two identical drops (Pan, Law & Zhou Reference Pan, Law and Zhou2008). The focus of this study is primarily on drop impacting a solid surface and discussion on head-on collisions is relegated to the end of the paper. For cases where the drop makes contact with a solid surface, the contact angle is fixed at a value of  $170^{\circ }$ to ensure that the drop undergoes a complete rebound after contact. The contact angle used here is similar to the values reported by Richard & Quéré (Reference Richard and Quéré2000) who also noted that contact angle hysteresis is less than
 $5^{\circ }$, thus justifying the use of a fixed contact angle in our simulations. The current study mainly focuses on moderate speeds of impact where the drop undergoes a complete rebound with a transition from an impact without contact to an impact with contact. The exact parameters at which this transition occurs is grid-dependent since experiments have reported that interface thicknesses can reduce to nanometres which is beyond the scope of most numerical simulations. Moreover, at such small scales, non-continuum effects cannot be ignored. Despite these limitations, we show later that our simulations broadly predict the region of transition between contactless and contact bouncing and agrees with many experimental studies. At speeds lower than the values used in the current study, the drop is likely to coalesce or deposit on the solid surface. At much higher speeds, the droplet will eventually make contact and can even undergo splashing. The splashing regime is not the focus of the current study.
There are two primary outcomes of drop impact in our simulations – the drop can bounce from the impact surface without making contact or the drop makes contact and then bounces from the impact surface. If the boundary condition on the impact surface is assumed to be symmetric, simulations are stopped when the drop makes contact with the surface. But for cases where the drop is supported on a thin cushion of gas, our simulations remain physically valid at all times. However, if the drop makes contact with the impact surface, coalescence, either complete or partial, is expected to ensue. Our simulations can broadly predict the transition between bouncing and coalescence, and we do not study the coalescence process in this study. In the case of the no-slip condition, if the drop bounces without making contact, wettability of the surface plays no role in the dynamics of bouncing, and, hence, our simulations can be compared with experiments where bouncing occurs even on hydrophilic surfaces (Kolinski et al. Reference Kolinski, Mahadevan and Rubinstein2014). Such bouncing is referred to as wettability-independent bouncing (de Ruiter et al. Reference de Ruiter, Lagraauw, van den Ende and Mugele2015c). Since a hydrophobic surface is used in our simulation, bouncing after contact is referred to as wettability-dependent bouncing. In the current work we mainly focus on the first bouncing event of the drop and mainly focus on the vicinity of impact. Evolution of various energies during the entire bouncing event will be discussed in a forthcoming paper. Our work complements earlier theoretical and numerical studies which have mainly used lubrication theory.
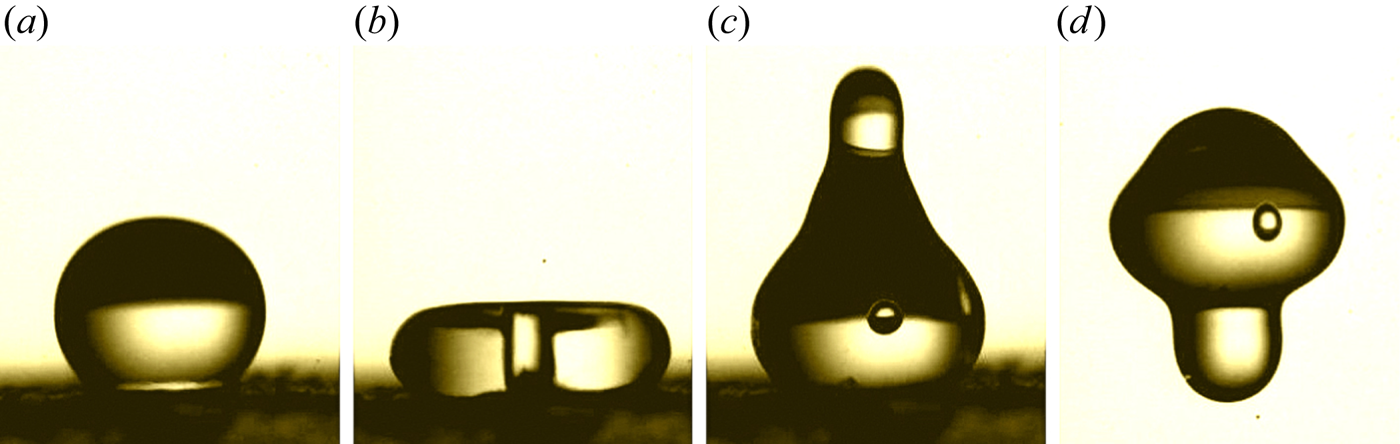
Drop shapes at the onset of impact can be broadly grouped into three categories, as shown in figure 1. In figure 1(a) the drop never makes contact with the impact surface and is supported on a thin and contiguous cushion of gas beneath it. Such a scenario is found to occur at low impact speeds. A dimple forms at the centre of the drop followed by an annular kink where the drop attains minimum height. A thin film of gas is trapped beneath the drop which evolves into a bubble. Experiments by Chandra & Avedisian (Reference Chandra and Avedisian1991) and Thoroddsen, Takehara & Etoh (Reference Thoroddsen, Takehara and Etoh2010) show that a tiny bubble is trapped underneath a drop for a wide range of parameters. The volume of the air film is typically small compared to the size of the drop, and as the inner contact line recedes, the gas film evolves into a tiny bubble and can even detach from the bottom surface. Thoroddsen et al. (Reference Thoroddsen, Etoh, Takehara, Ootsuka and Hatsuki2005) were among the first to systematically visualise the trapping of an air disk below an impacting drop by imaging the impact through a wedge. Using ultrafast X-ray phase-contrast imaging, San Lee et al. (Reference San Lee, Weon, Je and Fezzaa2012) visualised the air film beneath a drop and its evolution into a bubble for  $We = 55\text {--}70$ and
 $Re=1900\text {--}3200$ confirming the findings of Thoroddsen et al. (Reference Thoroddsen, Etoh, Takehara, Ootsuka and Hatsuki2005). Li et al. (Reference Li, Vakarelski and Thoroddsen2015) have carried out experiments with a resolution 200 ns to show that roughness leads to localised contacts creating a ring of microbubbles in the vicinity of first contact location similar to an earlier observation reported in Thoroddsen et al. (Reference Thoroddsen, Etoh, Takehara, Ootsuka and Hatsuki2005). Using freshly cleaved molecularly smooth mica surfaces, such microbubbles disappear implicating the role of roughness very clearly. Bouwhuis et al. (Reference Bouwhuis, van der Veen, Tran, Keij, Winkels, Peters, van der Meer, Sun, Snoeijer and Lohse2012) showed that there is a maximum limit to the size of the air bubble trapped beneath the droplet. For higher impact speeds, inertia and droplet size flatten the air film whereas, for small impact speeds, capillary forces limit the size of the air bubble. Recent experiments by de Ruiter, van den Ende & Mugele (Reference de Ruiter, van den Ende and Mugele2015a) provide one of the most detailed characterizations of the air cushion beneath a drop and show that there are two kinks that the air profile develops during its evolution. Their results show that the outer kink makes contact for
 $We \sim 1$ whereas the inner kink makes contact with the surface for
 $We \gtrsim 4$. These two scenarios are shown in figures 1(b) and 1(c), and our simulations show that the transition between these two types of contact occurs precisely at
 $We = 2.14$, independent of Reynolds number. Mehdi-Nejad, Mostaghimi & Chandra (Reference Mehdi-Nejad, Mostaghimi and Chandra2003) carried out axisymmetric simulations of water and n-heptane droplets and showed the formation of an air bubble beneath the drop. The pressure inside the bubble is found to be much higher than stagnation pressure and is found to be consistent with the values obtained by lubrication theory. The maximum resolution of their simulations was limited to
 $0.02\ \textrm {mm}$ and, hence, was unable to capture the complex interface profiles observed in recent experiments. Huang, Shu & Chew (Reference Huang, Shu and Chew2011) carried out three-dimensional lattice Boltzmann simulations and showed bubble entrapment for a range of
 $We$ and
 $Re$. However, their simulations are restricted to binary fluids of equal density and viscosity, unlike experiments which are characterised by large density and viscosity contrasts. Recently, Langley, Li & Thoroddsen (Reference Langley, Li and Thoroddsen2017) carried out experiments with ultra-high viscosity droplets and found that viscosity can suppress the kink formation found in lower viscosity drop impacts. As a result, the drop glides on a thin cushion of air and non-axisymmetric contact eventually occurs at multiple locations on the solid surface.
Schematic view of different types of drop–solid interaction found in the simulations:  $(a)$ drop bounces from the surface without making contact with the solid supported on a thin and contiguous cushion of air;
 $(b)$ drop makes contact at its outer periphery;
 $(c)$ drop makes contact near the axis of symmetry.

Drop impact dynamics is also relevant in cloud microphysics where collisions and coalescence of tiny droplets lead to the formation of larger drops, essential for initiation of rain (Grabowski & Wang Reference Grabowski and Wang2013). Falkovich, Fouxon & Stepanov (Reference Falkovich, Fouxon and Stepanov2002) suggested that turbulence in clouds accelerates rain initiation and is probably the missing link to explain the condensation–coalescence bottleneck. Tiny droplets in the cloud formed by condensation attain a typical size of  $20\ \mathrm {\mu }\textrm {m}$ and are smaller than a typical Kolmogorov eddy. Based on typical estimates of relative velocity, kinematic viscosity and surface tension, the Stokes (
 $\rho _l V_{rel} R/\mu _g$) and Weber numbers (
 $\rho _l V_{rel}^2 R/\sigma$) characterising collision between two drops of size
 $R = 40 \ \mathrm {\mu }\textrm {m}$ moving with a relative velocity of
 $V_{rel}$ of approximately
 $2\ \textrm {cm}\,\textrm {s}^{-1}$ is approximately 50 and
 $2\times 10^{-4}$, respectively. While the Stokes and Weber numbers in the current work are slightly higher than what is relevant to tiny drops within Kolmogorov eddies in clouds, it is easy to extend the current work to study collisions between droplets. Indeed, some simulations have been carried out for this case and is briefly discussed in the appendix.
The rest of the paper is broadly organized as follows. In § 2 the numerical set-up and boundary conditions are described along with validation of the numerical method. Section 3 is the heart of the paper. Here we present a parametric study in the form of phase diagrams classifying various regimes in drop impact dynamics, compare numerical results with scaling laws available in literature and also derive new scaling laws consistent with numerical data. A detailed discussion on each result in included within every subsection. We summarise key findings and conclude the paper in § 4.
2. Numerical set-up
We carry out direct numerical simulation of axisymmetric Navier–Stokes equations for a freely falling droplet of radius  $R_0$ starting from an initial height
 $H_0$. Gravity accelerates the drop towards the impact surface and we restrict focus of the present study to regions in the vicinity of the impact surface. For high surface tension cases where the droplet remains nearly spherical, subsequent impacts are expected to follow a self-similar pattern albeit with lower impact velocities; hence, we restrict our attention only to the first bouncing event. For lower surface tension cases, non-axisymmetric perturbation are likely to be excited due to perturbations from the impact surface. But for drops supported on a cushion of gas, we assume that such perturbations are low or completely absent. We use the well-known open-source solver Gerris (Popinet Reference Popinet2003, Reference Popinet2009) for all the simulations. Gerris tracks the interface between two fluids using the volume-of-fluid approach and a key feature of the solver is its accurate surface tension model. This is further facilitated by a quadtree adaptive mesh refinement feature allowing for accurate capture of the interface and its curvature. For the present study, we use Gerris to solve axisymmetric incompressible Navier–Stokes equations with immiscible fluids of different densities and viscosities and with constant surface tension. In almost all the simulations the viscosity ratio is identical to that of the air–water system. To show the effect of viscosity ratio, simulations are also carried out for gas to liquid viscosity ratio of 0.1. The density ratio is fixed at 0.01 except for cases where we validate our simulations against experiments where accurate values are used. A lower density ratio showed no major variation in results, such as in the case of an air–water system which has a density ratio of
 $0.001$. Since lubrication effects are sensitive to the viscosity of the gas, using the air–water viscosity ratio in all our simulations allows us to compare our results against experimental observations directly.
The problem is defined by a set of eight dimensional parameters, densities and viscosities of the drop (subscript  $d$) and surrounding gas (subscript
 $g$),
 $\rho _d, \rho _g, \mu _d, \mu _g$, surface tension,
 $\sigma$, drop radius,
 $R_0$, release height,
 $H_0$, and gravity,
 $g$. Using impact velocity,
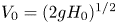 $V_0 = (2gH_0)^{1/2}$ as characteristic velocity, we can define four independent non-dimensional quantities: Reynolds number,
 $Re = \rho _d V_0 R_0/\mu _d$, Weber number,
 $We = \rho _d V_0^2 R_0/\sigma$, viscosity ratio,
 $\lambda = \mu _g/\mu _d$ and density ratio,
 $\rho _g/\rho _d$. Other popular choices for non-dimensional numbers used in literature include the Stokes number,
 $St = \rho _d V_0 R_0/\mu _g = Re/\lambda$, capillary number,
 $Ca_g = \mu _g V_0/\sigma = \lambda We/Re$ and Ohnesorge number,
 $Oh_g = \mu _g/\sqrt {\sigma \rho _d R_0} = \lambda We^{1/2}/Re$. We employ the following ranges for Weber, Reynolds and Stokes numbers in the present study:
 \begin{equation} We \approx (0.1\text{--}5), \quad Re\approx (10\text{--}2000), \quad St \approx (555\text{--}1.1\times 10^5). \end{equation}
In addition, we employ a fixed contact angle of  $170^{\circ }$ on the impact surface. The choice of using this contact angle is motivated by experiments of Richard & Quéré (Reference Richard and Quéré2000) who reported a contact angle of
 $\theta = 170^{\circ } \pm 3^{\circ }$ for a water droplet bouncing on a superhydrophobic surface. The variation in the above angle is negligible for their experiments and we therefore employ a fixed contact angle in all our simulations. Small hysteresis is a feature of superhydrophobic surfaces and, hence, it is convenient to carry out simulations with a fixed contact angle.
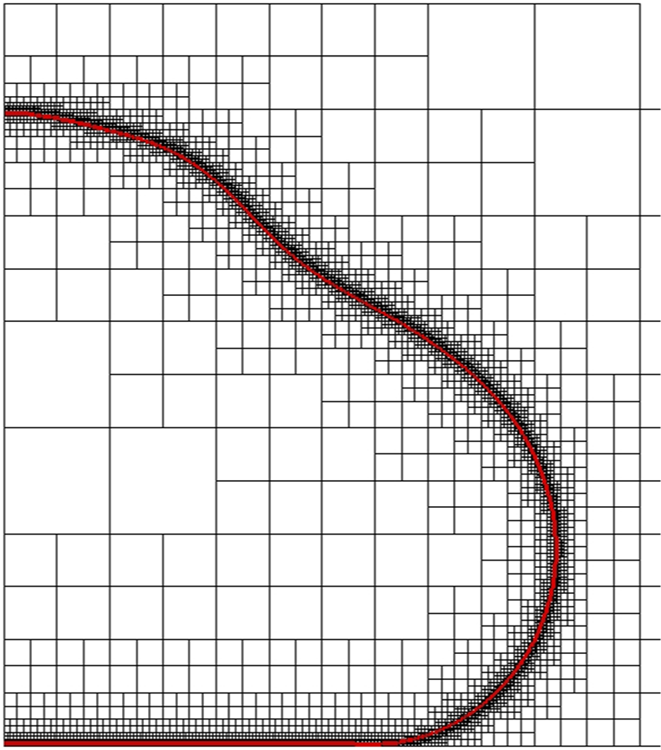
A typical grid around a droplet is shown in figure 2. In the quadtree adaptive mesh refinement feature, at each level, a square cell is divided into four equal and smaller square cells. In most of the simulations we employ a refinement level of 13 where the smallest cell size,  $\varDelta$, is
 $1/2^{13}$ of the domain size. Simulations with one higher level of refinement are also carried out to get a better estimate of the transition boundary between wettability-independent and wettability-dependent regions. Using a refinement level of 14, the ratio of cell size to drop size is given by
 $\varDelta /R_0 = 30/2^{14} \approx 1/2^9$. In terms of experimental values used in de Ruiter et al. (Reference de Ruiter, Lagraauw, van den Ende and Mugele2015c) where
 $R_0 \approx 1\ \textrm {mm}$, the highest resolution in our simulations is approximately
 $1.33\ \mathrm {\mu }\textrm {m}$. This value is comparable to the experimentally reported minimum film thickness, which ranges from
 $0.5\ \mathrm {\mu }\textrm {m}$ to
 $5\ \mathrm {\mu }\textrm {m}$. To minimize the effect of top and side boundaries, simulations are carried out in a large square domain of size
 $30 R_0 \times 30 R_0$ with the left edge of the box chosen as the axis of symmetry. A drop (half-circle) is initially located at a height
 $H_0 = 15 R_0$.
Typical view of the adaptive quadtree grid employed in the simulations showing a high density of grids at the droplet interface (shown in red). The axis of symmetry is on the right side of the image.

All the simulations are carried out assuming that the liquid and gas are well described by incompressible (continuum) equations. This sets a limit on the range of parameters, i.e.  $Re$ and
 $We$, that can be investigated by these simulations. A few thoughts on the validity of persisting with continuum simulations is in order. Using a nitrogen atmosphere at a temperature of 288 K and standard atmospheric pressure, we obtain a mean free path of approximately
 $100\ \textrm {nm}$. Based on gas film thicknesses of approximately
 $1 \ \mathrm {\mu }\textrm {m}$, the Knudsen number,
 $Kn$, defined as the ratio of mean free path to gas film thickness, assumes a value of
 $0.1$. This sets a limit on the thinnest gas film that can be obtained using continuum simulation since any value of
 $Kn$ higher than 0.1 necessitates the inclusion of non-continuum effects to capture the physics accurately. For very low gas film thicknesses, rarefaction effects can also become important, especially with experiments involving reduced ambient pressure (Xu et al. Reference Xu, Zhang and Nagel2005). Experiments examining the role of ambient pressure while simultaneously observing the thin gas film using total internal reflection imaging were recently carried out by Li et al. (Reference Li, Langley, Tian, Hicks and Thoroddsen2017). Such effects have been incorporated in theoretical/lubrication studies of Mandre et al. (Reference Mandre, Mani and Brenner2009) and Mani et al. (Reference Mani, Mandre and Brenner2010) but are challenging to incorporate in a direct numerical simulation. From a computational perspective, a lower limit for the grid size can be obtained by ensuring that
 $Kn$ based on grid size is always below 0.1. We arrive at a refinement level of 13 or 14 based on this estimate in the Gerris simulations. As far as incompressibility is concerned, for standard atmospheric conditions such as those used in recent experiments, excess pressure in the gas cushion is quite low, and the entire evolution process can be safely assumed to be governed by incompressible fluid dynamics as shown by de Ruiter et al. (Reference de Ruiter, Lagraauw, Mugele and van den Ende2015b). To justify the incompressibility assumption, we follow the work of Mandre et al. (Reference Mandre, Mani and Brenner2009) who defined a compressibility factor
 $\epsilon = P_0/(\mu _g R_0 V_0^7 \rho _g^4)^{1/3}$. It was argued in their paper that compressibility does not play a dominant role for
 $\epsilon \gtrsim 1$. The same factor was used in the experiments of de Ruiter et al. (Reference de Ruiter, Lagraauw, Mugele and van den Ende2015b) to argue that their experiments are in the incompressible regime. Written in terms of non-dimensional parameters defined in the previous paragraph, the compressibility factor can be rewritten as
 \begin{equation} \epsilon = \frac{1}{We St^{1/3}} \left(\frac{\rho_l}{\rho_g}\right)^{4/3}, \end{equation}
where  $We$ and
 $St$ are Weber and Stokes numbers, respectively. In our simulations, for
 $We\sim O(1)$,
 $St\sim O(10^4)$ and density ratio,
 $\rho _l/\rho _g=100$, we get
 $\epsilon \sim O(10)$ suggesting that the incompressibility approximation is largely valid. The above argument only suggests that compressibility does not play a dominant role, but does not rule out weak effects of compressibility along certain regions of the thin film in the experiments. We return to this point in the next section. Based on continuum and incompressibility considerations, the highest refinement used in the simulations, i.e. the smallest grid size near the solid surface was therefore kept at a value of close to
 $1 \ \mathrm {\mu }\textrm {m}$ and was deemed to be a border-line continuum simulation within the incompressible limit. Such a dimensional value for grid size was obtained by prescribing a dimensional value of
 $1\ \textrm {mm}$ for the drops used in our simulations, a value typically found in most experiments.
2.1. Validation
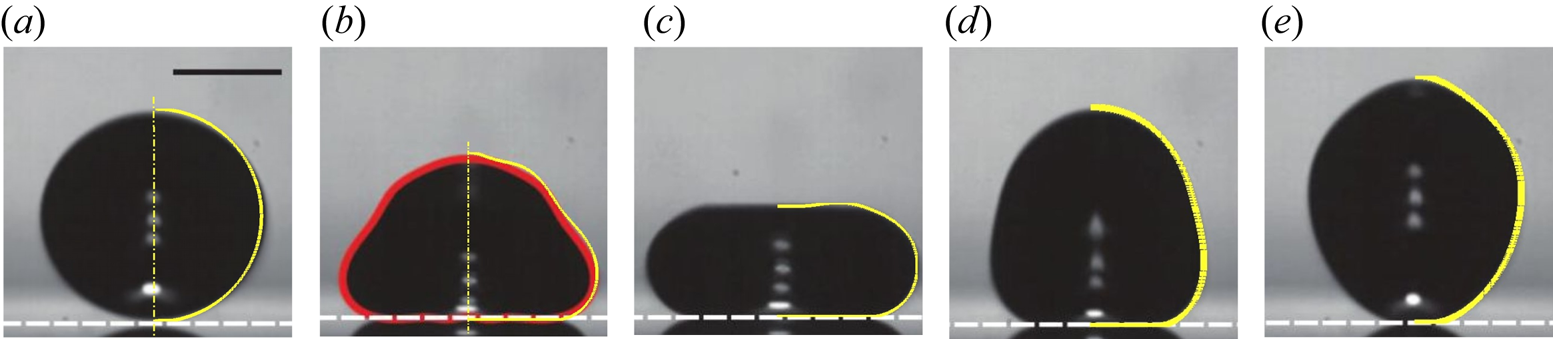
The solver Gerris is a well-tested solver for several standard test cases in multiphase flows and has been used in some recent drop impact studies (Visser et al. Reference Visser, Frommhold, Wildeman, Mettin, Lohse and Sun2015; Wildeman et al. Reference Wildeman, Visser, Sun and Lohse2016). We have verified several test cases such as the estimation of Laplace pressure jump across an interface for a stationary droplet and have also found excellent agreement in the shape and centroid position for a rising two-dimensional bubble. For the case of drop impact dynamics, we compare drop shapes against the experimentally obtained drop shapes by de Ruiter et al. (Reference de Ruiter, Lagraauw, van den Ende and Mugele2015c) for a water drop impacting a hydrophilic solid surface with  $\theta = 0^{\circ }$. The exact parameters used for the validation cases are identical to those of de Ruiter et al. (Reference de Ruiter, Lagraauw, van den Ende and Mugele2015c), but in rest of the sections we employ a density ratio of
 $1:100$ for computational simplicity. The smallest grid size employed in the validation cases is varied from
 $\varDelta /R_0=1.77\times 10^{-3}$ to
 $8.85\times 10^{-4}$ to verify the role played by grid refinement. Other parameters used in the simulation are identical to those reported in de Ruiter et al. (Reference de Ruiter, Lagraauw, van den Ende and Mugele2015c). In figure 3 the drop shapes obtained in simulations are found to be in excellent agreement with the shapes reported by de Ruiter et al. (Reference de Ruiter, Lagraauw, van den Ende and Mugele2015c). It has to be kept in mind that drops tend to oscillate upon release from a needle unlike in our simulations where a sphere is used as the initial condition. This could therefore lead to minor variations in the overall drop shape, nevertheless, these appear to be too small to be visible in figure 3.
Comparison of drop shapes during the bouncing process obtained from simulations with the images reported by de Ruiter et al. (Reference de Ruiter, Lagraauw, van den Ende and Mugele2015c) for times 0, 2.3, 4, 7.5 and 9 ms. The yellow curves are the shapes obtained from the axisymmetric simulations. Dimensional parameters employed are identical to those in de Ruiter et al. (Reference de Ruiter, Lagraauw, van den Ende and Mugele2015c):  $R_0=1.03\ \textrm {mm}$,
 $H_0=3.61\ \textrm {mm}$,
 $\rho _l=996.9\ \textrm {kg}\,\textrm {m}^{-3}$,
 $\rho _g=1.225\ \textrm {kg}\,\textrm {m}^{-3}$,
 $\mu _l=0.001\ \textrm {Pa}\,\textrm {s}$,
 $\mu _g=1.81 \times 10^{-5}\ \textrm {Pa}\,\textrm {s}$,
 $\sigma =0.0646\ \textrm {N}\,\textrm {m}$.

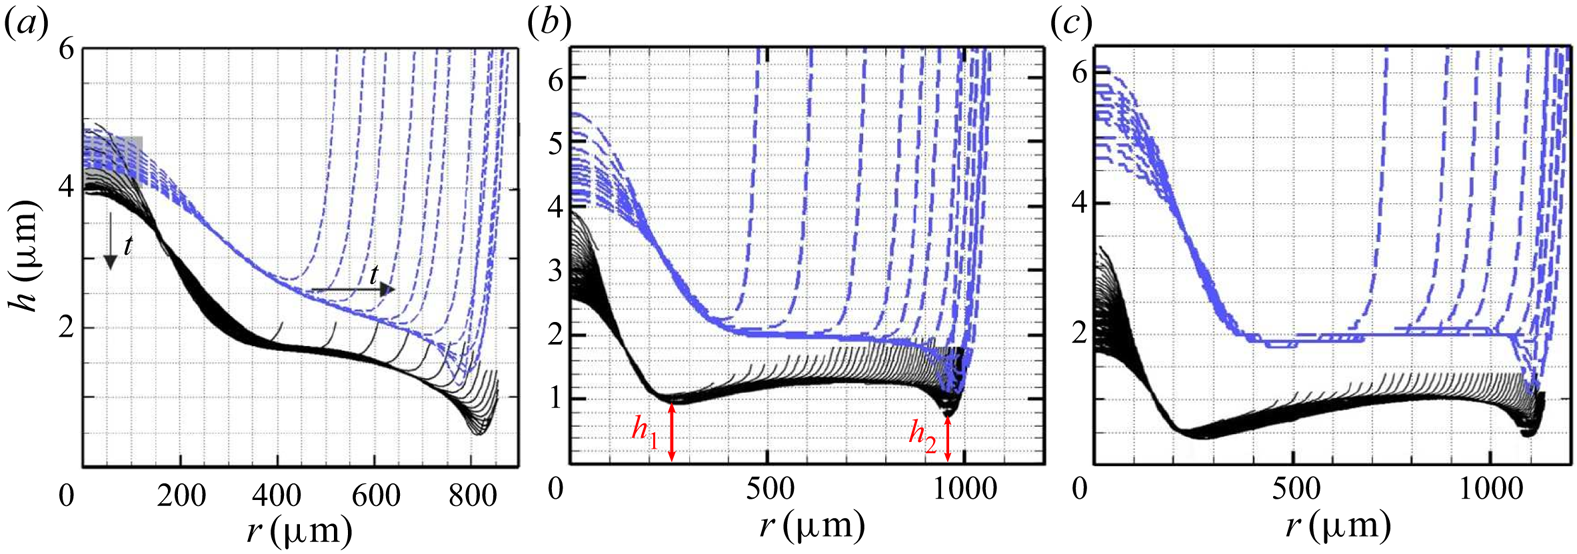
Since the focus of the present study is on dynamics near the impact surface, we also compare the drop-gas interface profiles with experiments. Figure 4 shows that the drop-gas interface profiles obtained in the simulations are qualitatively similar to the interferometric measurements of gas film thicknesses reported in de Ruiter et al. (Reference de Ruiter, van den Ende and Mugele2015a). It has to be noted that the simulations are in fairly good agreement with the experiments as far as the location of the kink is concerned. However, the minimum gas film thickness at the kink,  $h_{min}$, is found to differ by a factor of two or three at this resolution. The large variation between the horizontal extent of the drop,
 $O(1000 \ \mathrm {\mu }\textrm {m})$, and the vertical extent of the gas film,
 $O(1\ \mathrm {\mu }\textrm {m})$, both in experiments and simulations, further exacerbates the difficulty in achieving fully resolved direct numerical simulations. It has to be noted that the large aspect ratio of the gas film ensures that lubrication theory of Mani et al. (Reference Mani, Mandre and Brenner2010) and others are broadly valid. Since the primary focus was to resolve the vertical extent of the gas films, our simulations inadvertently lead to poor resolution near the axis of symmetry. This explains the discrepancy in gas film thickness between computations and experiments near the axis of symmetry, i.e. near
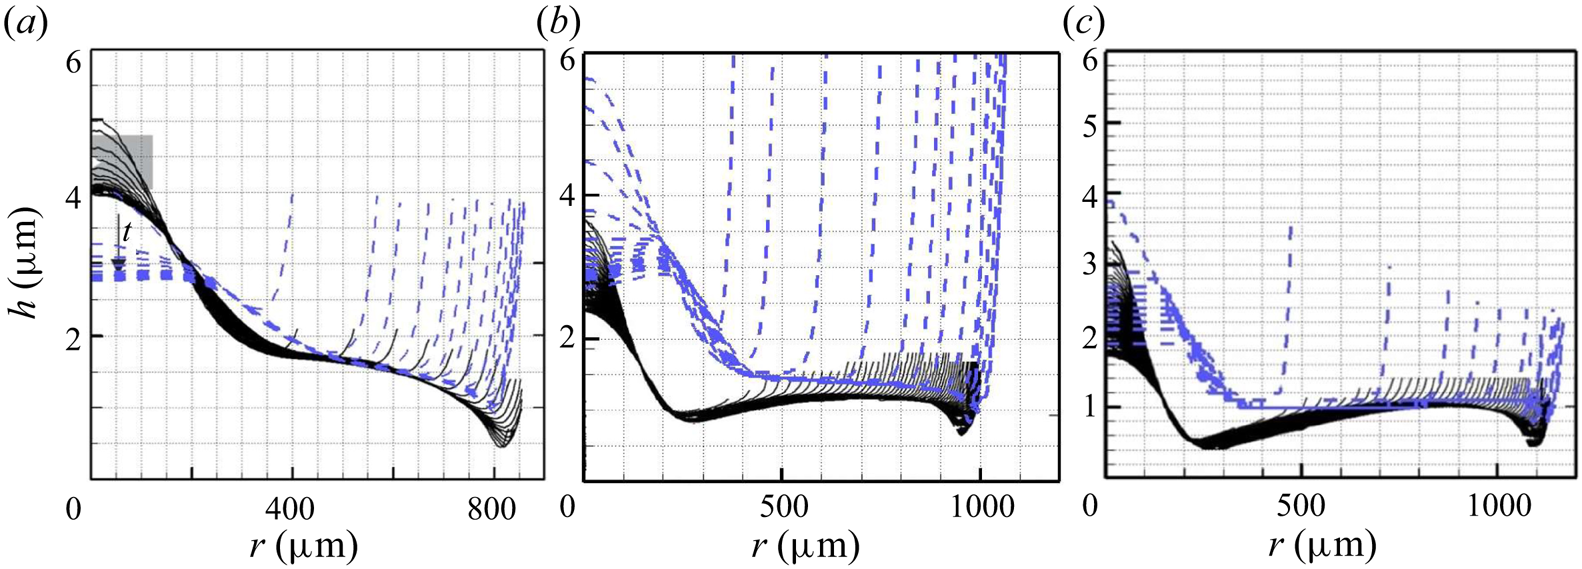
 $r \rightarrow 0$. To further improve the comparison, simulations with one higher level of refinement were carried out. This leads to better agreement of drop-gas interface profile shapes near the outer kink as evident in figure 5, but still suffer from insufficient resolution near the axis of symmetry. A number of factors could be responsible for the disagreement between simulations profiles and experiments shown in figures 4 and 5. The first among them is the compressibility of the gas film in the experiments which are not accounted for in the simulations. Though these simulations fall in the incompressible regime as per the criteria given by Mandre et al. (Reference Mandre, Mani and Brenner2009), it does not necessary rule out weakly compressible regions along the thin lubricating film. A second reason is the minor difference in the impact velocity. Only impact velocity is reported in de Ruiter et al. (Reference de Ruiter, van den Ende and Mugele2015a) without information on the release height or the time instant at which the impact velocity is recorded. We therefore determine release height as
 $H_0 = U_0^2/2g$, where
 $U_0$ is obtained from the Weber number reported in the experiments. Drag from the surrounding gas as well as deceleration encountered near the solid in our simulations lead to minor differences in impact velocity vis-à-vis experiments. The third reason could be minor differences in overall drop shape just before impact. While a spherical drop is used at
 $t=0$, oscillations are inevitable in the experiments which may cause small undulations on the lower surface of the drop just before impact contributing to differences between experimental and simulations profiles. In spite of these differences, it is evident in figures 4 and 5 that there is a fairly good qualitative agreement in drop shapes with experiments. To the best of our knowledge, such a comparison of gas film profile has not been made in any earlier direct numerical simulation. Simulations with an even high refinement have been carried out for the same set of parameters and show no appreciable change in the shape of the drop-gas interface profile. See supplementary figure. No effort was made to improve these simulations further due to the prohibitive computational costs involved. Other numerical methods have also been employed in the literature such as the axisymmetric boundary integral simulations of the Laplace equation in the drop coupled with lubrication equations in the gas by Bouwhuis et al. (Reference Bouwhuis, van der Veen, Tran, Keij, Winkels, Peters, van der Meer, Sun, Snoeijer and Lohse2012). It is difficult to precisely quantify the differences between their results and ours due to different parameters employed, but it is evident from comparing results in figure 5 with figure 3 of Bouwhuis et al. (Reference Bouwhuis, van der Veen, Tran, Keij, Winkels, Peters, van der Meer, Sun, Snoeijer and Lohse2012) that the present simulations perform on par with other lubrication theory based numerical simulations.
Time evolution of drop–gas interface profiles near the solid surface during its spreading phase obtained from simulations (dashed curves) overlaid on experimental profiles of de Ruiter et al. (Reference de Ruiter, van den Ende and Mugele2015a) for the following cases:  $(a)$
 $We=0.83, Re = 233$,
 $(b)$
 $We=1.82, Re = 345$,
 $(c)$
 $We=3.19, Re = 457$. All other parameters are identical to those given in de Ruiter et al. (Reference de Ruiter, van den Ende and Mugele2015a). The finest grid size at the drop-gas interface is
 $\varDelta /R_0=1.77\times 10^{-3}$ in these simulation.

Same as figure 4 but with one higher level of refinement. The finest grid size at the drop-gas interface is  $\varDelta /R_0 = 8.85\times 10^{-4}$. All other parameters remain unaltered. The simulation with resolution
 $\varDelta /R_0 = 4.425 \times 10^{-4}$ shows a very similar drop-gas interface profile and is included as supplementary figure available at https://doi.org/10.1017/jfm.2020.773.

3. Result and discussion
3.1. Regions of wettability-dependent and wettability-independent bouncing
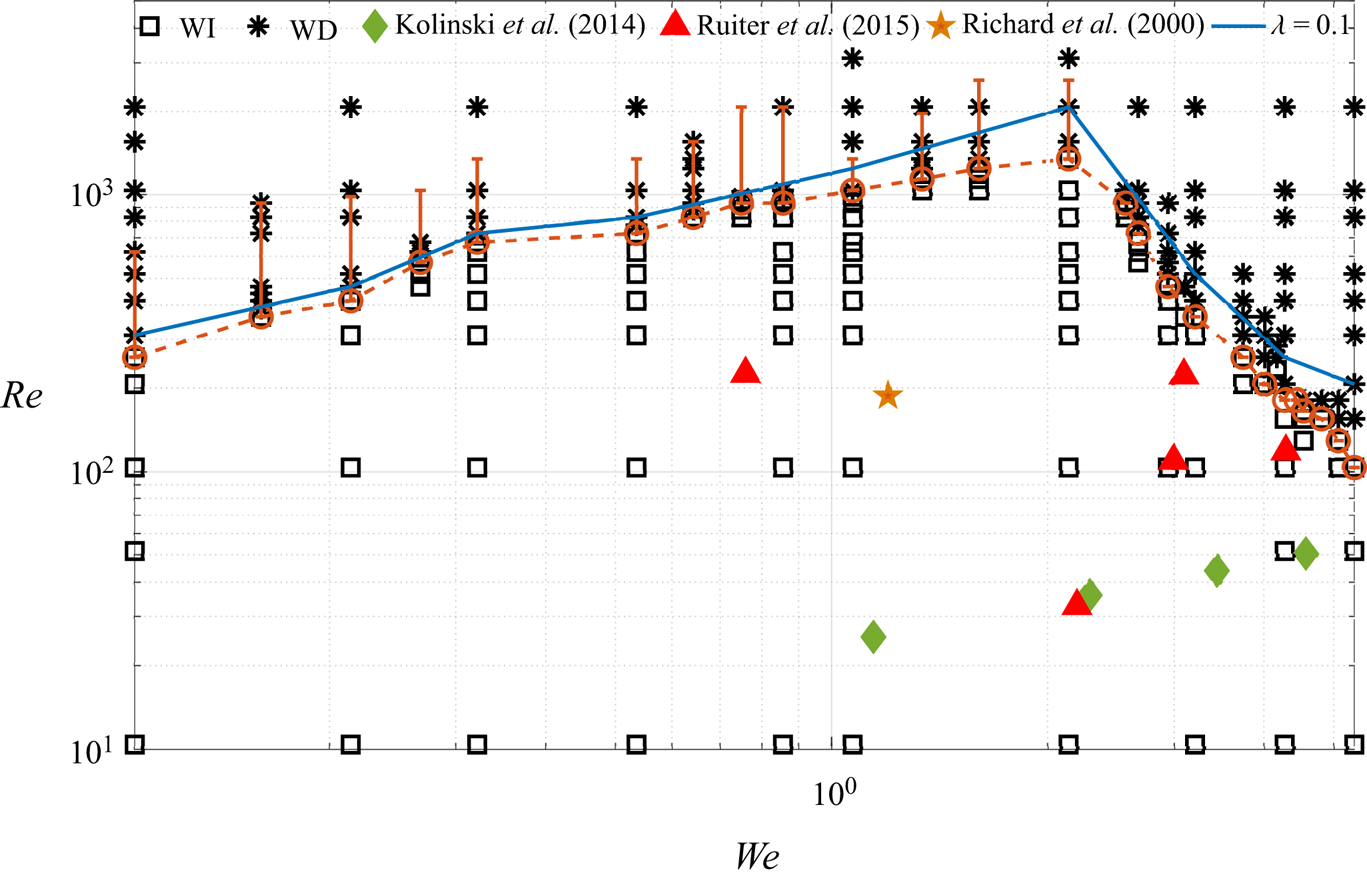
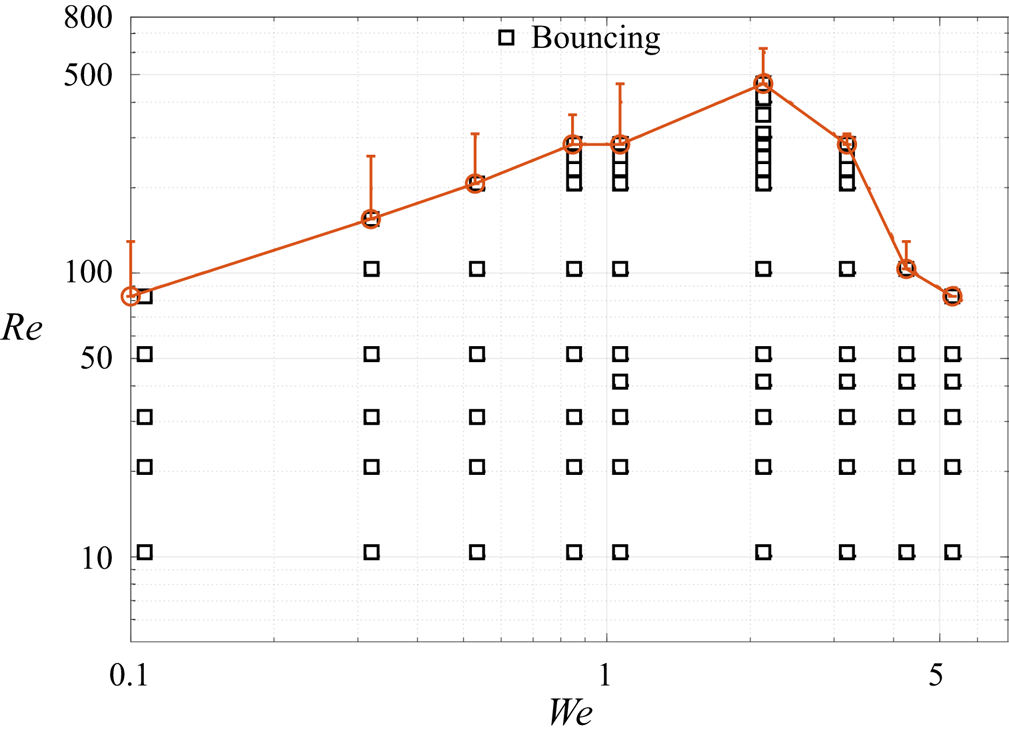
In the previous section it is shown that simulations can resolve the shape of the drop and the gas film beneath it quite well. We show below that predictions from the simulations about the drop's wettability is again consistent with experiments. The key result of the study is presented in the form of a phase diagram in the  $Re\text {--}We$ plane as shown in figure 6. The phase diagram separates regions of wettability-independent (WI) bouncing from wettability-dependent (WD) bouncing. The orange-dashed separating boundary curve for air–water viscosity ratio,
 $\lambda =0.018$, has a distinct peak at
 $We=2.14$ when inertia and surface tension are perfectly in balance. For
 $We<2.14$, surface tension dominates and in the
 $We\rightarrow 0$ limit the droplet is expected to remain spherical preventing build up of pressure in the gas cushion. Hence, the transition boundary between WI and WD falls off towards lower
 $Re$ values as
 $We$ decreases. For large
 $We$, the drop undergoes large deformation which generates a great deal of internal motion inside the drop. Due to the lower value of surface tension accompanied by increasing
 $We$, pronounced oscillations occur on the upper surface of the drop. We show in § 3.2 that surface oscillations generate strong downward velocity fields inside the drop causing rupture of the gas film below. With increasing
 $We$, the rupture process is controlled by strong oscillations of the drop suggesting that the transition boundary falls off to lower values of
 $Re$ for
 $We>2.14$. From the above discussion, it is clear that the reasons for rupture of the gas film are fundamentally different on either side of the
 $We=2.14$ peak in figure 6. This suggests that
 $We=2.14$ is the optimal value of Weber number which can support a gas cushion for the widest range of Reynolds numbers. A similar result is found with a different viscosity ratio,
 $\lambda =0.1$ (blue curve) with a peak again at
 $We=2.14$. Experiments of Kolinski et al. (Reference Kolinski, Mahadevan and Rubinstein2014) and de Ruiter et al. (Reference de Ruiter, Lagraauw, van den Ende and Mugele2015c) who reported wettability-independent bouncing are also included in figure 6 and are found to be well within the WI region. For a given
 $We$, with an increase in
 $Re$, the gas film thickness beneath the drop reduces its thickness and eventually contact occurs. Subsequent evolution of the drop depends on the wettability of the surface. In the current study, since the contact angle was kept constant at
 $170^{\circ }$, the drop was found to undergo complete rebound for the entire range of parameter values in the WD region. For very high values of
 $Re$ or
 $We$, splashing and/or disintegration of the drop may occur, but such high values were not explored in the current study.
Phase diagram showing the transition from non-contact (wettability-independent or WI) to contact (wettability-dependent or WD) type of interaction with the solid surface. The boundary between the two regions is shown with a dashed-red curve for viscosity ratio  $\lambda = 0.018$ (air–water case). Below the dashed-red curve, shown with (
 $\square$), lies the WI region where the drop is supported on a thin cushion of gas beneath it. The WD region is shown with (
 $\ast$) where the drop makes contact with the surface. The gas film approaches negligible thicknesses near the transition boundary and is expected to be grid-dependent. Vertical orange bars show the extent to which the transition boundary moves upwards in
 $Re$ with a decrease in grid size. Experimental studies of Richard & Quéré (Reference Richard and Quéré2000) (
 $\bigstar$, orange), Kolinski et al. (Reference Kolinski, Mahadevan and Rubinstein2014) (
 $\blacklozenge$, limegreen) and de Ruiter et al. (Reference de Ruiter, Lagraauw, van den Ende and Mugele2015c) (
 $\blacktriangle$, red) are also shown for comparison. A similar transition boundary was observed for a higher viscosity ratio,
 $\lambda =0.1$, shown with a blue curve. The symbols show the corresponding values of
 $Re$ and
 $We$ in the simulations and experiments.

The transition boundary between WI and WD regions is expected to vary in experiments as explained below. Experimental results (Kolinski et al. Reference Kolinski, Mahadevan and Rubinstein2014; de Ruiter et al. Reference de Ruiter, van den Ende and Mugele2015a; Li & Thoroddsen Reference Li and Thoroddsen2015; de Ruiter et al. Reference de Ruiter, Lagraauw, van den Ende and Mugele2015c; Pack et al. Reference Pack, Hu, Kim, Zheng, Stone and Sun2017) show that in some cases, gas film thickness can vary between  $30\ \textrm {nm}$ and
 $500\ \textrm {nm}$ before contact ensues. For such low values of film thickness, intermolecular forces and non-continuum effects cannot be ignored during the final rupture process. Since both these effects have been ignored in the current study, we expect some variation in the actual location of the transition boundary in the phase diagram. Another issue of concern is the grid dependence of the transition boundary, which is expected to vary with changing grid refinement. This is a common issue in computations of many other interfacial phenomena such as in coalescence or pinch-off of two drops or bubbles. Nevertheless, the results presented are broadly valid for the entire range of parameters studied. Similar uncertainty exists in experiments in defining the transition boundary. De Ruiter et al. (Reference de Ruiter, van den Ende and Mugele2015a) and Li et al. (Reference Li, Vakarelski and Thoroddsen2015) discuss at length the eventual collapse of the gas film when it decreases below
 $200\ \textrm {nm}$ and show that the exact critical value of film thickness at which contact ensues depends on the roughness of the surface.
Despite the above challenges, the results on either side of the transition boundary are reliable and are in good agreement with experiments. The shape of the transition boundary is quite robust as evident from a similar shape appearing in two-dimensional simulations (not shown here) and simulations with a free-slip boundary condition representing drop–drop head-on collision (Gopinath & Koch Reference Gopinath and Koch2002). The latter case is presented in the appendix and clearly shows a peak at  $We=2.14$. The invariance of shape with different boundary conditions at the impact surface shows that the mechanism for gas film rupture is broadly the same and universal.
3.2. Classification of phase diagram
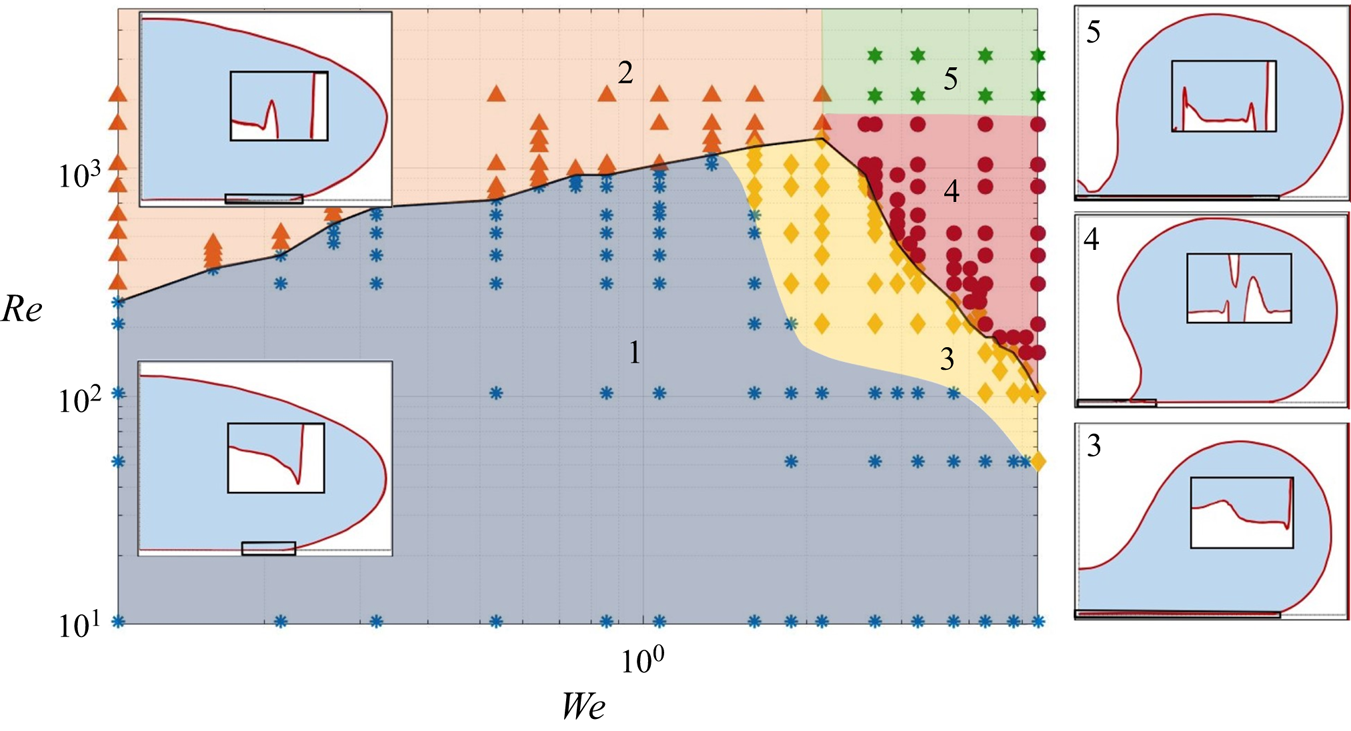
In § 3.1 the  $Re\text {--}We$ plane is broadly divided into two categories, the WI region and WD region. A closer examination of interface shapes near the solid surface reveals that the entire region can be further divided into five distinct regions, as shown in figure 7. Regions 1 and 3 fall into the WI region, i.e. the minimum gas film thickness below the drop is non-zero, whereas regions 2, 4 and 5 comprise of the WD region where the gas film undergoes rupture.
Division of the phase diagram into five sub-regions, numbered 1–5, based on the shape of the drop and gas film beneath it. The typical shape of the drop in each region is shown in separate inset figures. In regions 3, 4, 5, the drop develops a large negative curvature on its upper surface which is largely absent in regions 1 and 2. The shape of the gas film in each of these regions differs significantly, shown over a small rectangular region close to the solid surface within each inset figure.

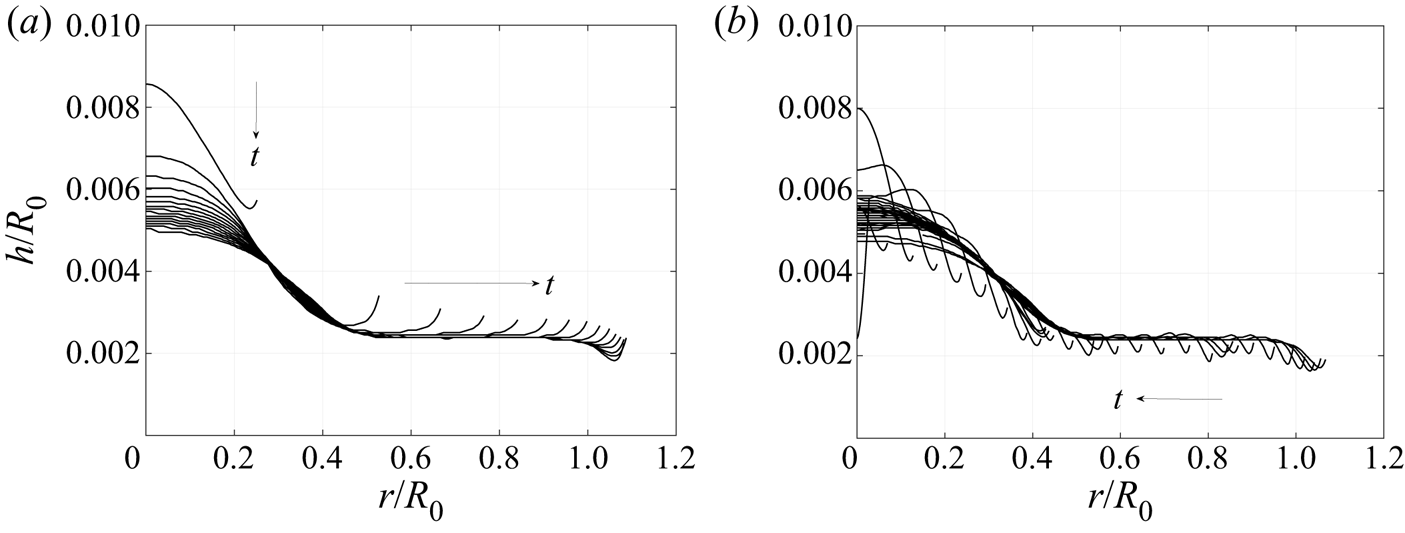
In region 1, shown with blue dots in figure 7 for parameter values where simulations were carried out, the minima of the gas film thickness occurs at the outer periphery of the gas film. The gas film thickness at this location is referred to as  $h_2$ in de Ruiter et al. (Reference de Ruiter, Oh, van den Ende and Mugele2012). Surface tension regularises the kink causing the curvature to change sign, thus allowing a thin film of gas to be present below the drop. For lower values of
 $Re$, region 1 was found to occur for the entire range of Weber numbers studied. As the Reynolds number increases, region 1 transitions to either region 2 or region 3. The gas film profiles for a sample case in region 1 for
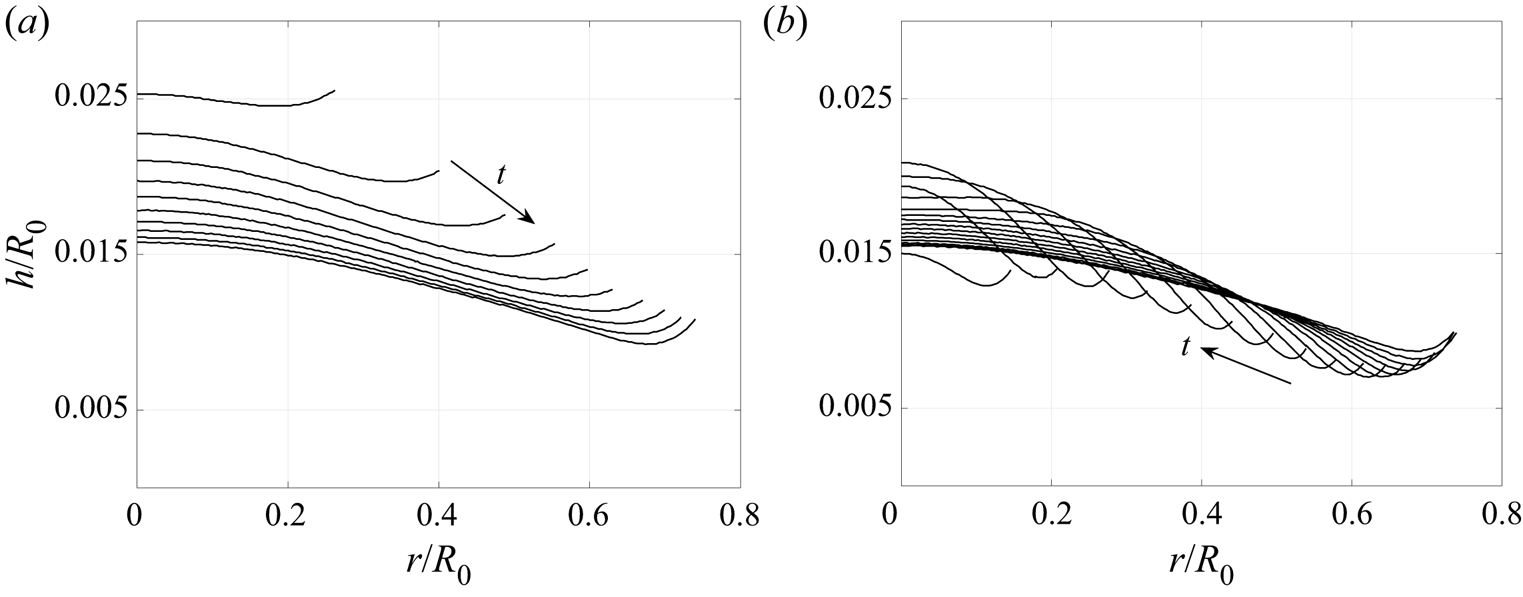
 $We=1.07$ and
 $Re=10.35$ are shown in figure 8, showing that the drop advances and recedes on a gas cushion in a gentle fashion. Note that in this particular case, the minima in the gas film thickness is attained during the receding motion of the drop, as clearly evident in figure 8(b). The results are presented in non-dimensional height
 $h/R_0$ and reaches a minimum value of 0.007. In physical terms, for a drop of
 $R_0 = 1\ \textrm {mm}$ with the same
 $We$ and
 $Re$, the minimum gas film thickness will be approximately
 $7\ \mathrm {\mu }\textrm {m}$. Large scale surface oscillations on the drop are highly damped at this Reynolds number. Hence, no significant wave-like motion is observed in the drop-gas interface profile. This can be directly contrasted with gas film evolution from another case in region 1 at
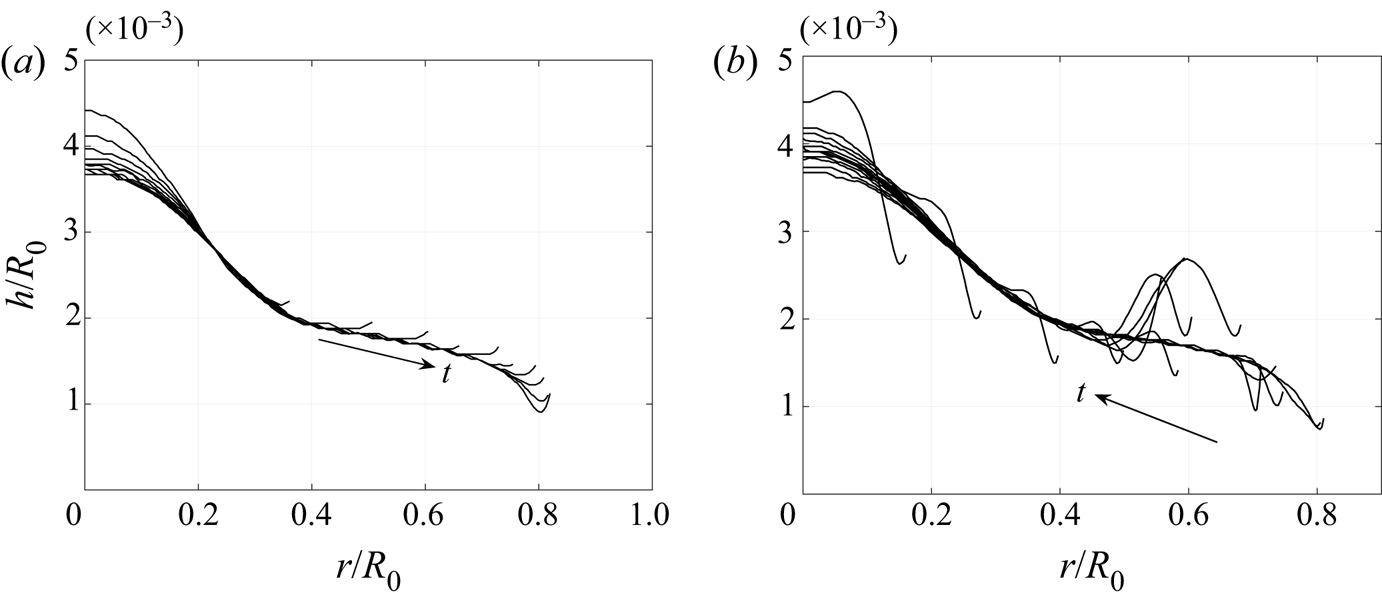
 $We=1.07$ and
 $Re=517.5$ shown in figure 9. Since the ratio of inertia to surface tension has not changed, there is no appreciable variation in the spreading radius, but at this
 $Re$, global oscillations on the upper surface of the drop during ‘contact’ remain undamped for a longer duration. These oscillations lead to strong fluctuations in the drop-gas interface profile as can be seen in figure 9(b). The minimum in the gas film thickness is obtained during its receding motion and reaches a value of
 $8 \times 10^{-4}$, which translates to approximately
 $0.8\ \mathrm {\mu }\textrm {m}$ for a drop
 $R_0 = 1\ \textrm {mm}$ radius.
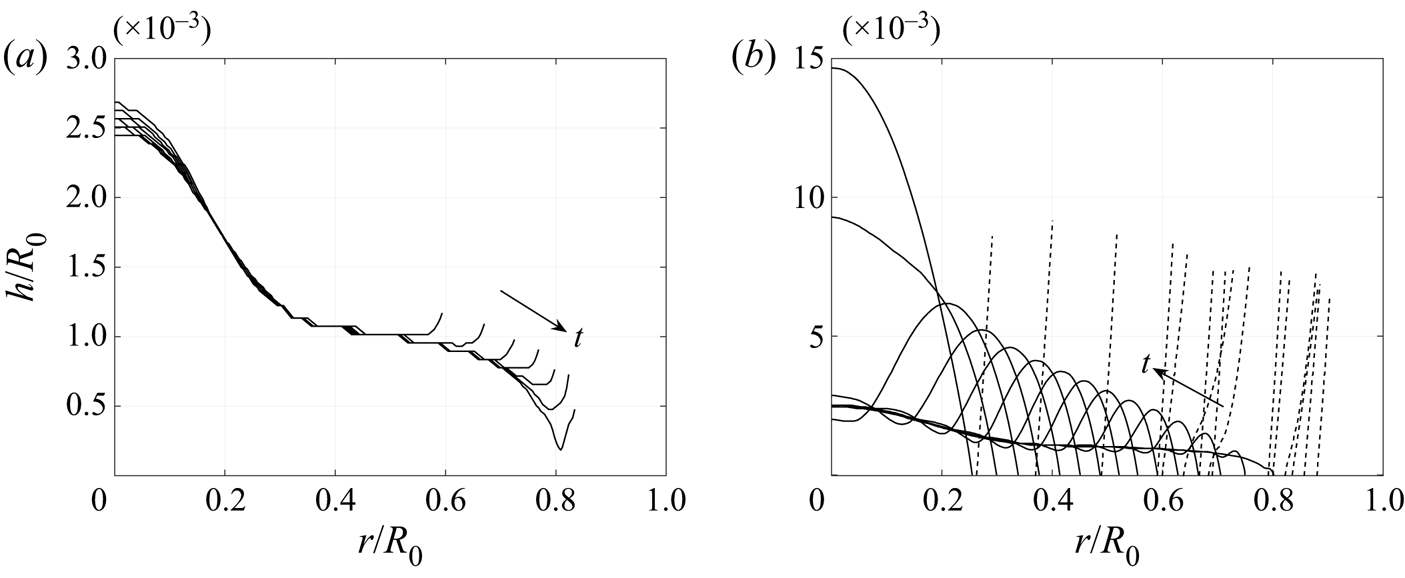
Time evolution of the drop–gas interface profile for a sample case in region 1 of figure 7 with  $We=1.07$ and
 $Re=10.35$ during
 $(a)$ the spreading stage from
 $(t-t_0)/\tau =0$ to 0.81 and
 $(b)$ the receding stage from
 $(t-t_0)/\tau =0.9$ to 1.71 plotted in equal time intervals of
 $t/\tau =0.09$. Interface profile develops a single minima which gently spreads radially in time, reaches a global minima,
 $h_{min}$, before receding inwards and then eventually retreating from the solid surface. See supplementary movie 1 for the complete drop evolution.

Temporal evolution of drop–gas interface profile with  $We=1.07$ and
 $Re=517.5$ contained in region 1 of the phase diagram for
 $(a)$ the spreading stage from
 $(t-t_0)/\tau =0$ to 0.81 and
 $(b)$ the receding stage from
 $(t-t_0)/\tau =0.9$ to 2.07 plotted in equal time intervals of
 $t/\tau =0.09$. Due to lower viscous damping, the receding stage exhibits localised bulges in the gas film prompted by strong oscillations on the outer surface of the drop. As a result, the receding motion of the outer kink is not monotonic in time. See supplementary movie 2 for the complete drop evolution.

With a further increase in Reynolds number, lubrication forces cannot prevent the drop from making contact with the surface. For cases with  $We \le 2.14$, the outer kink or minima eventually makes contact with the solid surface, i.e.
 $h_2 \rightarrow 0$. The drop-gas interface profiles during the spreading and receding stages for
 $We=1.07$ and
 $Re=1552.5$ are shown in figure 10. For this particular case, touchdown occurs only when the kink reaches its maximum extent, i.e. the drop makes contact with the surface when the receding motion begins. This leads to the creation of two contact lines, an inner contact line within which a gas film is trapped and an outer contact line which connects to the rest of the drop. As the inner contact line retreats inward, a bulge in the gas layer forms on its outer rim whose height increases with time to conserve volume. The simulations are carried out on a superhydrophobic surface with a fixed contact angle of
 $170^{\circ }$, hence, the drop eventually retracts from the surface. Since the focus of the current study is primarily on the initial stages of drop evolution, we do not focus on the motion of the drop in its flight in this work. This will be presented in a forthcoming paper focusing on the energetics of the drop impact process.
Temporal evolution of the drop–gas interface profile with  $We=1.07$ and
 $Re=1552.5$ contained in region 2 of the phase diagram for
 $(a)$ the spreading stage from
 $(t-t_0)/\tau =0$ to 0.54 and
 $(b)$ the receding stage from
 $(t-t_0)/\tau =0.63$ to 1.89 plotted in equal time intervals of
 $t/\tau =0.09$. The initially stable gas film ruptures at the outer kink forming a contact line. Due to the superhydrophobic nature of the solid surface, the drop recedes from the surface. Similar to the receding motion of the outer kink in figure 9, the contact line motion is highly non-monotonic in time.

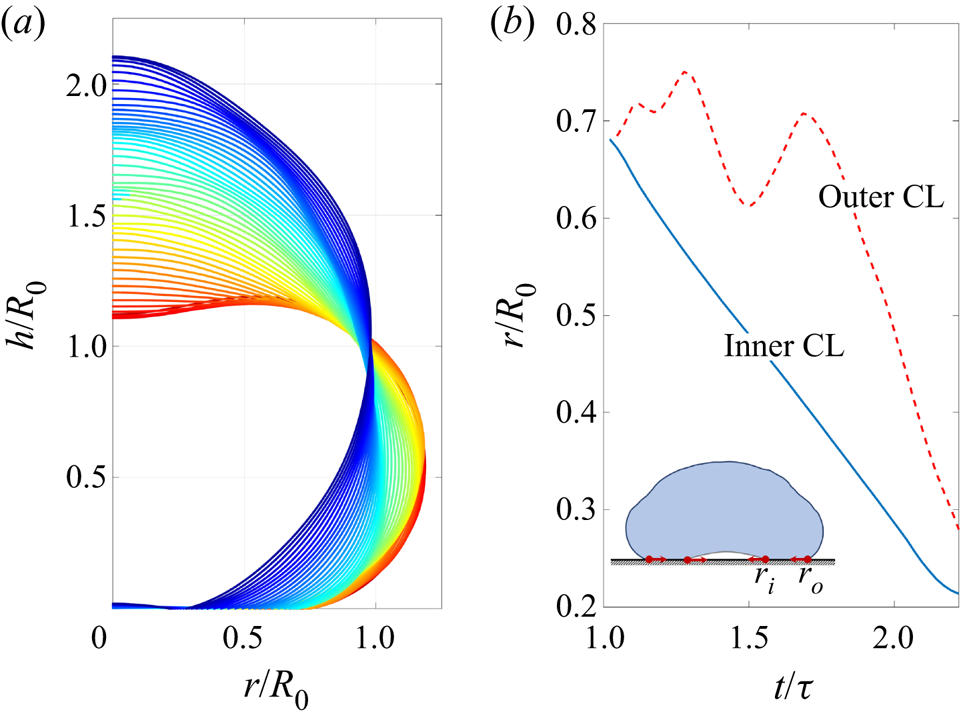
Figure 11 shows the evolution of contact line motion for a sample case in region 2 in its receding stage. For this case with  $We=0.535$ and
 $Re=1035$, contact occurs at the end of its spreading stage. Such a scenario was found in almost all the cases simulated for
 $We\leq 2.14$, where the drop makes contact with the solid. The motion of the inner contact line occurs due to retraction of the gas bubble while the motion of the outer contact line is dominated by the strong oscillations on the outer surface of the drop. It is interesting to note that the inner contact line,
 $r_i(t)$, recedes with a constant velocity whereas the outer contact line,
 $r_o(t)$, recedes with an oscillatory response due to strong capillary oscillations on the drop shape as shown in figure 11(a). In this particular case, the drop dominantly exhibits a mode 2 response which causes the large-amplitude oscillation of the outer contact line motion in figure 11(b). The smaller amplitude oscillations correspond to higher modes and become progressively important at larger Weber numbers.
Variation of drop shape and evolution of contact line motion for  $We=0.53$ and
 $Re=1035$ during the receding stage.
 $(a)$ The drop shape at the onset of the receding stage (
 $(t-t_0)/\tau =1.02$) is shown in red while the blue coloured shape shows the drop at the onset of lift-off.
 $(b)$ Temporal evolution of the inner,
 $r_i$, and outer,
 $r_o$, contact lines during the receding stage. A schematic of the drop with both the contact lines is shown in the inset. Presence of an inner contact line reveals entrapment of a gas bubble. The oscillatory nature of the outer contact line motion,
 $r_o(t)$, is due to strong oscillations on the outer surface of the drop.

With the increase in Weber number, the inner kink, referred to as  $h_1$, decreases in height and eventually takes a value lower than the outer kink,
 $h_2$. The region in the phase diagram when this occurs is referred to as region 3. A typical interface shape during spreading and receding stages is shown in figure 12 for
 $We=3.21$ and
 $Re=207$. The transition boundary between region 1 and region 3 cannot be precisely defined. Hence, the colouring scheme in figure 7 is only indicative. Our simulations are consistent with interface shapes reported in de Ruiter et al. (Reference de Ruiter, van den Ende and Mugele2015a) and as shown in figure 4, the change in interface shape in their experiments, from a minima at
 $h_2$ to a minima at
 $h_1$, is both Weber and Reynolds number dependent. The exact reason for the reduction in interface thickness at
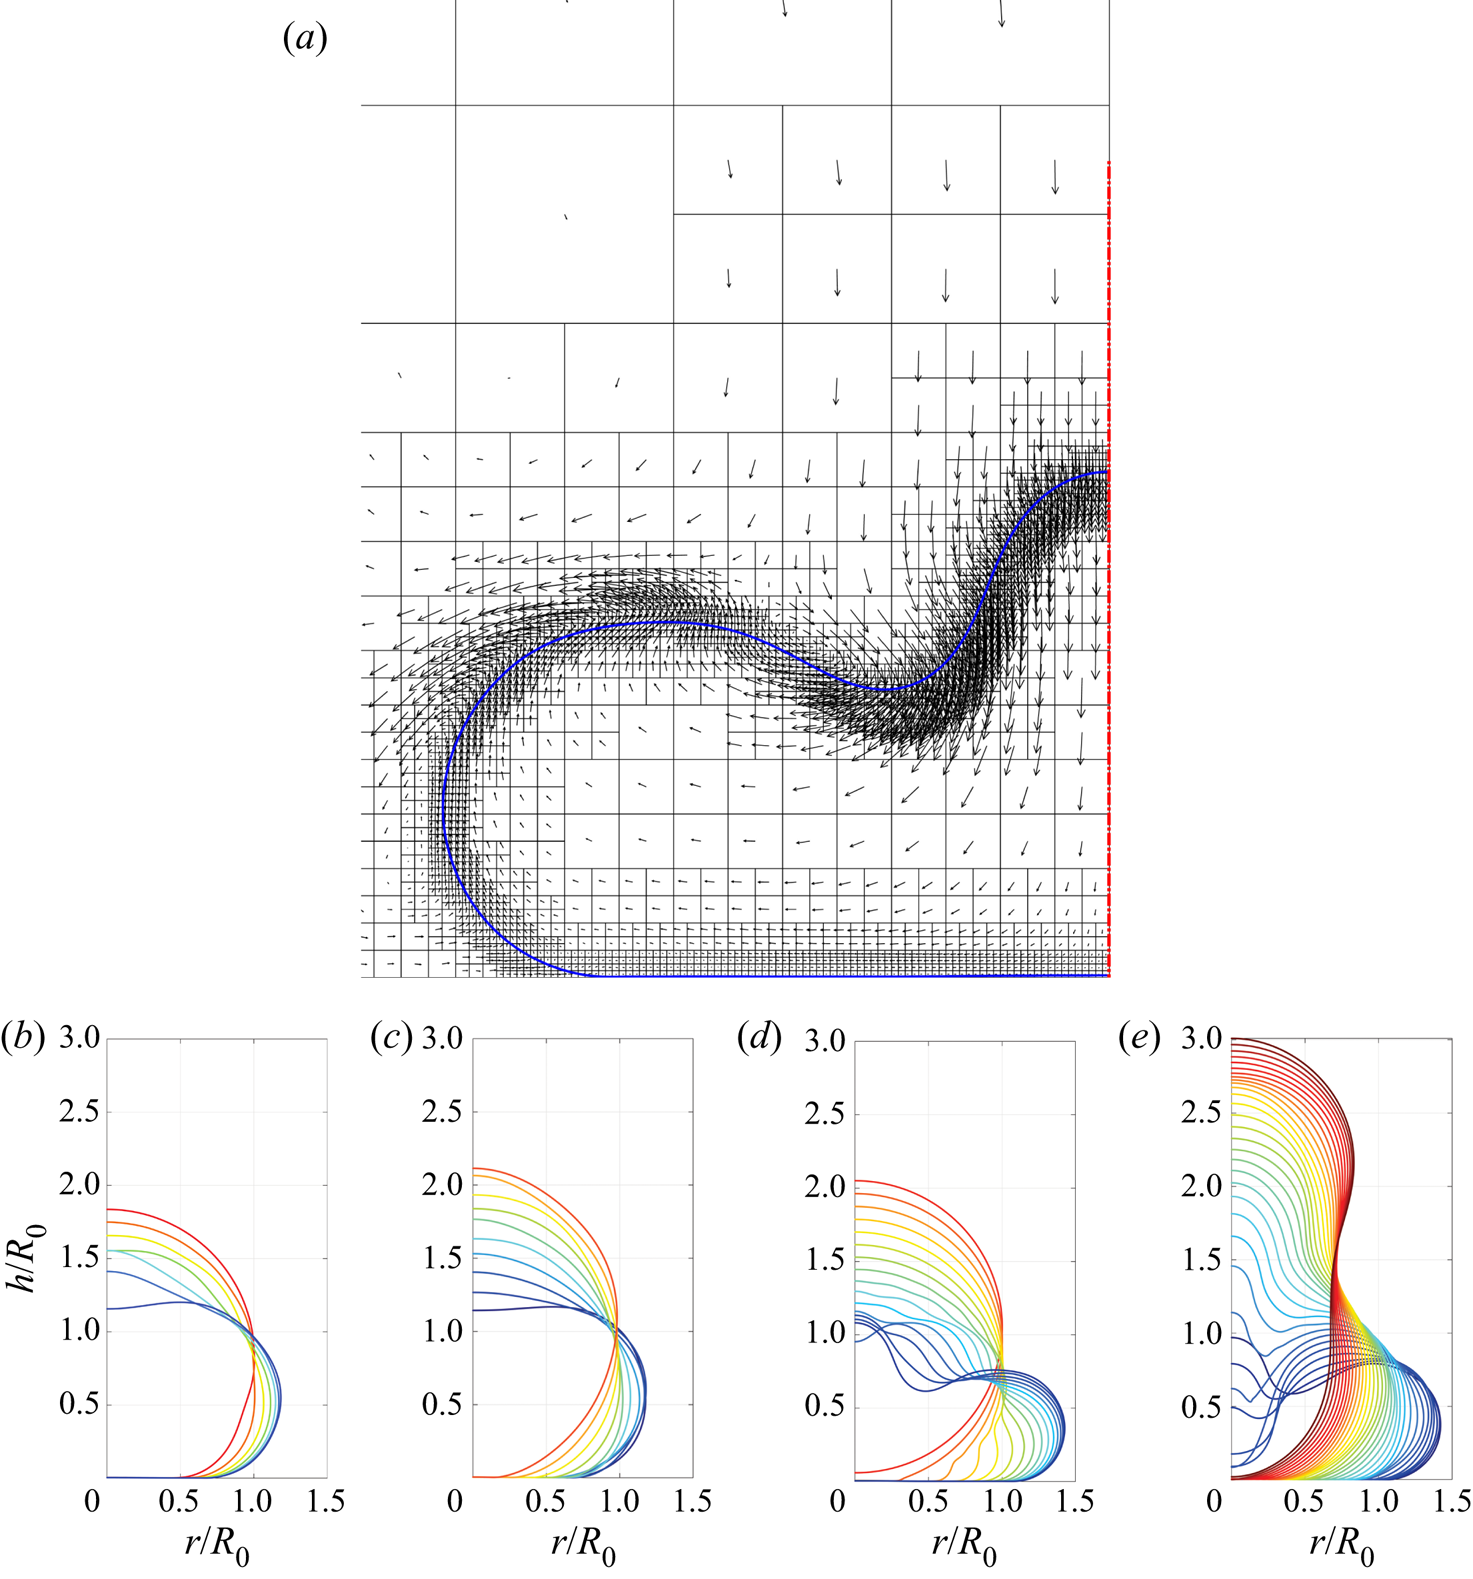
 $h_1$ has not been elucidated in earlier theoretical or experimental papers in detail. Flow fields generated inside the drop are not accessible to experiments which are designed to capture the underlying gas film based on interferometry techniques. Similarly, most of the theoretical papers study a lubrication flow. Thus, the effect of the complex flow field in the drop cannot be captured in such studies. To the best of our knowledge, theoretical studies reported so far do not report a two-minima gas profile as observed in experiments and our simulations. Direct numerical simulations presented here allow us access to the complete interface shape of the drop and the gas profile beneath it as well as velocity fields inside and outside the drop. It is found that a minima at
 $h_1$ is accompanied by a strong downward flow inside the drop near its axis of symmetry, as shown in figure 13(a). The downward flow at the upper interface of the drop leads to large shape changes in the drop. Pack et al. (Reference Pack, Hu, Kim, Zheng, Stone and Sun2017) noted that in their intermediate
 $We$ cases (
 $2 < We < 10$), the air film fails near the central dimple due to impact-induced capillary waves. The above discussion provides evidence for such a failure mechanism.At lower Weber numbers, such as with
 $We=0.53$, surface tension restricts strong distortion to the drop shape as evident in figure 13(b,c), but at higher Weber number, such as with
 $We=3.21$, a large depression is created on the upper surface of the drop as seen in figure 13(d,e). This forms another basis for distinguishing regions 1 and 3. The strong downward flow inside the drop, figure 13(a), subsequently changes to a radial flow close to the solid surface. Such motion causes the upper surface of the drop to approach its lower surface creating a thin film of drop liquid, as shown in figure 14 at
 $We=3.21$ and
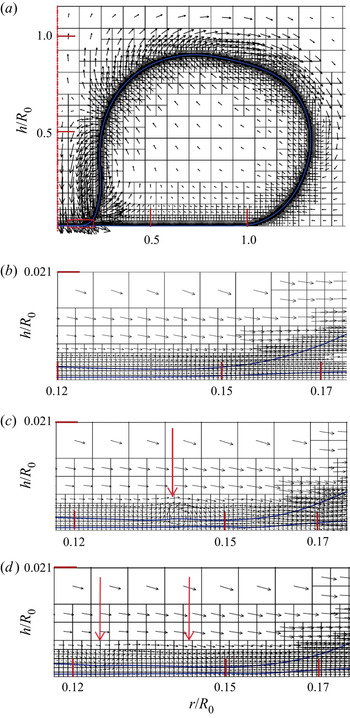
 $Re=724.5$. This case belongs to region 4, where the gas film ruptures near the axis of symmetry. Figure 14(a) shows the overall drop shape before the onset of rupture. The flow in the vicinity of the thin liquid film is radially outwards yet the drop is in its receding stage accompanied by a large-scale inward flow in the rest of the drop. At higher Weber numbers, surface tension fails to regularise the inner kink at
 $h_1$ causing it to rupture. De Ruiter et al. (Reference de Ruiter, van den Ende and Mugele2015a) and Pack et al. (Reference Pack, Hu, Kim, Zheng, Stone and Sun2017) had noted in their experiments that the gas film could indeed rupture at the location of the inner kink. However, a detailed examination of the mechanism for its failure has not been discussed. To illustrate the mechanism, a close-up view of the vector plots in the thin liquid film (shown inside a rectangular region of figure 14a) is shown in figure 14(b–d). Downward motion of the gas causes the thin liquid film to spread radially outwards causing it to thin further and also create strong shear in the gas phase above. This shear often leads to the generation of vortical flows in the gas above the upper surface of the thin film (see location shown with a red arrow in figure 14c) creating undulations on it (see red arrows in figure 14d). In some cases the thin film can reach sub-micron range and the exact rupture time and location may be dictated by disjoining pressure in a real scenario. Since such forces are absent in the current study, we refrain from commenting on the eventual rupture process. In the present study, rupture of the gas film is due to numerical reasons, but needless to say, our simulations will again become valid after the rupture process is completed. Figure 15 shows the drop-gas interface shape for a sample case of
 $We=3.21$ and
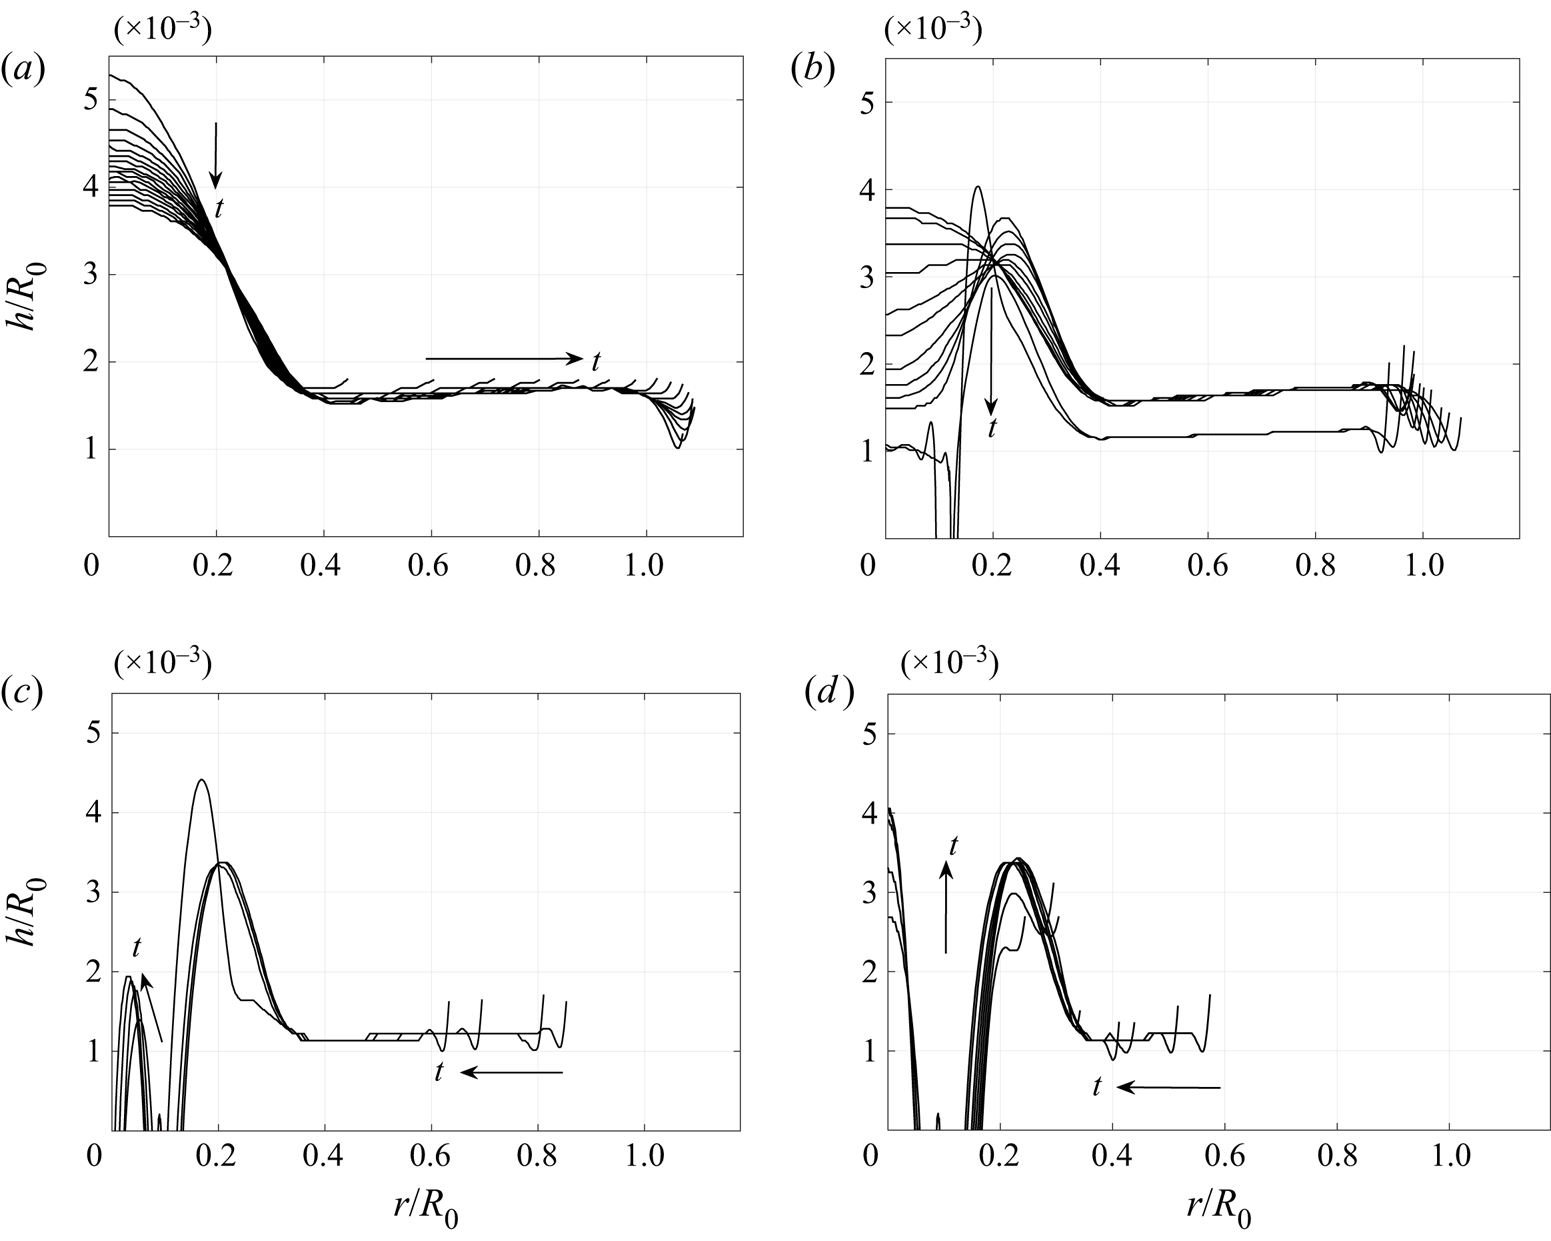
 $Re=517.5$ for rupture in region 4. After an initial spreading phase shown in figure 15(a), two minima at
 $h_1$ and
 $h_2$ are created. The downward flow near the axis of symmetry, similar to the flow field shown in figure 14, causes the interface at the axis to rapidly descend downward. It was found that the outer kink broadly remained stationary. To preserve mass, a bulge in the form of a maxima in the gas film height emerges as shown in figure 15(b) near
 $r/R_0 \approx 0.2$. Rupture eventually occurs at a radial location slightly away from the axis of symmetry at
 $r/R_0 \approx 0.15$ trapping a gas bubble. The drop-gas interface rapidly descends downwards at the axis of symmetry causing the liquid to touchdown at
 $r=0$. This creates a toroidal bubble as shown in figure 15(c). Smaller ruptures are also found but may be due to numerical reasons due to insufficient resolution at the sub-micron scale. The aspect ratio, i.e. vertical to a radial extent, of these trapped bubbles is still quite small, approximately
 $O(0.01)$. The toroidal bubble in figure 15(c) eventually merges creating one single central bubble. Due to large-scale receding motion inside the drop, the outer kink moves inwards with minimal changes to its height. Figure 15(d) shows the late stage of the receding motion where the outer and inner gas bubble interfaces subsequently merge as the drop lifts off from the solid surface. The cascade failure of the gas film at the axis of symmetry has not been reported in the literature to the best of our knowledge. The final rupture in a gas film is seldom axisymmetric (de Ruiter et al. Reference de Ruiter, Oh, van den Ende and Mugele2012) and is a strong function of surface roughness. In light of this, it would be interesting to see if future experiments with ultra-smooth surfaces can capture the toroidal gas bubble reported in this study.
Temporal evolution of the drop–gas interface profile with  $We=3.21$ and
 $Re=207$ contained in region 3 of the phase diagram for
 $(a)$ the spreading stage from
 $(t-t_0)/\tau =0$ to 0.72 and
 $(b)$ the receding stage from
 $(t-t_0)/\tau =0.78$ to 2.34 plotted in equal time intervals of
 $t/\tau =0.05$. The gas film flattens and can even develop a minima at a smaller radius.

 $(a)$ Flow field in the bulk at the onset of the receding motion (
 $t/\tau =0.74$) for
 $We=3.21$ and
 $Re =310.5$. Though the overall drop begins receding after this time, the upper surface of the drop continues to descend indicated by downward velocity vectors near the axis of symmetry. Temporal evolution of drop shapes in advancing and receding stages for (b,c)
 $We=0.53$ and
 $Re =310.5$, and (d,e)
 $We=3.21$ and
 $Re =310.5$. In the advancing stage (b,d), drop shapes are coloured from red to blue and in the receding stage (c,e), drop shapes are coloured from blue to red. Panel (a) corresponds to the last/first curve in panels (d)/(e).

 $(a)$ Vector flow field at the onset of touchdown for
 $We=3.21$ and
 $Re=724.5$ (region 4). The interface near the axis of symmetry descends down rapidly causing the bulk of the drop to spread radially outwards. This causes formation of a thin liquid film supported on a thin gas film. Zoomed view of interfaces and flow fields in a small rectangular region is shown in (b–d) for four different times. Strong shear in the gas film causes undulations at the interface (shown with red arrows) often followed by tiny vortices in the gas above the interface. The extensional flow in the thin liquid film further accentuates the rupture process (not shown here).
 $(a)$
 $t/\tau = 1.05652$.
 $(b)$
 $t/\tau = 1.05652$.
 $(c)$
 $t/\tau = 1.05704$.
 $(d)$
 $t/\tau = 1.05756$.

Temporal evolution of the drop–gas interface profile for  $We=3.21$ and
 $Re=517.5$ in region 4 where touchdown occurs at a much smaller radial location.
 $(a)$ Drop spreads radially and a kink is formed at its outer rim:
 $(t-t_0)/\tau =0$ to 0.78.
 $(b)$ Bulge near the axis of symmetry descends down and makes contact with the solid surface while the outer kink remains nearly stationary:
 $(t-t_0)/\tau =0.78$ to 0.98. This occurs due to a strong downward flow field shown in figure 14.
 $(c)$ Smaller ruptures emerge in the gas film near the axis of symmetry and the outer kink recedes inward:
 $(t-t_0)/\tau =1.09$ to 1.45.
 $(d)$ Coalescence of smaller gas bubbles leads to a larger gas bubble at the axis of symmetry the drop begins complete withdrawal from the surface:
 $(t-t_0)/\tau =1.51$ to 1.92. All the profiles are plotted at equal interface of
 $t/\tau =0.05$.

Rupture in region 5 which occurs at both high  $Re$ and high
 $We$ is found to be a combination of rupture at the outer and inner kinks. This process would be similar to the rupture process in region 2 and region 4, but now occurring simultaneously.
The above discussion in region 4 was primarily restricted to the evolution of the gas film. Large-scale motion in the drop can also trap a large bubble from the upper surface near the axis of symmetry as discussed below.
3.3. Trapping a gas bubble during impact
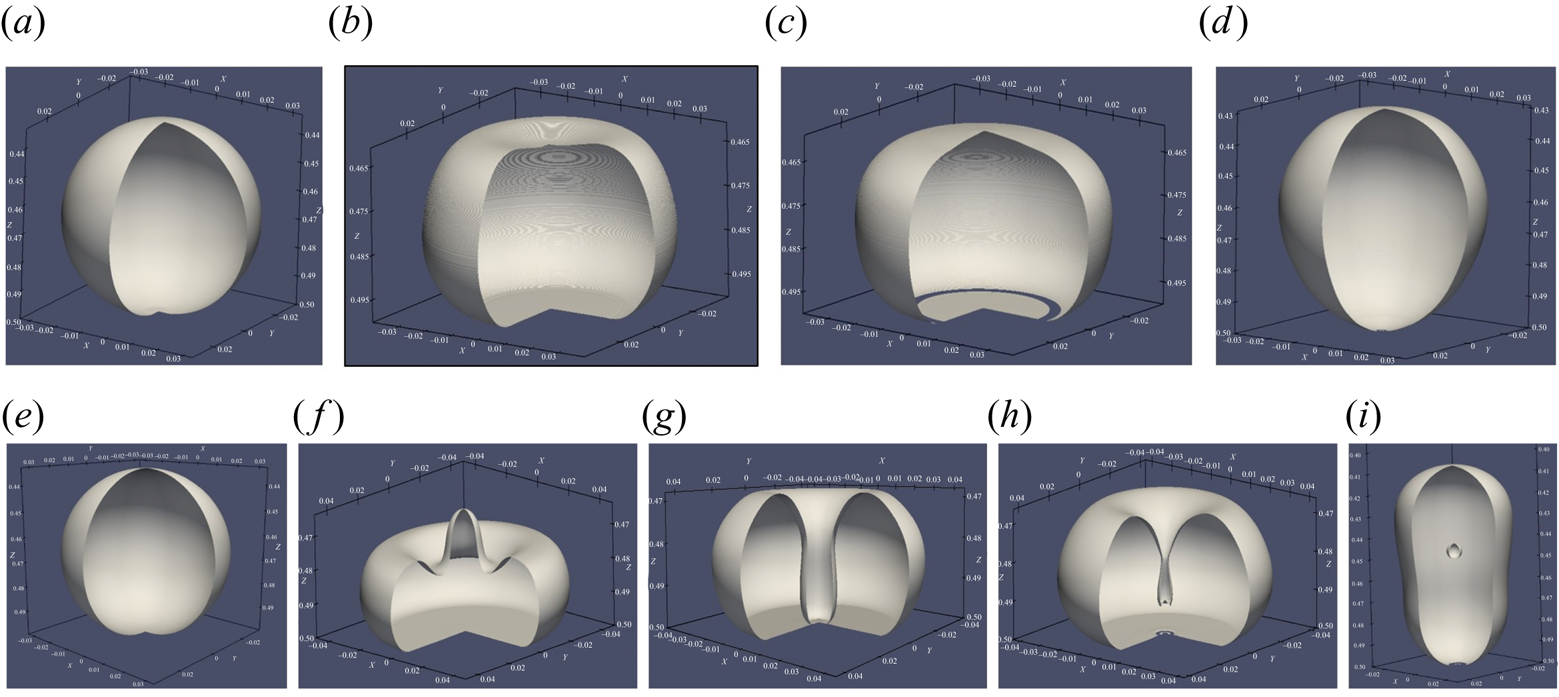
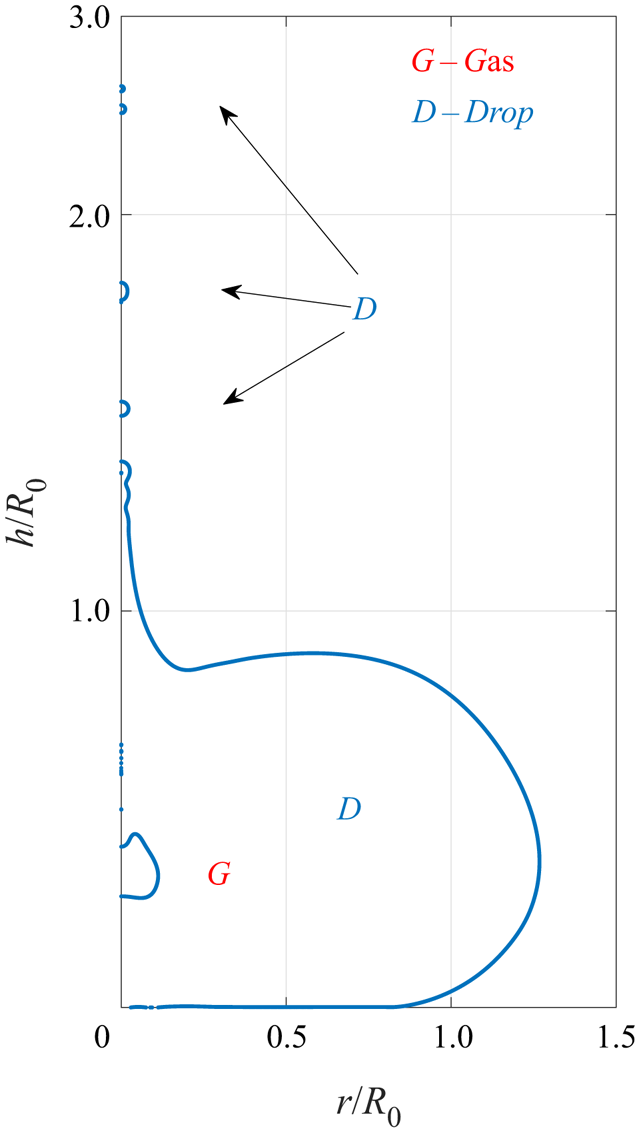
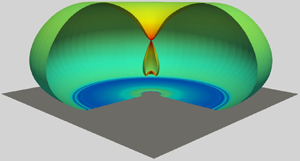
A three-dimensional representation of the axisymmetric simulations is shown in figure 16 for two sample cases from regions 2 and 4. Both these regions belong to the wettability-dependent region where the drop makes contact with the surface. In figure 16(a–d) the upper surface of the drop does not deform significantly, and the drop makes an annular contact with the solid below before eventually retreating from the surface. But in figure 16(e–i) capillary waves focusing at the axis of symmetry causes the upper surface to undergo pronounced downward deformation into the drop. This pushes the thin gas film trapped beneath the lower surface of the drop causing the gas film to rupture near the axis of symmetry. Further, a tiny jet is ejected from the upper surface of the drop, shown in figure 17, and experimentally studied by Bartolo, Josserand & Bonn (Reference Bartolo, Josserand and Bonn2006). The downward descending interface closes upon itself, trapping a large bubble inside the drop as shown in figure 16(i). Similar phenomenon was reported by Renardy et al. (Reference Renardy, Popinet, Duchemin, Renardy, Zaleski, Josserand, Drumright-Clarke, Richard, Clanet and Quéré2003) where a central dry spot was found when the drop spreads outwards. This was referred to as dry out. But no bubble entrapment was reported in their work. In the present case shown in figure 16(e–i), the vertical cylindrical cavity formed at the centre of the drop undergoes necking (figure 16h) trapping a bubble as clearly evident in figure 16(i). See supplementary movie 3 showing the bubble trapping process.
Three-dimensional representation of drop shapes obtained by revolving the axisymmetric interface profiles. (a–d) Sample case from region 2 with  $We=0.53$ and
 $Re=2070$ for
 $(t-t_0)/\tau = 0, 1.08, 1.212, 2.361$ for one complete bouncing event. Rupture of the gas film causes the formation of two axisymmetric contact lines. (e–h) Sample case from region 4 with
 $We=3.21$ and
 $Re=517.5$ for
 $(t-t_0)/\tau =0, 0.7817, 1.07, 1.14, 2.24$ for one complete bouncing event. Strong oscillations on the upper regions of the drop clearly causes entrainment of gas from above. This causes rupture of the drop–gas interface profile near the axis of symmetry (see figure 14 for vector field) and also traps a large bubble inside the drop consistent with experiments (see figure 18). Aesthetics guided the choice of orientation and scale for each panel. No effort was made to retain the same scale in the above images.

Interface shape for  $We=3.21$ and
 $Re=517.5$ showing simultaneous ejection of a jet and bubble entrapment. As the jet is ejected at a very high speed, it break up into tiny droplets. Simultaneously a gas bubble is trapped inside the drop when the capillary waves collapse on the upper surface of the drop.

It has to be noted that not all cases of jetting result in bubble entrapment. Whether a bubble is trapped inside the drop depends on the extent of drop deformation at its upper surface. Jetting is more ubiquitous and does not necessarily require very large-amplitude deformations (Farsoiya, Mayya & Dasgupta Reference Farsoiya, Mayya and Dasgupta2017). Experiments have also been carried out with water drops impacting a superhydrophobic surface with a static contact angle  $\theta _s \approx 160.4^{\circ }$. Drops of approximately
 $1.3\ \textrm {mm}$ are released from various heights to vary both
 $Re$ and
 $We$. A sample experiment showing a water drop impacting with a speed of
 $V = 0.55\ \textrm {m}\,\textrm {s}^{-1}$ is shown in figure 18 which corresponds to
 $Re=716$ and
 $We=6.1$. Figure 18(b) clearly shows the upper interface diving downward entrapping a bubble. In many cases, the captured bubbles stay embedded inside the drop even when the drop undergoes multiple bounces on the surface. It is very difficult to realise the axisymmetric evolution of the drop in the experiments. Nevertheless, bubble entrapment of the drop has strong similarities with simulations reported in figure 16(e–i).
Bubble entrapment in a water drop surrounded by air impacting on a chemically treated superhydrophobic glass with  $\theta =160.4^{\circ }$ for
 $Re=716$ and
 $We=6.1$. (a–d) Approximately correspond to various stages of a bouncing cycle (from left to right):
 $t=0.33\ \textrm {ms}$ after contact,
 $t=5.8\ \textrm {ms}$ at maximum spreading,
 $t=8.66\ \textrm {ms}$ showing bubble entrapment and
 $t=20.3\ \textrm {ms}$ showing drop in flight with the entrapped bubble. See supplementary movie 4.

3.4. First deformation of the ‘spherical’ drop
In all the above sections the description of drop dynamics has largely been qualitative in nature. We now make quantitative comparisons with scaling theories and experiments. The first among the quantities to consider is the height above the solid surface,  $H_d$, at which the drop first deforms from its far-field shape. When the liquid drop approaches the solid surface, the gas film beneath it is squeezed out causing a build-up of lubrication pressure in the gas film. This pressure not only causes the drop to decelerate but also deforms the lower surface of the drop. In this section we are interested in determining the height,
 $H_d$, at which this deformation begins. The deceleration of the drop can be written as
 $\rho _l h_{tt} \sim \rho _l V_0/T$, where
 $V_0$ is the impact speed and
 $T$ is the time over which the vertical motion of the drop ceases (Mandre et al. Reference Mandre, Mani and Brenner2009). Pressure in the gas is given by
 $p_g \sim \mu _g V_0 R_0/H_d^2$ at a drop height of
 $H_d$ from the bottom. The first deformation begins when the pressure gradient in the gas overcomes inertia and surface tension, i.e.
 $p_g/L \sim \rho _l V_0/T + \sigma /(R_0 L)$, where
 $T=H_d/V_0$ and
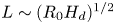 $L\sim (R_0 H_d)^{1/2}$. For high impact velocities, inertia dominates surface tension such as in the experiments of Li & Thoroddsen (Reference Li and Thoroddsen2015) and Langley et al. (Reference Langley, Li, Vakarelski and Thoroddsen2018). In this limit, balancing inertia with gas pressure leads to the scaling
 $H_d \sim R_0 St^{-2/3}$. However, at low impact velocities, surface tension dominates inertia such as in the experiments of Pack et al. (Reference Pack, Hu, Kim, Zheng, Stone and Sun2017). Balancing surface tension with gas pressure leads to another scaling for
 $H_d$ given by
 $H_d \sim R_0 Ca_g^{1/2} \equiv R_0 Oh St^{1/2}$, where
 $Oh$ is the Ohnesorge number. Written in terms of velocities, the two scaling relationships assume the simple forms:
 $H_d \sim U^{-2/3}$ in the high inertia limit,
 $H_d \sim U^{1/2}$ in the low inertia limit. The two limits clearly suggest that
 $H_d$ attains a maximum at a certain value of impact velocity,
 $U$. Bouwhuis et al. (Reference Bouwhuis, van der Veen, Tran, Keij, Winkels, Peters, van der Meer, Sun, Snoeijer and Lohse2012) performed experiments covering both these limits and have indeed shown that the gas film attains a maximum thickness for a specific value of the Stokes number. Klaseboer, Manica & Chan (Reference Klaseboer, Manica and Chan2014) derived a universal scaling expression for
 $H_d$ covering both these limits. Similar deformation also occurs when a drop is squeezed by a plate from above (Connor & Horn Reference Connor and Horn2003) or when a bubble rises against a horizontal plate (Hendrix et al. Reference Hendrix, Manica, Klaseboer, Chan and Ohl2012; Manica et al. Reference Manica, Hendrix, Gupta, Klaseboer, Ohl and Chan2013).
The simulations presented here are in the incompressible regime at  $O(1)$ Weber numbers and moderate values of Stokes number such that
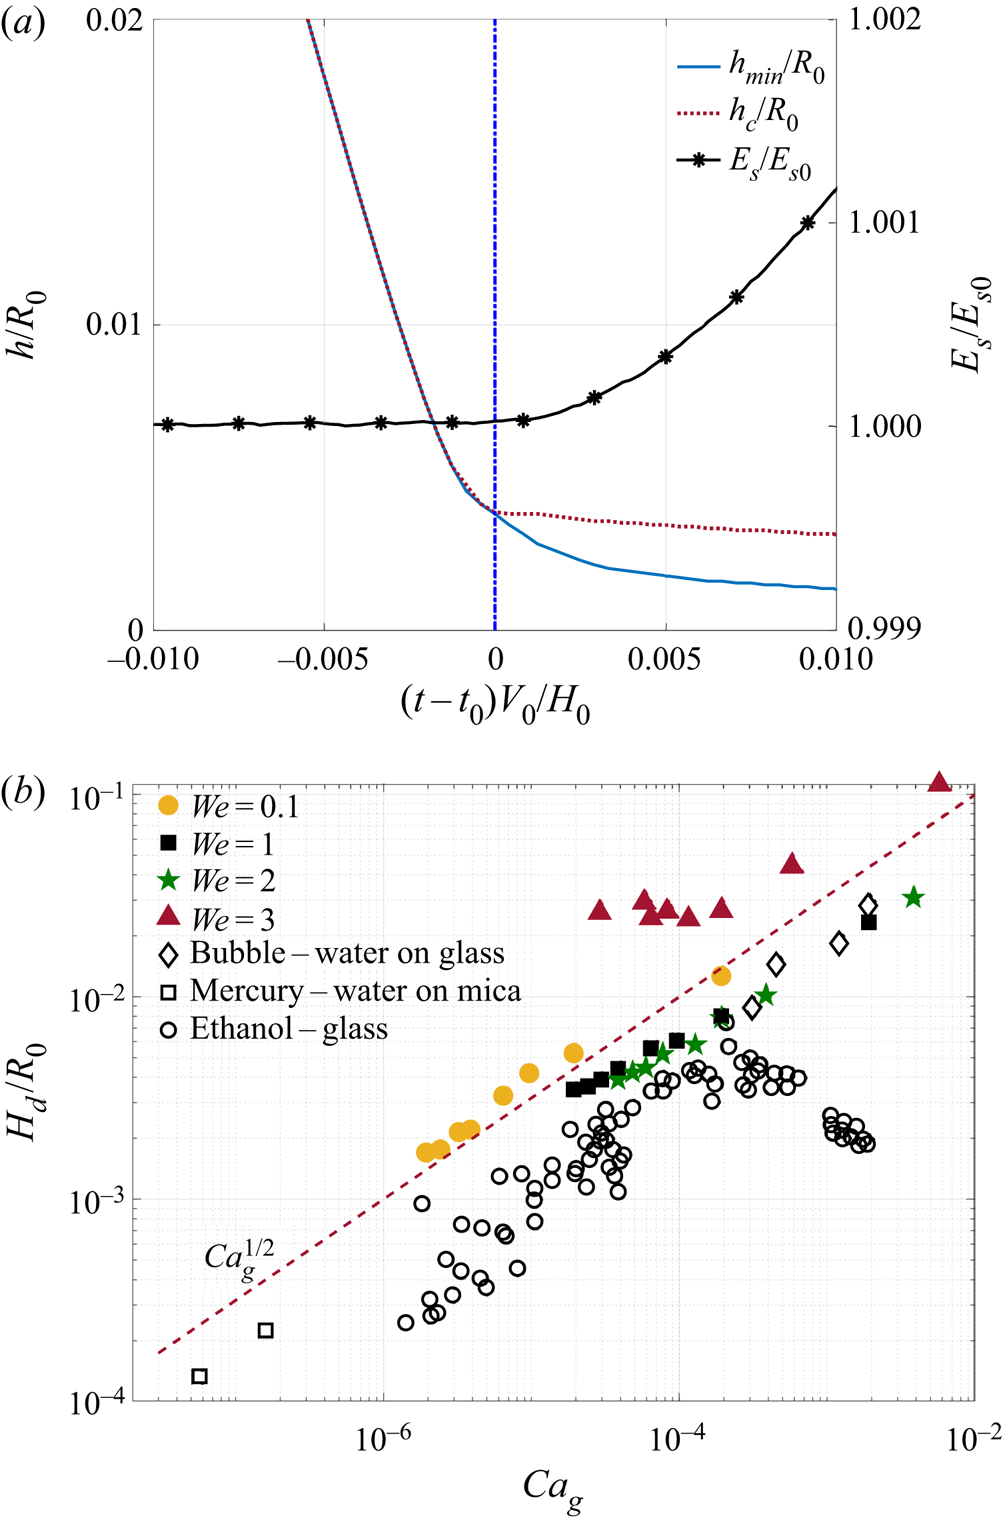
 $Ca_g \equiv We/St \ll 1$. A dimple forms right above the stagnation point in the surface, causing the local curvature to change sign. The time at which the first deformation occurs corresponds to the deviation of the dimple height from the minimum height of the interface. While this occurs, the surface energy of the drop increases from its value corresponding to a spherical drop. This is shown in figure 19(a). Variation of initial deformation with capillary number is shown in figure 19(b) and is found to be in excellent agreement with the experiments of Bouwhuis et al. (Reference Bouwhuis, van der Veen, Tran, Keij, Winkels, Peters, van der Meer, Sun, Snoeijer and Lohse2012) and Klaseboer et al. (Reference Klaseboer, Manica and Chan2014) for a lower value of
 $Ca_g$ and smaller Weber numbers. Our simulations suggest that
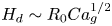 $H_d \sim R_0 Ca_g^{1/2}$ over the entire range of Weber numbers simulated. Bouwhuis et al. (Reference Bouwhuis, van der Veen, Tran, Keij, Winkels, Peters, van der Meer, Sun, Snoeijer and Lohse2012) find that ethanol drops follow a different scaling beyond a critical Stokes number corresponding to the dominance of inertia over surface tension. No such scaling was found in our simulations within the range of Weber numbers simulated. And for higher
 $Ca_g$, agreement is found with bubble rise experiments of Klaseboer et al. (Reference Klaseboer, Manica and Chan2014).
 $(a)$ Time evolution of the centreline height (
 $h_c$) and minimum height (
 $h_{min}$) of the drop-gas interface profile as the drop descends towards the surface. For
 $t \le t_0$, the drop remains spherical, hence,
 $h_c = h_{min}$ and non-dimensional surface energy,
 $E_S/E_{S0}$ (shown on right axis) is at its minimum. The drop begins its first deformation at time
 $t=t_0$ after its release from a height
 $H=H_0$ resulting in deviation between
 $h_c$ and
 $h_{min}$. Surface energy of the drop begins to increase at the same instant and is a useful measure for determining the time at which first deformation occurs. The blue vertical line shows the time,
 $t=t_0$, at which the first drop deformation occurs at height
 $H_d$ as measured from the bottom surface.
 $(b)$ Scaling of
 $H_d$ for various Weber numbers shows that
 $H_d \sim Ca_g^{1/2}$, a scaling obtained by balance of capillary pressure in the drop and lubrication pressure in gas film. Solid symbols are from the current study and open symbols are taken from the following experiments: (
 $\lozenge$) are bubble impact experiments of Hendrix et al. (Reference Hendrix, Manica, Klaseboer, Chan and Ohl2012) and Manica et al. (Reference Manica, Hendrix, Gupta, Klaseboer, Ohl and Chan2013, Reference Manica, Hendrix, Gupta, Klaseboer, Ohl and Chan2014), (
 $\Box$) are mercury drops in water impacting a mica surface by Connor & Horn (Reference Connor and Horn2003) and (
 $\bigcirc$) are ethanol drops impacting on glass by Bouwhuis et al. (Reference Bouwhuis, van der Veen, Tran, Keij, Winkels, Peters, van der Meer, Sun, Snoeijer and Lohse2012).

To better understand the deviation from the experiments of Bouwhuis et al. (Reference Bouwhuis, van der Veen, Tran, Keij, Winkels, Peters, van der Meer, Sun, Snoeijer and Lohse2012), we need to take a closer look at how parameters are varied in experiments and simulations. In most experimental studies, the fluids (liquid and gas combination) are chosen, and the velocity of the drop is varied by adjusting the release height. However, in simulations this is often impractical due to the prohibitively large computational cost involved. In the current study simulations are performed keeping the viscosity ratio,  $\lambda = \mu _g/\mu _l = 0.018$ fixed. This value corresponds to that of an air–water system like in the experiments of de Ruiter et al. (Reference de Ruiter, Lagraauw, van den Ende and Mugele2015c, Reference de Ruiter, Lagraauw, Mugele and van den Endeb). For a fixed
 $We$, a change in
 $Re$ or
 $St$ is achieved by changing the liquid and gas viscosity simultaneously such that their ratio,
 $\lambda$, is held constant. Therefore, for large
 $Ca_g$, at which deviation with Bouwhuis et al. (Reference Bouwhuis, van der Veen, Tran, Keij, Winkels, Peters, van der Meer, Sun, Snoeijer and Lohse2012) occurs, gas viscosity is quite large. However, in the experiments
 $Oh$ is always constant for a given set of fluids. For example, at the highest
 $Ca_g$ used in Bouwhuis et al. (Reference Bouwhuis, van der Veen, Tran, Keij, Winkels, Peters, van der Meer, Sun, Snoeijer and Lohse2012), the Ohnesorge number is approximately 10 times lower than the value obtained in the current simulations. Using the relation
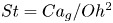 $St = Ca_g/Oh^2$, perhaps the simulations and experiments differ when plotted only against
 $St$ as was done in Bouwhuis et al. (Reference Bouwhuis, van der Veen, Tran, Keij, Winkels, Peters, van der Meer, Sun, Snoeijer and Lohse2012).
3.5. Scaling for minimum gas thickness in region 1
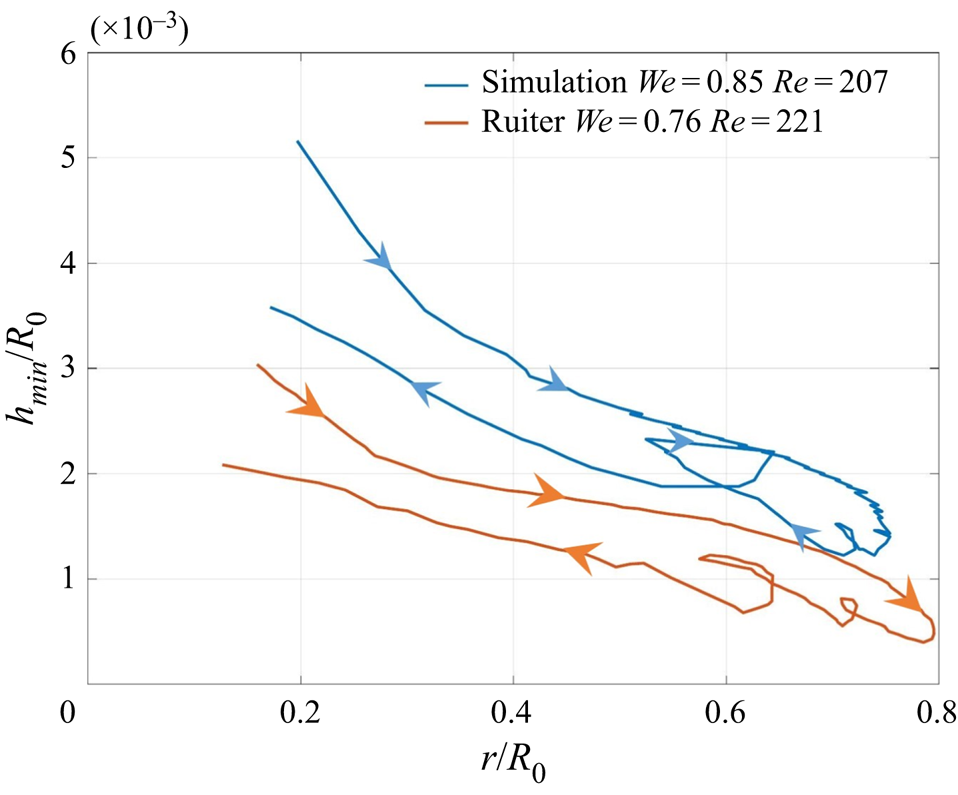
In region 1 shown in figure 7 the drop is supported on a thin cushion of gas beneath it. As the drop spreads on the solid surface, the radial location of the minima varies with time, first advancing radially outwards and then receding as the drop bounces from the surface. Figure 20 shows a comparison of the outer kink motion,  $h_2$, with the experimental results reported by de Ruiter et al. (Reference de Ruiter, van den Ende and Mugele2015a) for very similar parameters. The simulation results for height are approximately double those reported in experiments consistent with interface shape profiles shown in figure 5. In spite of this difference, our simulations are fairly consistent with experiments, including the non-monotonic motion of the kink during its receding motion. De Ruiter et al. (Reference de Ruiter, Oh, van den Ende and Mugele2012) reported that as the drop descends towards the surface, an inner ‘kink’ at
 $h=h_1$ first forms. This kink is more akin to flattening of the interface rather than a local minima in the film thickness. As the drop continues to spread, a second and sharper ‘kink’ with a gas film thickness
 $h=h_2$ emerges. To the best of our knowledge, there is no analytical or numerical study, even based on lubrication theory, which has reported a two-kink interface shape. Nevertheless, the interface shapes reported by several theoretical and numerical (lubrication-based) studies are consistent with the second kink at
 $h=h_2$ reported by de Ruiter et al. (Reference de Ruiter, Oh, van den Ende and Mugele2012). Mandre et al. (Reference Mandre, Mani and Brenner2009) argue that a sharp increase in curvature at
 $h=h_2$ causes the capillary forces to rapidly increase and dominate over inertia during the final stages of drop spreading. Balancing capillary and lubrication forces, Mandre et al. (Reference Mandre, Mani and Brenner2009) and Mani et al. (Reference Mani, Mandre and Brenner2010) show that downward motion of the droplet is completely arrested as surface tension regularises the curvature singularity. This allows the drop to be supported on a thin gas cushion beneath it. Duchemin & Josserand (Reference Duchemin and Josserand2011), using lubrication theory, show that a curvature singularity indeed forms in a finite time when surface tension is absent. The observation of a gas film during the spreading phase of the drop were soon realised in an experiment using total internal reflection microscopy by Kolinski et al. (Reference Kolinski, Rubinstein, Mandre, Brenner, Weitz and Mahadevan2012). These experiments showed that drops could skate on a thin cushion of gas, as low as 10 nm, eventually making contact with the surface. The wettability-dependent region of the phase diagram in figure 7 is consistent with the experimental results of Kolinski et al. (Reference Kolinski, Rubinstein, Mandre, Brenner, Weitz and Mahadevan2012). Further, the height of release of the drop was found to affect the thickness of these gas films. The very low values found in experiments of Kolinski et al. (Reference Kolinski, Rubinstein, Mandre, Brenner, Weitz and Mahadevan2012) are well beyond the scope of any computational method even if challenges with incorporating appropriate non-continuum physics is addressed.
Comparison of the motion of the outer kink ( $h=h_2 = h_{min}$) with experiments reported in figure 11(c) of de Ruiter et al. (Reference de Ruiter, Lagraauw, Mugele and van den Ende2015b). Looping indicates that receding motion is non-monotonic and is seen both in experiments and simulations.

Returning to the structure of the gas film in region 1 of figure 7, its thickness varies radially and has a minima at the radial location,  $r=r_k$. Value of the gas film thickness between the drop and solid surface is obtained by balancing the capillary pressure gradient in the drop and the lubrication pressure gradient in the gas. The scaling for
 $h_{min}$, derived by Mandre et al. (Reference Mandre, Mani and Brenner2009) and Mani et al. (Reference Mani, Mandre and Brenner2010), can be written as
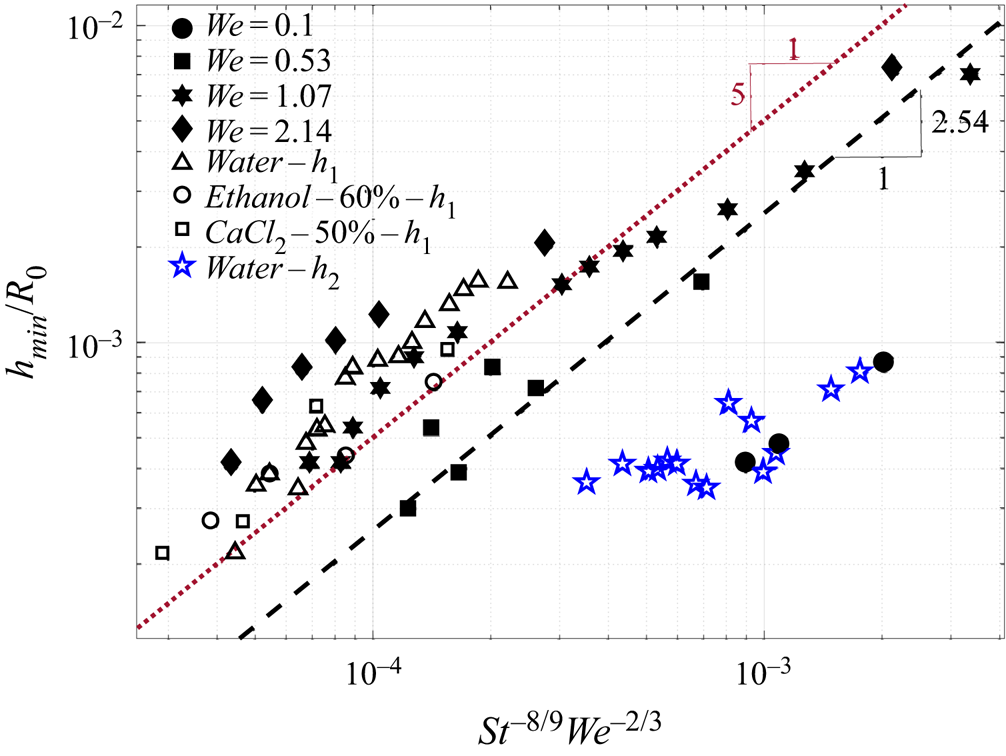
 \begin{equation} h_{min} = 2.54 R_0 St^{-8/9} We^{-2/3}, \end{equation}
where  $St=\rho _l V_0 R_0/\mu _g$ used here is inverse to that defined in their work. Mandre et al. (Reference Mandre, Mani and Brenner2009) obtained a pre-factor 2.54 by using the numerical solution of the lubrication equations whereas experiments of de Ruiter et al. (Reference de Ruiter, van den Ende and Mugele2015a) obtain a numerical factor of 5.0. Comparison of
 $h_{min}$ obtained in our simulations are in excellent agreement with both theory and experiments, as shown in figure 21.
Scaling for minimum height in the drop-gas interface profile for cases in region 1 of the phase diagram. Solid symbols correspond to the current study whereas open symbols correspond to experiments reported by de Ruiter et al. (Reference de Ruiter, van den Ende and Mugele2015a). Theoretical scaling by Mandre et al. (Reference Mandre, Mani and Brenner2009) ( ) and experimental fit of de Ruiter et al. (Reference de Ruiter, van den Ende and Mugele2015a) (
 $- - -$) is also shown. Thickness values shown in figure 8 of de Ruiter et al. (Reference de Ruiter, van den Ende and Mugele2015a) (
 $\triangle ,\bigcirc ,\Box$) correspond to the inner kink whereas outer kink values (
 $h_2$) are extracted from their figure 6 shown with (
 , blue) symbol.

Discussion of a few nuances in this scaling comparison is in order. Mani et al. (Reference Mani, Mandre and Brenner2010) report a single minima in film thickness with a sharp curvature at this location. But experiments of de Ruiter et al. (Reference de Ruiter, Lagraauw, van den Ende and Mugele2015c) and de Ruiter et al. (Reference de Ruiter, van den Ende and Mugele2015a) reported formation of two minima at higher Weber numbers. The inner minima, not found in the theory of Mani et al. (Reference Mani, Mandre and Brenner2010), does not possess a steep curvature. De Ruiter et al. (Reference de Ruiter, van den Ende and Mugele2015a) compare their  $h_{min}$ scaling based on the values obtained at the inner minima, but it is our view that the scaling found by Mandre et al. (Reference Mandre, Mani and Brenner2009) is best suited for the outer minima where the curvature of the interface is very large. The
 $h_{min}$ value at the outer minima is extracted from figure 8 of de Ruiter et al. (Reference de Ruiter, van den Ende and Mugele2015a), shown with a blue (
 , blue) symbol, would be consistent with a much lower value for the numerical factor than what was reported in Mandre et al. (Reference Mandre, Mani and Brenner2009). Perhaps compressibility, which is ignored in the above scaling, maybe playing a small role in the experiments. In making figure 21 only the outer minima thickness value was used from the simulations. With better resolution, our simulation results are likely to better agree with the values reported by Mandre et al. (Reference Mandre, Mani and Brenner2009) without the need to adjust the numerical factor.
We now shed light on the evolution of the radial location of the gas film minima or kink denoted by  $r=r_k$. Figures 8–10, 12 and 15 show that a minima in the gas film thickness travels radially outward like a wave as the drop spreads on the surface. At higher
 $Re$,
 $h_{min} \rightarrow 0$ at the kink location indicating contact with the surface. To derive a scaling for
 $r_k$, we draw an analogy between a drop impacting a surface with a bubble rising against an interface. In the latter case, the free surface deforms as the bubble approaches it and eventually ruptures concentrically at a certain radial location. Manica, Klaseboer & Chan (Reference Manica, Klaseboer and Chan2016) show that the shape of the free surface can be described in the outer, i.e.
 $r > r_k$, and inner,
 $r < r_k$, regions separately. By matching the two regions, Manica et al. (Reference Manica, Klaseboer and Chan2016) obtain a simple expression for the radius of rupture of the bubble impacting a free surface, given by
 \begin{equation} r_k=\sqrt{\frac{R_0 F}{{\rm \pi} \sigma}}, \end{equation}
where  $R_0$ is the radius of the bubble and
 $F$ is the force of impact.
In Manica et al. (Reference Manica, Klaseboer and Chan2016),  $F$ is the buoyancy force of the rising bubble. But in the current study
 $F$ can be taken to be the impact force of a freely falling drop given by
 \begin{equation} F= \rho_l \frac{4}{3} R_0^3 \frac{\partial v}{\partial t} \sim \rho_l \frac{4}{3} R_0^3 \frac{V_0}{\tau}, \end{equation}
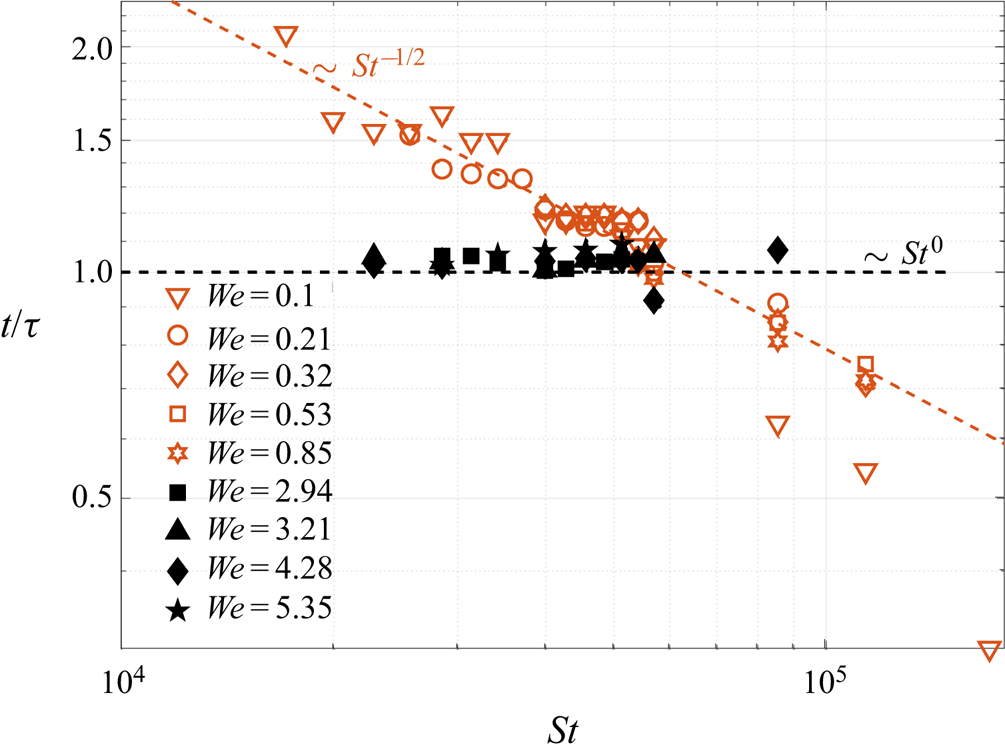
where  $\tau$ is the time scale obtained by balancing inertia and surface tension forces,
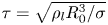 $\tau =\sqrt {\rho _l R_0^3 / \sigma }$, and is the time taken by the drop to spread on the surface. Note that in the above expression, gravity is absent for acceleration. Instead, we use the deceleration of the drop given by
 $\partial v/\partial t$ since in the presence of gas cushion, the impact force is significantly reduced. Simplifying the above expression leads to a simple scaling law for the radius of the minima given by
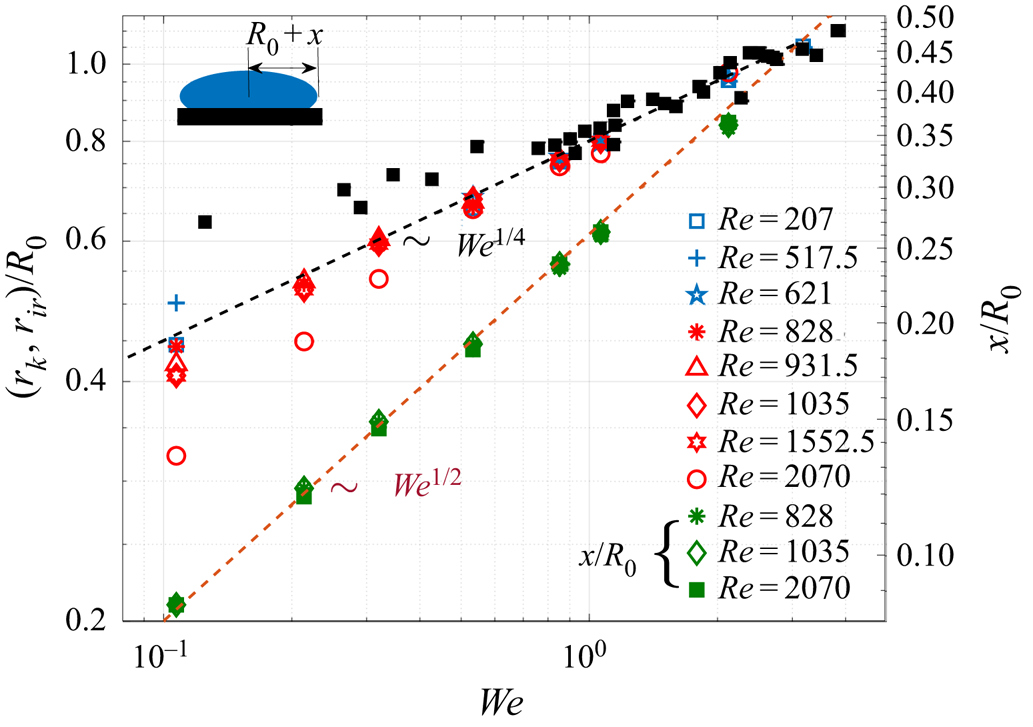
 \begin{equation} r_{k} = \frac{2}{\sqrt{3}} R_0 We^{1/4}. \end{equation}
This scaling is obeyed by the outer kink in regions 1 and 3 and is also the location where the gas film first ruptures in region 2. This should not be confused with the maximum radial spread of the drop, which is known as the ‘spreading factor’. Approximating the drop like an oblate spheroid with radial deformation written as  $R_{{max}} = (R_0 + x)$, Richard & Quéré (Reference Richard and Quéré2000) derived a simple scaling for
 $x$ by balancing the kinetic energy of the impacting drop to the excess surface energy generated as the drop deforms. This balance can thus be written in the form
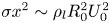 $\sigma x^2 \sim \rho _l R_0^2 U_0^2$, yielding a simple scaling law for the maximum deformation,
 $x \sim R_0 We^{1/2}$. According to this scaling, the spreading factor scales linearly with impact velocity
 $U_0$ and is expected to hold when surface tension is the dominant mechanism to arrest the spreading of the drop. A composite plot with scaling for the radial location of the outer kink,
 $r_k$, rupture location of the gas film,
 $r_{ir}$, (for cases in region 2) and the maximum deformation,
 $x$, is shown in figure 22. The simulation data agrees well with scaling (3.4) and with the scaling derived in Richard & Quéré (Reference Richard and Quéré2000). It is expected since the current study involves drops impacting on superhydrophobic surfaces. Other scaling relationships are also possible, as discussed in § 4 depending on the nature of the force balance during impact.
Scaling relationships with varying Weber number for radial location of the outer kink,  $r_k:(\nabla , \text {blue}; \lhd , \text {blue};$
 , blue), radial location of the first rupture for parameters in region 2,
 $r_{ir}:(\Box , \text {red}; \triangle , \text {red};$
 , red;
 $\lozenge , \text {red}; \bigcirc , \text {red})$ and radial extent of drop deformation,
 $x = (R_{max}-R_0):({\ast , \text {pinegreen}; \lozenge , \text {pinegreen}; \blacksquare, \text {pinegreen}})$. Experimental data for radial position of outer kink,
 $h=h_2$, extracted from figure 4(c) of de Ruiter et al. (Reference de Ruiter, van den Ende and Mugele2015a) is also shown (
 $\blacksquare$) and found to be in excellent agreement with the
 $We^{1/4}$ scaling. Maximum deformation of the drop (see inset schematic) follows the scaling derived by Richard & Quéré (Reference Richard and Quéré2000) valid for bouncing on superhydrophobic surfaces,
 $x \sim We^{1/2}$.

For high impact velocities, the gas film disk follows another scaling given by  $L_0=3.8(4\mu _g/\rho _l V_0)^{1/3}R_0^{2/3}$. This was shown theoretically by Hicks & Purvis (Reference Hicks and Purvis2010) and confirmed experimentally by Li & Thoroddsen (Reference Li and Thoroddsen2015). Note that we have used the original radius of the drop rather than the curvature at the bottom of the drop,
 $R_b$. In terms of our non-dimensional parameters this can be written as
 $L_0/R_0 \sim St^{-1/3}$, suggesting that the gas disk radius becomes very small at high values of
 $St$. Our simulations never reach the high values of
 $St$ or
 $We$ to verify this scaling, but we do see that the drop makes contact at very small radial locations in region 4 and region 5.
3.6. Time of rupture of the gas layer
The discussion in the previous sections has shed light on scaling laws obeyed by thickness of the gas film,  $H_d$ and
 $h_{min}$, and the radial location of the kink/rupture point,
 $r_k, r_{ir}$. Further, we showed that the nature of the gas film rupture in region 2 is fundamentally different from that found in region 4. In region 2 the drop makes contact near the outer kink at
 $r \sim r_k$, whereas in region 4 contact occurs for
 $r \ll r_k$ primarily forced by a strong downward flow near the axis of symmetry (see figure 14). Pack et al. (Reference Pack, Hu, Kim, Zheng, Stone and Sun2017) refer to this as dimple rupture and kink rupture respectively. The difference in the nature of rupture in region-2 and region-4 is also evident from the dependence of rupture time on gas viscosity. Figure 23 shows the time taken for the gas film to rupture,
 $t_r$, after the drop undergoes its first deformation. This is the time taken for the drop to make contact with the solid surface by draining the gas layer beneath it. Rupture time is non-dimensionalised by time
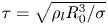 $\tau =\sqrt {\rho _l R_0^3/\sigma }$ which is obtained by balancing kinetic energy and surface energy.
Scaled rupture time of the gas film (or contact time),  $t_r/\tau$. Simulation data shows distinct scaling behaviour for cases belonging to region 2 and region 4 of the parameter space. In region 2 (orange open symbol) we have
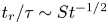 $t_r/\tau \sim St^{-1/2}$ whereas in region 4 (solid black symbols),
 $t_r \approx \tau$.

In region 2 the gas film ruptures when the outer kink height goes to zero, i.e  $h_2\rightarrow 0$ at radial location
 $r_{ir}$. Contact occurs as a result of failure of lubrication pressure spread over a gas disk of radius
 $r_k$. The rupture time can be obtained by determining the time taken for a gas disk of initial thickness
 $H_d$ to reduce to zero thickness. Using the impact velocity,
 $V_0$, as the characteristic vertical velocity scale, the time of rupture can be obtained by the following estimate:
 \begin{equation} t_r \sim \frac{H_d}{V_0} \sim \frac{R_0 Ca_g^{1/2}}{V_0}. \end{equation}
In the above expression we have used the scaling obtained for  $H_d$ from § 3.4. Rewriting the above scaling in non-dimensional terms, we get
 \begin{equation} \frac{t_r}{\tau} \sim St^{-1/2}. \end{equation}
This simple scaling law is found to be valid for all contact cases in region 2 when  $We \leq 2$ (open orange symbols). Written in terms of gas viscosity, we have
 $t_r \sim \mu _g^{1/2}$, i.e. the higher the viscosity of the gas layer, the longer the time taken for the drop to make contact with the solid surface. The above scaling law is physically insightful in explaining the role of lubrication pressure prior to rupture. Lubrication pressure in a gas layer of radius
 $r_k$ is given by
 $p \sim \mu _g V_0 r_k/H_d^2$. For high gas viscosity (or low
 $St$), lubrication pressure is effective in decelerating the drop motion delaying rupture of the gas film. For drop impact at high Weber number, contact occurs at a much smaller radius such as in region 4. In these cases, the above scaling law is not expected to be valid since the fundamental mechanism causing contact is not of lubrication type, but strongly dependent on large-scale bulk flow in the drop. As a result, we expect the rupture time to be independent of the viscosity of the gas layer. This is clearly evident in figure 23 which shows that the rupture time for cases in region 4 (solid-black symbols) are independent of the Stokes number.
In a recent study by Langley et al. (Reference Langley, Li and Thoroddsen2017), rupture times of the gas film were reported but their experiments were carried out for  $We > 7$ which is outside the range studied in the present work. Moreover, the ultra-high viscosity of the drops in their experiments prevents the formation of a kink allowing the drop to glide on a thin layer of gas (also see Langley & Thoroddsen Reference Langley and Thoroddsen2019). For drop impacts on dry surfaces, rupture is almost always non-axisymmetric owing to small asperities on the surface. The final rupture of the gas layer is expected to be dominated by van der Waals forces which usually become important for gas layer thicknesses of
 $\lessapprox O(10\ \textrm {nm})$. We arrive at this estimate by requiring the disjoining pressure to be
 $O(1)$ kPa, which is the typical value of the lubrication pressure for a
 $1\ \textrm {mm}$ drop impacting at
 $0.2\ \textrm {m}\,\textrm {s}^{-1}$. Using estimates for the disjoining pressure from Israelachvili (Reference Israelachvili2011),
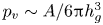 $p_v \sim A/6{\rm \pi} h_g^3$, where
 $A \sim 10^{-19}\ \textrm {J}$ is a typical value for the Hamaker constant, we get
 $h_g \sim 10\ \textrm {nm}$.
The total time taken for rupture of a gas layer can then be written as
 \begin{equation} t_{rupture} = t_r^{lub} + t_{vdw}, \end{equation}
where  $t_r^{lub} \approx t_r$ from (3.6) is thinning of the gas layer during lubrication and
 $t_{vdw}$ is the time scale for van der Waals driven rupture. If
 $t_r \gg t_{vdw}$ then the scaling estimate obtained in (3.6) is a fair estimate of the actual rupture time in real experiments, i.e.
 $t_{rupture} \approx t_r$. Balancing viscous forces in the gas layer with van der Waals forces, we can obtain an estimate for the time scale of van der Waals driven rupture (Leal Reference Leal2007):
 \begin{equation} t_{vdw} \sim \frac{4{\rm \pi}^2 \sigma \mu_g h_g^5}{\mathcal{A}^2}. \end{equation}
Here  $h_g$ is the gas layer thickness at which van der Waals forces cannot be ignored and
 $\mathcal {A}$ is the Hamaker constant. For example, using a 1 mm water drop in air impacting a solid surface with
 $\mathcal {A} \approx 10^{-19} J$, the ratio of
 $t_r/t_{vdw} \sim 10^{-36}/h_g^5$. For gas layers of
 $10$ nm thickness, we then have
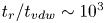 $t_r/t_{vdw} \sim 10^3$. Hence, rupture time based on lubrication theory is a fair estimate of the actual time for rupture of the gas layer even in the presence of intermolecular forces. Such an estimate is useful to know since rupture is seldom axisymmetric in experiments. In such a case,
 $t_r$ can be taken to be the point of first contact after the drop undergoes deformation which can be easily determined from fringe patterns in reflection interference microscopy experiments.
The above result in figure 23 is again a reminder that various regions in the phase diagram figure 7 not only admit different drop and gas film shapes, but also obey different scaling laws in each of the regions.
4. Summary and outlook
The topic of interest to the current study is the problem of a drop bouncing on a dry solid surface. Xu et al. (Reference Xu, Zhang and Nagel2005), in a seminal paper, showed that reducing the pressure of the surrounding gas can completely suppress splashing. This motivated the theoretical work of Mandre et al. (Reference Mandre, Mani and Brenner2009) and Mani et al. (Reference Mani, Mandre and Brenner2010) who also predicted that a drop could be supported on a thin cushion of gas before touchdown. This was experimentally verified in the experiments of Kolinski et al. (Reference Kolinski, Mahadevan and Rubinstein2014) and de Ruiter et al. (Reference de Ruiter, Lagraauw, van den Ende and Mugele2015c). The present study contributes to this fascinating problem using direct numerical simulations of Navier–Stokes equations using a volume-of-fluid interface tracking algorithm. To facilitate complete rebound of the drop, the contact angle was kept at a fixed value of  $170^{\circ }$. This allows a direct comparison between contact and non-contact bouncing events. Due to the self-similar character of the drop bouncing process, the study was restricted only to the first bounce of the drop. Further, Reynolds and Weber numbers were also kept relatively low to prevent the drop from disintegrating during impact. In spite of this restriction, the richness of the physics in the drop bouncing process is truly fascinating, especially the role played by the surrounding gas.
A key result of the paper is a phase diagram shown in figures 6 and 7 which delineates wettability-independent and wettability-dependent regions. In a WI region the drop is supported on a thin cushion of gas. This region is further divided into two regions – 1 and 3. In region 1 the gas film has a single minima in the radial direction, but in region 3 a second minima arises at a smaller radius. With increasing Reynolds number, the outer and inner minima make contact with the surface in regions 2 and 4, respectively. In region 5 both the inner and outer minima are found to make contact with the surface. The boundary between these regions is expected to be grid-dependent. Nevertheless, our simulations were found to be in excellent agreement with available experiments. A detailed analysis of the drop shapes and flow field reveals that downward motion of the upper surface of the drop shown in figure 13(a), due to nonlinear large-amplitude waves on the drop, causes thinning of the gas film near the axis of symmetry. Beyond a critical Reynolds number, strong shear present in the gas film generates a wavy motion on its upper surface, causing it to rupture, as shown in figure 14. At larger  $We$ and
 $Re$ found in region 4, we find that the downward plunging interface can undergo necking trapping a tiny gas bubble inside the drop. This process is reminiscent of the dry-out process described in Renardy et al. (Reference Renardy, Popinet, Duchemin, Renardy, Zaleski, Josserand, Drumright-Clarke, Richard, Clanet and Quéré2003), but no bubble trapping of the kind found here was reported in their study.
We now briefly discuss some prominent scaling relationships found in our study. The initial deformation height scales as 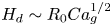 $H_d \sim R_0 Ca_g^{1/2}$. It is obtained by balancing capillary pressure in the drop to the lubrication pressure in the gas underneath it. At higher
 $St$, a different scaling is obtained in the experiments,
 $H_d \sim R_0 St^{-2/3}$, but due to the low values of Weber numbers employed in the current study, we do not observe this scaling. The scaling for minimum gas film thickness, denoted by
 $h_2$ in de Ruiter et al. (Reference de Ruiter, van den Ende and Mugele2015a), follows the scaling discovered by Mandre et al. (Reference Mandre, Mani and Brenner2009) and can be written as
 $h_{min} \sim R_0 St^{-8/9} We^{-2/3}$. Our simulations are in excellent agreement with this scaling law even though the initial deformation of the drop follows a different force balance from that discussed in Mandre et al. (Reference Mandre, Mani and Brenner2009). The radial extent of drop deformation requires two separate scaling laws, one, for the maximum radial extent of the drop, and two, for the radial position of the kink or first contact point. The spreading factor or the maximum radial extent of the drop, written as
 $R_0 + x$, follows the scaling derived in Richard & Quéré (Reference Richard and Quéré2000) and is given by
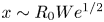 $x \sim R_0 We^{1/2}$. This scaling is obtained by balancing kinetic energy of the impacting drop with its surface energy at maximum deformation and is ideally suited for droplets impacting on superhydrophobic surfaces. Other laws have also been reported in the literature such as
 $R_{{max}} \sim R_0 Re^{1/5}$ in viscous dominated cases (Chandra & Avedisian Reference Chandra and Avedisian1991) or
 $R_{{max}} \sim R_0 We^{1/4}$ for large drops in a gravity dominated regime Clanet et al. (Reference Clanet, Béguin, Richard and Quéré2004). Such scaling laws are also summarised in the excellent review article by Josserand & Thoroddsen (Reference Josserand and Thoroddsen2016). In a follow-up paper where we focus on the energetics of a bouncing drop for the same range of
 $Re$ and
 $We$, we show a perfect exchange between kinetic and surface energies during drop impact further validating the
 $x \sim We^{1/2}$ scaling.
Two new scaling laws are derived in the present study, one for the radial extent of the kink and the other for the rupture time of the gas layer underneath the drop. Following the work of Manica et al. (Reference Manica, Klaseboer and Chan2016), we derive a new scaling law for the radial extent of the kink position, i.e.  $r_k \sim R_0 We^{1/4}$. In the case of drop–drop head-on collision, balancing deformation energy with the kinetic energy, Gopinath & Koch (Reference Gopinath and Koch2002) similarly estimated the radial extent of the ‘dimple’ to scale as
 $We^{1/4}$, consistent with the scaling for
 $r_k$ found here. For parameters in region 2, the gas film ruptures at the outer kink location. Experimental data extracted from de Ruiter et al. (Reference de Ruiter, van den Ende and Mugele2015a) is found to agree well with this scaling law, shown in figure 22, without the need for any adjustable numerical pre-factors. Another new scaling law found in the study is for the time taken for the gas layer to rupture after the drop undergoes its first deformation. For cases belonging to region 4 where contact occurs near the axis of symmetry, the rupture time is found to be independent of the Stokes number and can be given by the simple relation
 $t_r \approx \tau$. But for cases belonging to region 2, rupture time is found to obey the relationship
 $t_r/\tau \sim St^{-1/2}$.
The simulations were restricted to the incompressible regime. At higher impact speeds, compressibility effects cannot be ignored as has been shown in many past works. Another essential feature absent in the current simulations is the presence of non-continuum forces. Careful experiments carried out by Li et al. (Reference Li, Langley, Tian, Hicks and Thoroddsen2017) on drop impacts at varying ambient pressures have shed light on both compressibility as well as rarefaction effects. To accurately capture the rupture of the gas film, it is important to incorporate van der Waals forces and this poses many challenges with current numerical methods available. Josserand & Thoroddsen (Reference Josserand and Thoroddsen2016) have reviewed both experiments and theoretical works in drop impact dynamics focusing on the effect of roughness, among other factors. The roughness of the solid surface inevitably leads to non-axisymmetric spreading on the solid surface as well as formation of a ring of microbubbles (see Li et al. Reference Li, Vakarelski and Thoroddsen2015). The present simulations, being an axisymmetric study, cannot capture these trends. Introducing stochasticity at the onset of impact in three-dimensional simulations could be one way to bring the simulations closer to experimental findings. Therefore, the present simulations are ideally suitable for comparison just before contact/touchdown occurs.
Acknowledgements
P.K.S. thanks the Ministry of Human Resource Developement for a PhD fellowship and H.N.D. thanks the Science and Engineering Research Board (SERB), Department of Science and Technology through grant ECR/2015/000086 for funding this research. We also thank discussions with Dr S. Mandre and Dr J. de Ruiter for helpful clarifications during the research. We thank Dr B. Karri for proofreading the manuscript which helped us improve the overall presentation. We also thank an anonymous referee for insightful feedback and providing us with many important references. We express our gratitude to Dr S. Popinet and other developers of Gerris without whose efforts this work would not have been possible.
Declaration of interests
The authors report no conflict of interest.
Supplementary image and movies
Supplementary image and movies are available at https://doi.org/10.1017/jfm.2020.773.
Appendix. Drop–drop collision
The current study can easily be extended to simulate head-on collisions between two drops of the same radius. This is done by replacing the bottom solid surface with a surface of symmetry. One of the earliest simulation studies of drop–drop impact was carried out by Footte (Reference Footte1975) where the role of viscous forces was negligible. The effect of viscous forces both in the drop and the surrounding gas was subsequently included in the study of Nobari, Jan & Tryggvason (Reference Nobari, Jan and Tryggvason1996). The simulations in this appendix are similar to those of Nobari et al. (Reference Nobari, Jan and Tryggvason1996), but with a better resolved gas layer. Similar to the case of a drop impacting a solid surface, lubrication pressure in the intervening gas layer acts like a repelling force causing the drop to bounce back. But if the repulsion force is insufficient then coalescence occurs. Figure 24 shows the region of bouncing in the  $Re\text {--}We$ plane. This is very similar to the phase diagram shown in figure 6, but the boundary curve exists for much lower values of Reynolds number. This is understandable since the shear stress in the gas layer is significantly lower with a symmetry condition. Below the red boundary curve, drops are expected to bounce off each other without coalescence. Notice again a peak at
 $We=2.14$ in figure 24. This is not surprising since the same physics is at play on either side of
 $We=2.14$ peak in spite of a different boundary condition on the impact surface. The Weber numbers employed in Nobari et al. (Reference Nobari, Jan and Tryggvason1996) are significantly higher than those employed in the current study. This could be the reason why no such transition boundary was reported in their work.
Phase diagram showing the transition from non-contact (similar to WI region) to contact (similar to WD) type of interaction with a free-slip boundary condition on the impact surface. The impact surface is akin to a surface of symmetry and the simulation mimics the head-on collision of two identical drops. Open symbols ( $\square$) show simulation points where a thin gas layer prevents the drop from making contact with the gas surface. The drop bounces back without contact, hence, we refer to this region as the ‘bouncing region’. Above the transition boundary (orange line), the drop makes contact with the surface and simulations were stopped after the first contact. Vertical ‘error’ bars show that the transition boundary is grid-dependent similar to the phase diagram given in figure 6.