1. Introduction
Carbon isotopic compositions of dissolved inorganic carbon (δ13CDIC and Δ14CDIC) serve as powerful tracers for DIC cycling, providing insights into its mixing dynamics and biogeochemical processes. They are widely applied to study the dynamics of DIC and its impact on ocean acidification and carbon cycling (Sonnerup et al. Reference Sonnerup, Quay, McNichol, Bullister, Westby and Anderson1999). With the widespread application of accelerator mass spectrometers, radiocarbon (14C) is increasingly being used in research related to the carbon cycle. In summary, 13C and 14C play significant roles in carbon cycling and environmental changes. However, due to limitations in sampling and transportation conditions, samples intended for carbon isotopic composition analysis often cannot be analyzed promptly. Processes such as photosynthesis, respiration, CO2 dissolution and degassing, and organic carbon remineralization contribute to carbon isotopic fractionation (Boström et al. Reference Boström, Comstedt and Ekblad2007; Ghashghaie et al. Reference Ghashghaie, Badeck, Lanigan, Nogués, Tcherkez, Deléens, Cornic and Griffiths2003; Takahashi et al. Reference Takahashi, Minami, Aramaki, Handa and Matsushita2019a; Zhang et al. Reference Zhang, Quay and Wilbur1995). Additionally, microbial degradation of organic compounds in water samples continues over time, leading to a gradual decrease in the δ13CDIC in the absence of antimicrobial agents (Taipale and Sonninen Reference Taipale and Sonninen2009). Therefore, establishing appropriate storage conditions is essential to ensure the accuracy and reliability of DIC carbon isotopic composition analysis.
Mercuric chloride (HgCl2) has been widely utilized as an antimicrobial agent owing to its effectiveness in inhibiting microbial activity, thereby preventing microbially mediated organic matter degradation and minimizing the alteration or loss of DIC (Bouillon et al. Reference Bouillon, Abril, Borges, Dehairs, Govers, Hughes, Merckx, Meysman, Nyunja and Osburn2009; Griffith et al. Reference Griffith, McNichol, Xu, McLaughlin, Macdonald, Brown and Eglinton2012; Takahashi et al. Reference Takahashi, Minami, Aramaki, Handa and Matsushita2019a). Similarly, copper sulfate (CuSO4) has been employed as an antimicrobial agent in some studies (Doctor et al. Reference Doctor, Kendall, Sebestyen, Shanley, Ohte and Boyer2008; Taipale and Sonninen Reference Taipale and Sonninen2009). However, the disposal of HgCl2 presents significant health and environmental hazards owing to its pronounced biological toxicity (Argentino et al. Reference Argentino, Kalenitchenko, Lindgren and Panieri2023; Morel et al. Reference Morel, Kraepiel and Amyot1998; Takahashi et al. Reference Takahashi, Handa, Sugiyama, Matsushita, Kondo, Kimura and Tsujimura2019b). Nevertheless, both Cu and Hg compounds exhibit toxicity to humans and other organisms, necessitating stringent handling protocols to mitigate associated risks. At high concentrations of DIC (>30 ppm C), the use of CuSO4 as an antimicrobial agent can induce the precipitation of a copper carbonate phase (Révész and Doctor Reference Révész and Doctor2014). Consequently, there is a need to evaluate alternative preservation strategies that reduce reliance on toxic antibacterial agents while maintaining isotopic integrity.
Several studies have investigated alternative methods for preserving water samples intended for carbon isotopic analysis, aiming to avoid the use of toxic antibacterial agents. Taipale and Sonninen (Reference Taipale and Sonninen2009) compared three types of vials and showed that acidified samples stored in Exetainers equipped with butyl rubber septa maintained stable δ13CDIC values and DIC concentrations over a period of six months. The implementation of 0.2 μm filteration for sample pretreatment during sampling proved to be a more efficient and reliable methodology for δ13CDIC determination than conventional methods involving toxic chemicals (Wilson et al. Reference Wilson, Munizzi and Erhardt2020). Storage temperature is also an important factor affecting carbon isotopic compositions, as elevated temperatures can enhance microbial activity and consequently lead to greater isotopic fraction (van Geldern et al. Reference van Geldern, Verma, Carvalho, Grassa, Delgado-Huertas, Monvoisin and Barth2013; Wilson et al. Reference Wilson, Munizzi and Erhardt2020). In summary, filtration, antibacterial agents, and temperature are important storage conditions that affect the carbon isotopic compositions of DIC. Previous studies on suitable storage conditions have mainly focused on δ13CDIC (Li and Liu Reference Li and Liu2011; Taipale and Sonninen Reference Taipale and Sonninen2009; Wilson et al. Reference Wilson, Munizzi and Erhardt2020)
Owing to its extreme sensitivity to trace inputs of 14C-depleted carbon and to minor gas-exchange processes (Mook and van der Plicht Reference Mook and van der Plicht1999; Soto et al. Reference Soto, Araguás-Araguás, Han and Wassenaar2024), Δ14CDIC requires additional evaluation of storage-related effects. Glass containers and, in some cases, polyethylene (HDPE/LDPE) bottles are generally preferred for carbon isotope sampling due to their chemical inertness and low permeability (Bao et al. Reference Bao, Pang, Huang, Li, Tian, Luo and Qian2022; Chacha et al. Reference Chacha, Njau, Lugomela and Muzuka2018; Dickson et al. Reference Dickson, Sabine and Christian2007; Lamontagne et al. Reference Lamontagne, Suckow, Gerber, Deslandes, Wilske and Tickell2021; Schlegel et al. Reference Schlegel, Souza, Warix, Murray, Godsey, Seyfried, Cram and Lohse2024; Soto et al. Reference Soto, Araguás-Araguás, Han and Wassenaar2024; Wilde et al. Reference Wilde, Sandstrom and Skrobialowski2014; Zhong et al. Reference Zhong, Galy, Zolkos, Xu, Liu and Li2024). In addition, Δ14CDIC analysis requires larger sample volumes than δ13CDIC, which may pose logistical challenges when using glass containers and has, in some cases, been associated with the non-standard use of alternative containers whose impacts on radiocarbon integrity remain insufficiently quantified. PET bottles, in contrast, are not recommended as standard containers for carbon isotope samples. PET is chemically distinct from polyethylene (HDPE/LDEPE), as it contains ester linkages and aromatic units that promote polymer-specific leaching, biodegradation of PET-derived compounds, and permeability to atmospheric CO2 (Bach et al. Reference Bach, Dauchy, Chagnon and Etienne2012; Dhaka et al. Reference Dhaka, Singh, Anil, Sunil Kumar Naik, Garg, Samuel, Kumar, Ramamurthy and Singh2022; Yoshida et al. Reference Yoshida, Hiraga, Takehana, Taniguchi, Yamaji, Maeda, Toyohara, Miyamoto, Kimura and Oda2016). The consequences and mechanisms of such non-standard container use for radiocarbon integrity remain poorly constrained.
To address these gaps, this study systematically evaluates the effects of storage conditions—including temperature, pretreatment (filtration and HgCl2 addition), and container material (PET vs. glass)—on δ13CDIC and Δ14CDIC, with particular focus on PET bottle storage as a risk-assessment scenario.
2. Experimental method
2.1. Sample preparation
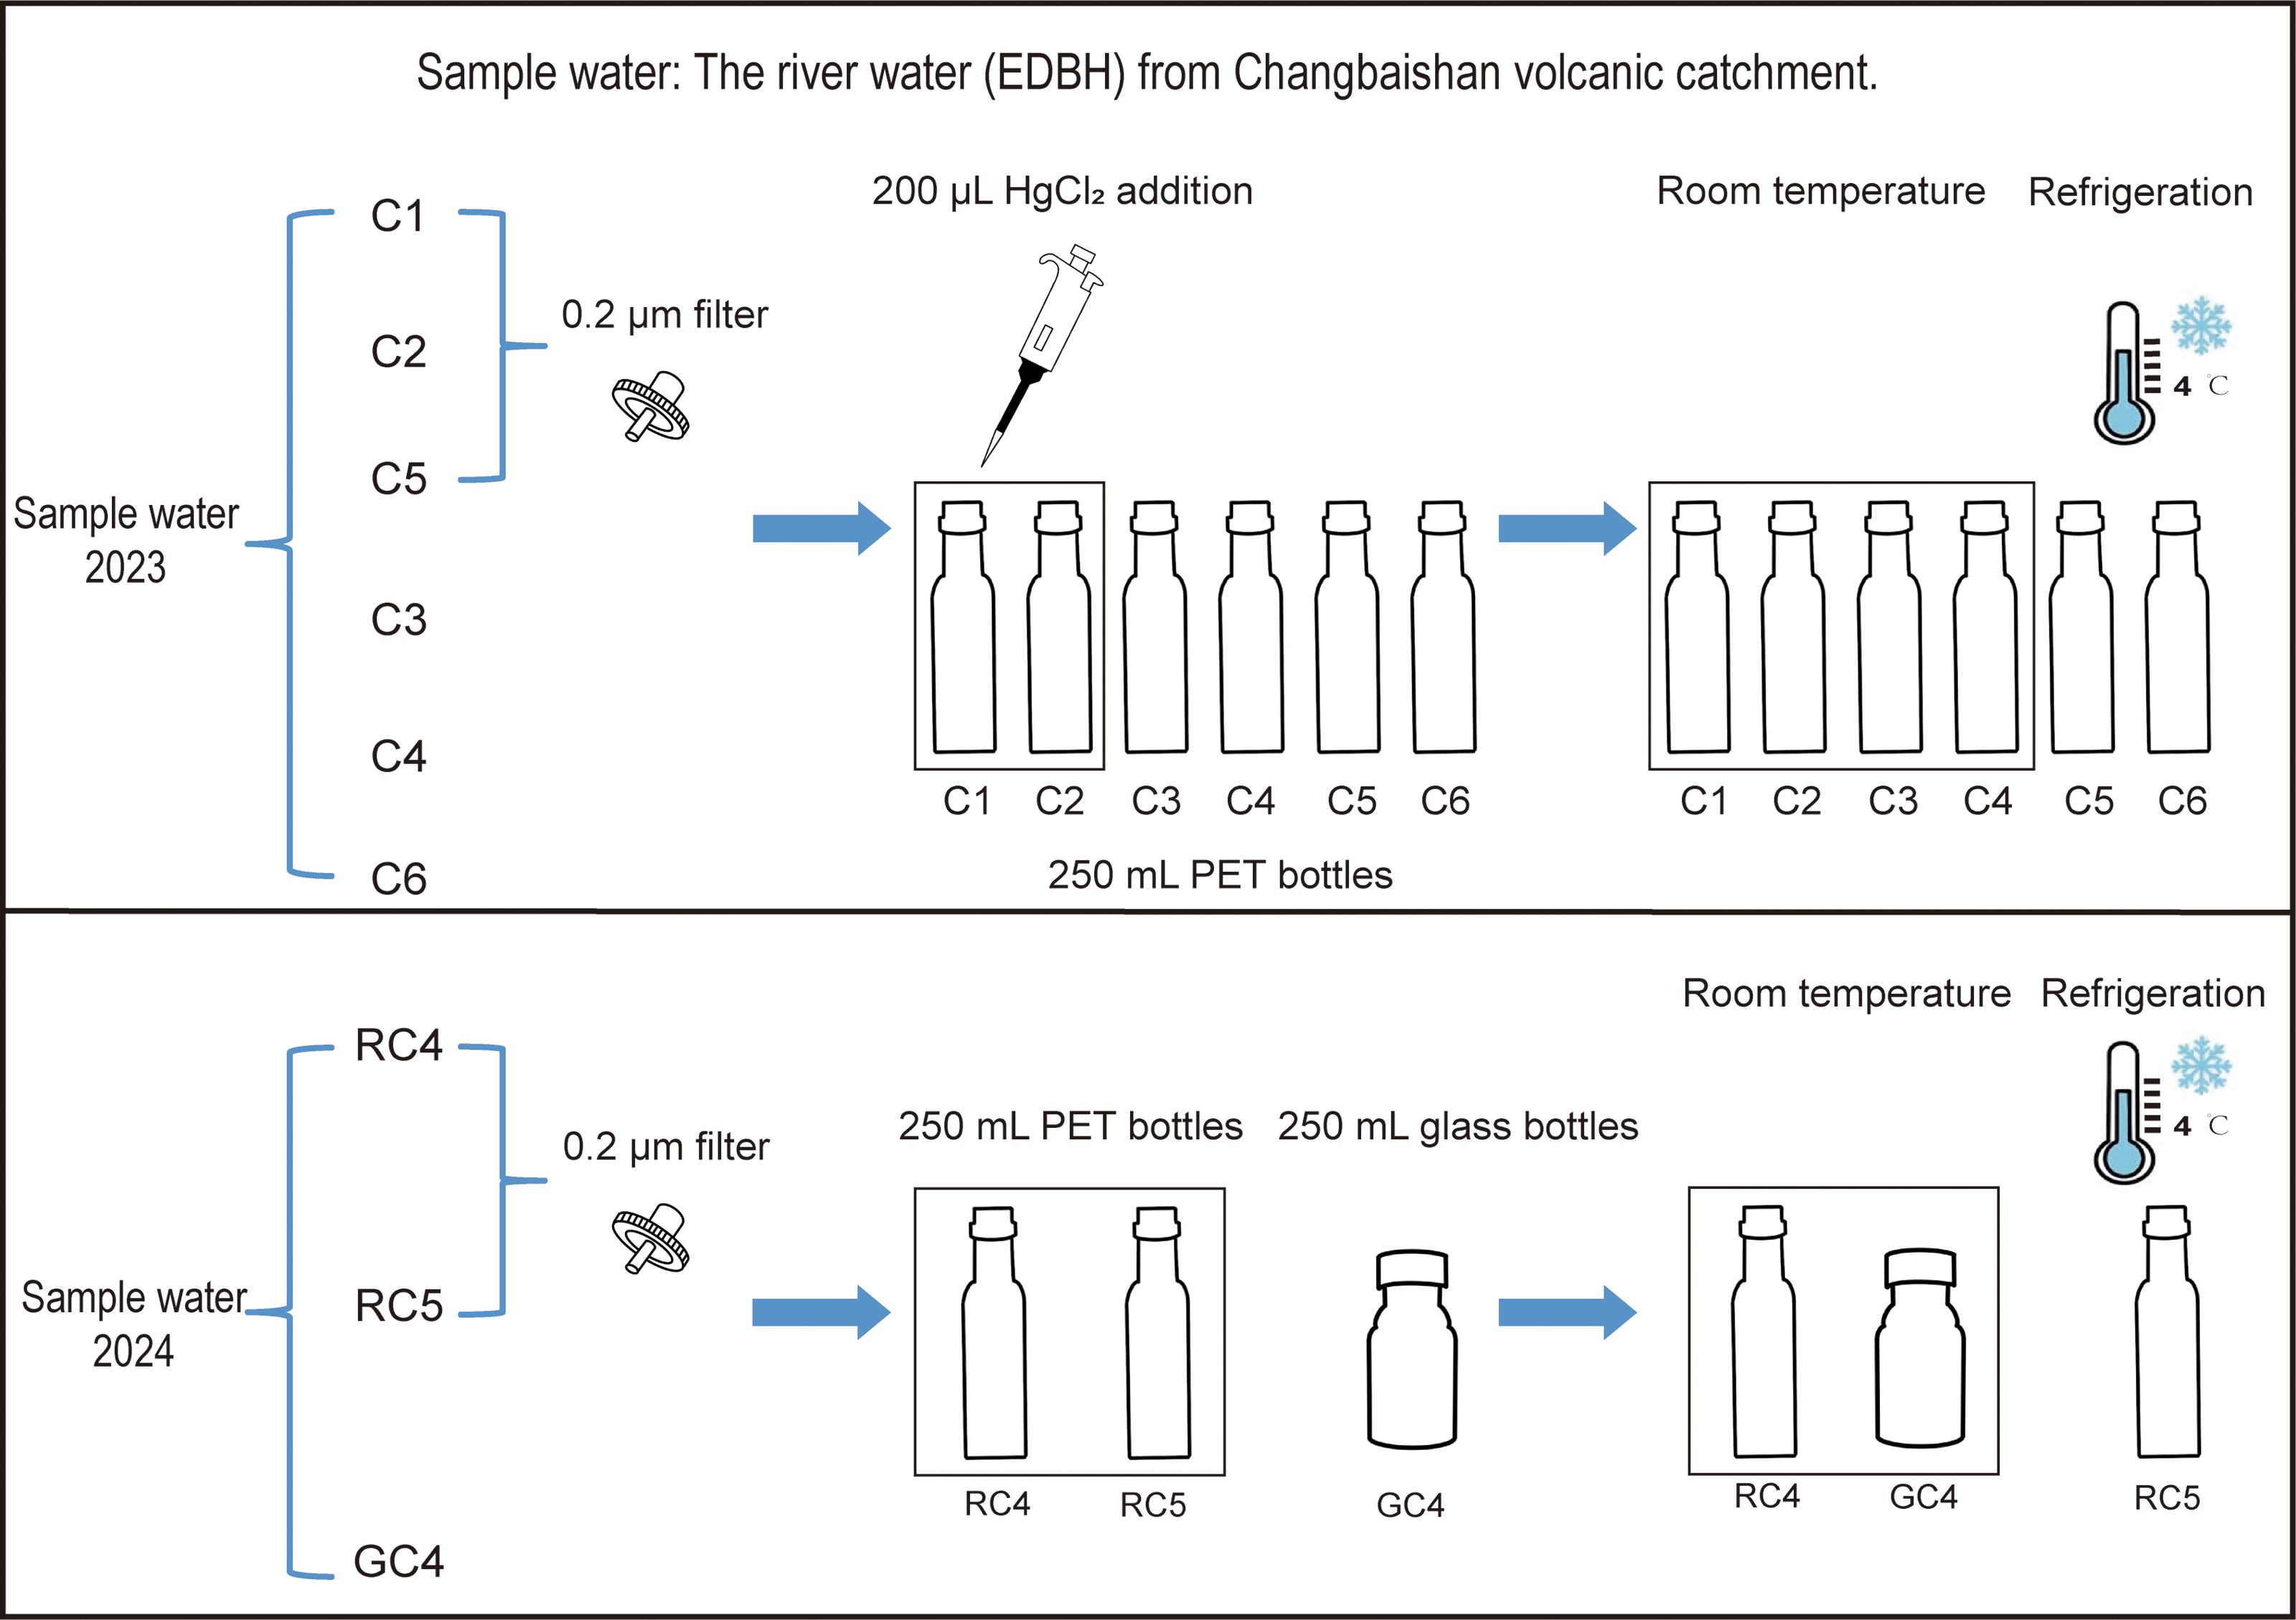
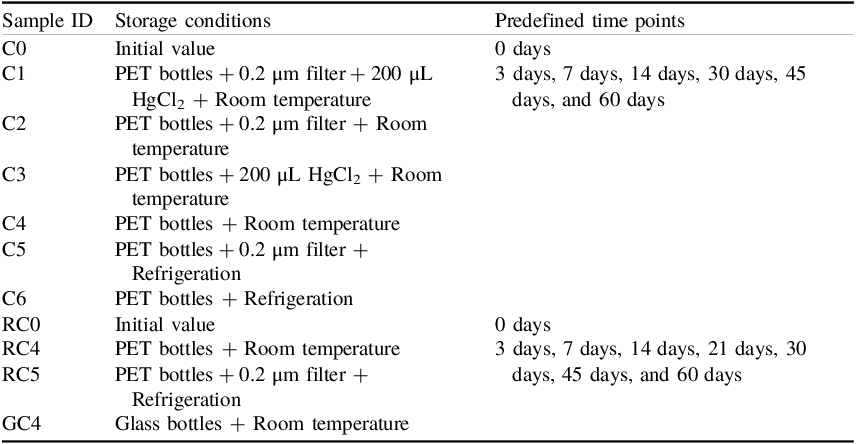
The river samples were collected from the Changbaishan volcanic catchment in northeastern China (128.107°E, 42.420°N). River samples were collected in July 2023 and transported them to the laboratory as quickly as possible. After mixing the samples evenly, they were processed according to the predefined storage conditions and divided them into 250 mL PET bottles for subsequent analysis at predefined time points (Figure 1 and Table 1). PET bottles were used in this study as a non-standard storage container to assess storge-induced effects of carbon isotopic compositions under different conditions. This experimental design was intended to assess the magnitude, mechanisms, and limits of PET-related effects.
Schematic diagram of sample water storage conditions. C1, C2, C3, C4, C5, C6, RC4, RC5, and GC4 were subjected to different pretreatments on the sample water, as shown in this figure.

Figure 1. Long description
Panel A: The diagram shows the pretreatment and storage conditions for sample water collected in 2023. Sample water is divided into six parts labeled C1, C2, C3, C4, C5, and C6. These samples are filtered using a 0.2 micrometer filter. 200 microliters of mercuric chloride (HgCl2) is added to each sample, which is then stored in 250 milliliter PET bottles. These bottles are divided into two groups: one stored at room temperature and the other under refrigeration at 4 degrees Celsius. Panel B: The diagram shows the pretreatment and storage conditions for sample water collected in 2024. Sample water is divided into three parts labeled RC4, RC5, and GC4. These samples are filtered using a 0.2 micrometer filter. RC4 and RC5 are stored in 250 milliliter PET bottles, while GC4 is stored in a 250 milliliter glass bottle. These bottles are divided into two groups: one stored at room temperature and the other under refrigeration at 4 degrees Celsius.
Sample storage conditions and predefined time points.

Table 1. Long description
A table with 8 rows and 3 columns. The columns are labeled Sample ID, Storage conditions, and Predefined time points. The table details various sample IDs and their corresponding storage conditions and predefined time points. Row 1: Sample ID C0, Storage conditions Initial value, Predefined time points 0 days. Row 2: Sample ID C1, Storage conditions PET bottles + 0.2 µm filter + 200 µL HgCl2 + Room temperature, Predefined time points 3 days, 7 days, 14 days, 30 days, 45 days, and 60 days. Row 3: Sample ID C2, Storage conditions PET bottles + 0.2 µm filter + Room temperature, Predefined time points 3 days, 7 days, 14 days, 30 days, 45 days, and 60 days. Row 4: Sample ID C3, Storage conditions PET bottles + 200 µL HgCl2 + Room temperature, Predefined time points 3 days, 7 days, 14 days, 30 days, 45 days, and 60 days. Row 5: Sample ID C4, Storage conditions PET bottles + Room temperature, Predefined time points 3 days, 7 days, 14 days, 30 days, 45 days, and 60 days. Row 6: Sample ID C5, Storage conditions PET bottles + 0.2 µm filter + Refrigeration, Predefined time points 3 days, 7 days, 14 days, 30 days, 45 days, and 60 days. Row 7: Sample ID C6, Storage conditions PET bottles + Refrigeration, Predefined time points 3 days, 7 days, 14 days, 30 days, 45 days, and 60 days. Row 8: Sample ID RC4, Storage conditions PET bottles + Room temperature, Predefined time points 3 days, 7 days, 14 days, 21 days, 30 days, 45 days, and 60 days. Row 9: Sample ID RC5, Storage conditions PET bottles + 0.2 µm filter + Refrigeration, Predefined time points 3 days, 7 days, 14 days, 21 days, 30 days, 45 days, and 60 days. Row 10: Sample ID GC4, Storage conditions Glass bottles + Room temperature, Predefined time points 3 days, 7 days, 14 days, 21 days, 30 days, 45 days, and 60 days.
Additionally, 2.5 L water was subsampled for the analysis of molecular composition of dissolved organic matter (DOM) and microbial 16S rRNA gene sequences on the sample subset C4 at the following predefined time points: 0 day, 7 days, 14 days, 30 days, 45 days, and 60 days. We collected the same river samples again in September 2024 for a supplementary experiment to explore the effect of containers on δ13CDIC and Δ14CDIC. The river samples were processed and packaged according to the storage conditions and predefined time points shown in Table 1. All samples were stored under light-protected conditions to ensure consistent lighting exposure.
2.2. Sample analysis
River samples were analyzed immediately after processing and packaging to serve as the control (day 0). Chemical compositions, δ13CDIC, and Δ14CDIC were analyzed for samples stored in different conditions at predefined time points. Additionally, molecular composition of DOM and microbial 16S rRNA gene sequencing were conducted on the sample subset C4 at predefined time points. On day 110 of the experimental period in 2023, additional analyses of δ13CDIC and Δ14CDIC were conducted to verify the impact of PET bottle permeability. All measurements were completed on the same day as each sampling run to eliminate temporal bias. All laboratory analyses in this study, except for microbial 16S rRNA gene sequencing, were conducted in the School of Earth System Science, Tianjin University.
2.2.1 pH, DIC and DOC concentrations
The pH was measured using a multiparameter portable meter (WTW Multi 3630 IDS, Xylem Analytics, Germany), which was calibrated prior to each measurement. Alkalinity was determined by titration with 0.01 mol/L hydrochloric acid using a digital titrator (Titrette, Brand GmbH, Germany). DIC concentrations were calculated through the carbonate equilibrium system, utilizing the measured total alkalinity as the primary input parameter (Di Toro Reference Di Toro1976). The dissolved organic carbon (DOC) concentrations were obtained by measuring the filtered river samples using the total organic carbon analyzer (Aurora 1030w, OI Analytical, USA). In the subsequent sections, DIC and DOC concentrations were denoted as [DIC] and [DOC], respectively.
2.2.2. Isotopic Analysis of DIC
For δ13CDIC analysis, DIC was reacted with 1 mL of 85% H3PO4 in pre-flushed He-filled 12 mL Labco headspace vials and was converted to gaseous CO2. CO2 samples were equilibrated for at least 24 hours to ensure isotopic homogeneity. Subsequently, CO2 was introduced into the isotope ratio mass spectrometer (Delta V, Thermo Fisher Scientific, USA) for δ13CDIC measurement. The analytical precision of the δ13CDIC measurements was 0.2‰, and values were reported in conventional delta notation (‰) relative to the Vienna Pee Dee Belemnite (V-PDB) international standard. Samples for 14C analysis were reacted with 2 mL of 85% H3PO4 in pre-evacuated headspace bottles to generate CO2 (Atekwana and Krishnamurthy Reference Atekwana and Krishnamurthy1998; Li et al. Reference Li, Liu, Tao, Lang and Han2005; Zhong et al. Reference Zhong, Galy, Zolkos, Xu, Liu and Li2024). The evolved CO2 was purified through a vacuum line incorporating liquid nitrogen cold traps to remove contaminants. Subsequently, the purified CO2 was reduced to graphite using the sealed-tube zinc reduction method (Xu et al. Reference Xu, Trumbore, Zheng, Southon, McDuffee and Luttgen2007, Reference Xu, Gao and Salamanca2013). The 14C content was measured using an accelerator mass spectrometer (XCAMS 0.5 MV, National Electrostatics Corporation, USA; Dong et al. Reference Dong, Lang, Hu, Zhong, Xu, Hauser and Gan2018). The results were reported as delta notation (Δ14C) in per mil values (‰), with an analytical precision of 0.3‰.
2.2.3. Molecular composition of dissolved organic matter
To determine the molecular characteristics of DOM, the filtered water samples were extracted using Varian Bond Elute PPL cartridges (0.5 g, 6 mL) as the solid-phase sorbent. After extraction, the column was rinsed with high-purity N2, and the extracted DOM was eluted with 6 mL of HPLC-grade methanol (Sigma Aldrich). The molecular composition of the eluted DOM was analyzed using a 7.0 T Bruker solariX FT-ICR-MS (solariX 2XR, Bruker, Germany) equipped with an electrospray ionization (ESI) source in the negative-ion mode. The raw datasets were internally calibrated with in-house reference mass lists using Data Analysis software (Bruker Daltonik, v5.0), achieving a mass error of less than 0.1 ppm. Molecular formula assignment and data processing of DOM were performed using ICBM-OCEAN (v1.0), following the method from Merder et al. (Reference Merder, Freund, Feudel, Hansen, Hawkes, Jacob, Klaproth, Niggemann, Noriega-Ortega and Osterholz2020), and baseline correction was applied to remove noise and signal drift. Further preprocessing, including peak alignment and intensity normalization, was performed to ensure consistency across samples. Chemical formulas were assigned by considering elements C1-100, H2-200, O1-50, N0-4, and S0-2.
2.2.4. 16S rRNA gene sequencing analysis
Samples for microbiological analysis were filtered through sterile membrane filters, and the V4 region of the 16S rRNA gene was amplified using the primer pair ArBa515F (5′-GTGCAGCMGCGCGGTAA-3′) and Arch806R (5′-GGACTACVSGGGTATCTAAT-3′), targeting both bacteria and archaea (Bates et al. Reference Bates, Berg-Lyons, Caporaso, Walters, Knight and Fierer2011). Paired-end sequencing was performed on an Illumina MiSeq platform, and quality filtering was conducted using the QIIME (v1.9.1) pipeline. Raw sequences were processed using UPARSE (version 7.0.1090) for quality filtering, chimera removal, and clustering into operational taxonomic units (OTUs) at 97% sequence similarity. Taxonomic classification was carried out using the RDP Classifier (version 2.11) with a confidence threshold of 0.7. The sequencing and bioinformatic analysis of 16S rRNA gene amplicons were performed at Majorbio Bio-Pharm Technology Co., Ltd. (Shanghai, China). The 16S rRNA gene sequencing data analysis was conducted on the Cloud Platform (https://cloud.majorbio.com/).
3. Results and discussion
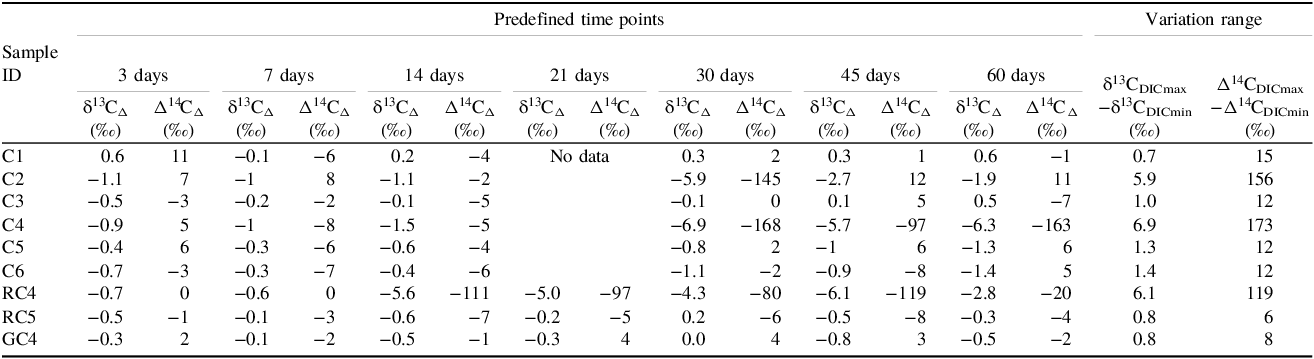
The chemical compositions of sample water at predefined time points are shown in Supplementary Table S1. This study examined the variations in different chemical characteristics and evaluated storage conditions that can assess storage-induced carbon isotopic bias. The parameters δ13CΔ and Δ14CΔ represented the respective deviations from their initial values during the experimental period, as shown in Table 2.
Respective deviations of δ13CDIC and Δ14CDIC relative to the original value at predefined time points for waters stored in different storage conditions.

C1: PET bottles + 0.2 μm filter + 200 μL HgCl2 + Room temperature, C2: PET bottles + 0.2 μm filter + Room temperature, C3: PET bottles + 200 μL HgCl2 + Room temperature, C4: PET bottles + Room temperature, C5: PET bottles + 0.2 μm filter + Refrigeration, C6: PET bottles + Refrigeration; 2024, RC4: PET bottles + Room temperature, RC5: PET bottles + 0.2 μm filter + Refrigeration, GC4: Glass bottles + Room temperature
3.1. Storage under HgCl2 addition
HgCl2 addition significantly influenced chemical compositions (C1 vs. C2 and C3 vs. C4, Supplementary Table S1). The pH, [DIC], [DOC], δ13CDIC and Δ14CDIC with HgCl2 addition (C1 and C3) exhibited smaller variations than those in C2 and C4. On day 3, δ13CΔ and Δ14CΔ of C1 increased by 0.6‰ and 11‰, respectively. Unfiltered C3 served as a control for C1, as it did not exhibit positive δ13CΔ and Δ14CΔ values, likely due to residual microbial activity (Keough et al. Reference Keough, Hagley, Ruzycki and Sierszen1998). Only the δ13CΔ values of C1 (0.6‰) and C3 (0.5‰) remained positive at day 60. Although Li and Liu (Reference Li and Liu2011) attributed similar observation to residual microbial activity, such processes generally lead to a negative δ13CDIC bias (Keough et al. Reference Keough, Hagley, Ruzycki and Sierszen1998), which is inconsistent with the positive values observed in our study. This pattern was therefore more plausibly explained by CO2 degassing induced by HgCl2 hydrolysis (Chai et al. Reference Chai, Wang, Wang, Li, Yang and Shu2010; Ciavatta and Grimaldi Reference Ciavatta and Grimaldi1968).
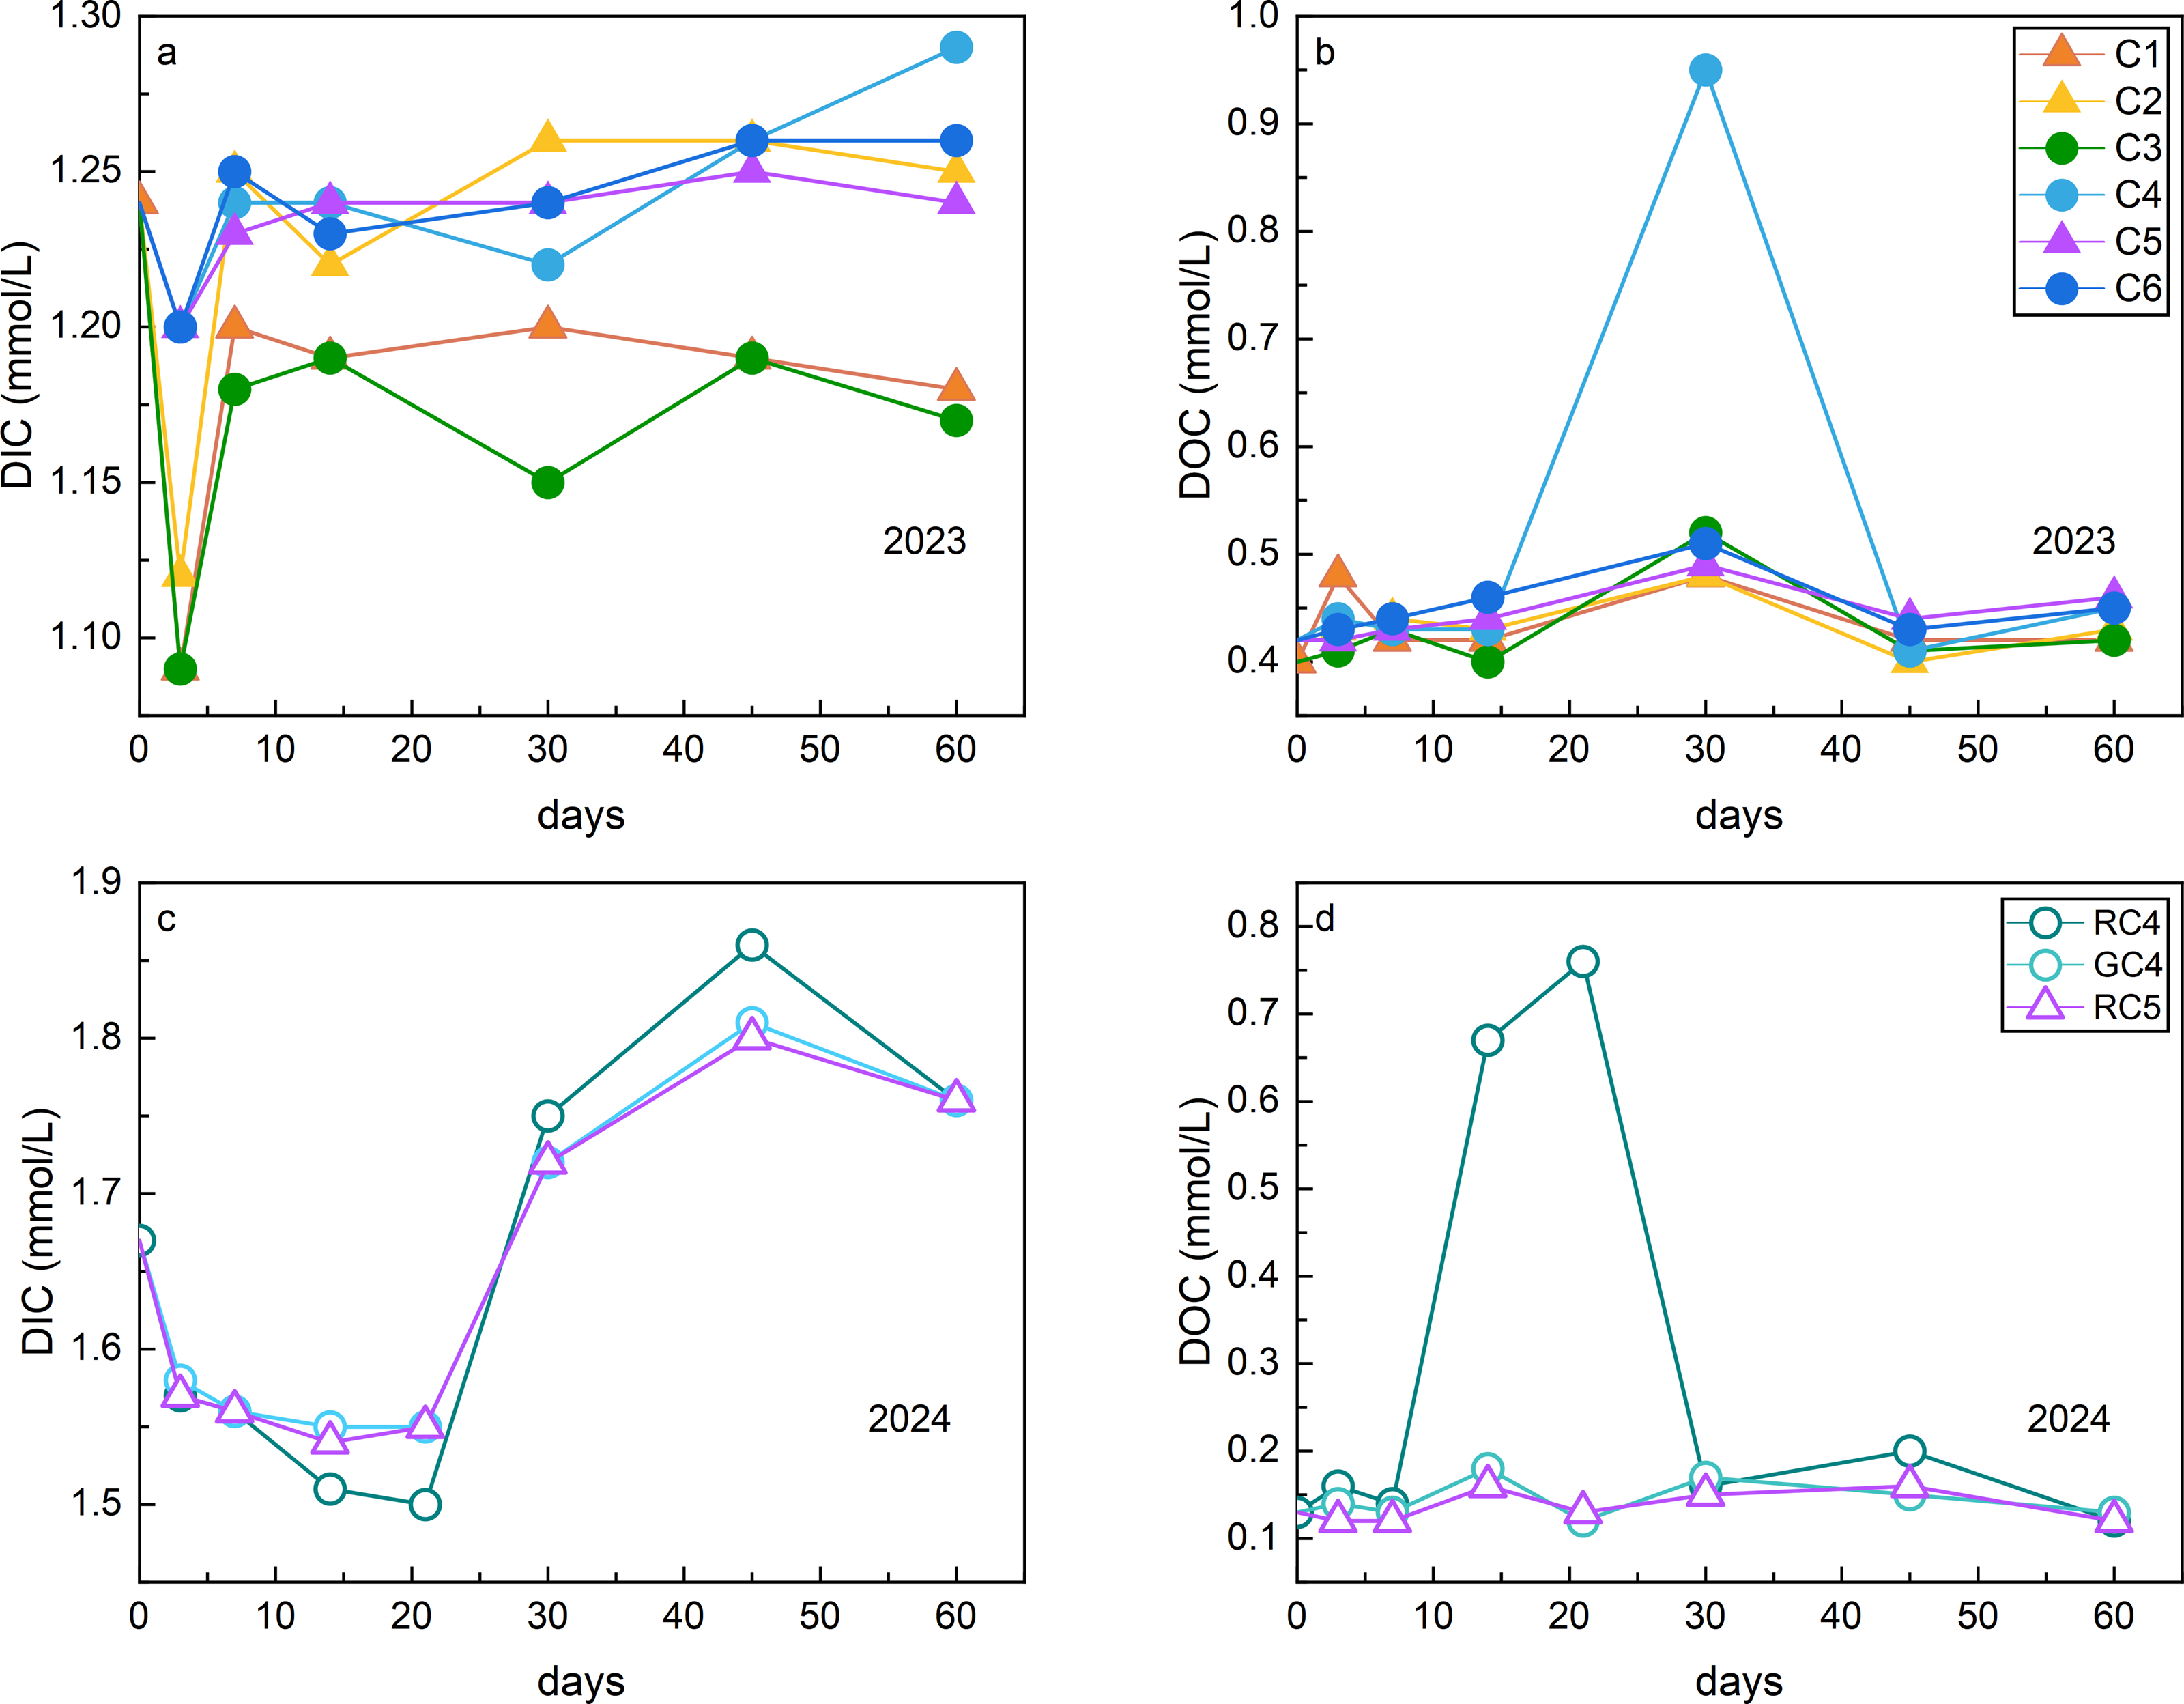
The hydrolysis of HgCl2 in aqueous solution generates hydrochloric acid (HCl) and mercury hydroxide (Hg(OH)2), wherein the subsequent ionization of HCl releases H+ ions, significantly lowering the solution pH (Chai et al. Reference Chai, Wang, Wang, Li, Yang and Shu2010; Ciavatta and Grimaldi Reference Ciavatta and Grimaldi1968). This pH reduction alters the equilibrium of carbonic acid dissociation, promoting CO2 generation and subsequent degassing (Di Toro Reference Di Toro1976). [DIC] of C1 and C3 (HgCl2 addition) remained consistently below the initial levels (Figure 2), with a maximum observed reduction of 0.15 mmol/L, showing a significant depletion of carbonate species in the DIC systems.
The variations of DIC and DOC concentrations in different storage conditions with the experimental period. The different storage conditions were as following: 2023, C1: PET bottles + 0.2 μm filter + 200 μL HgCl2 + Room temperature, C2: PET bottles + 0.2 μm filter + Room temperature, C3: PET bottles + 200 μL HgCl2 + Room temperature, C4: PET bottles + Room temperature, C5: PET bottles + 0.2 μm filter + Refrigeration, C6: PET bottles + Refrigeration; 2024, RC4: PET bottles + Room temperature, RC5: PET bottles + 0.2 μm filter + Refrigeration, GC4: Glass bottles + Room temperature.

3.2. Storage under different temperature conditions
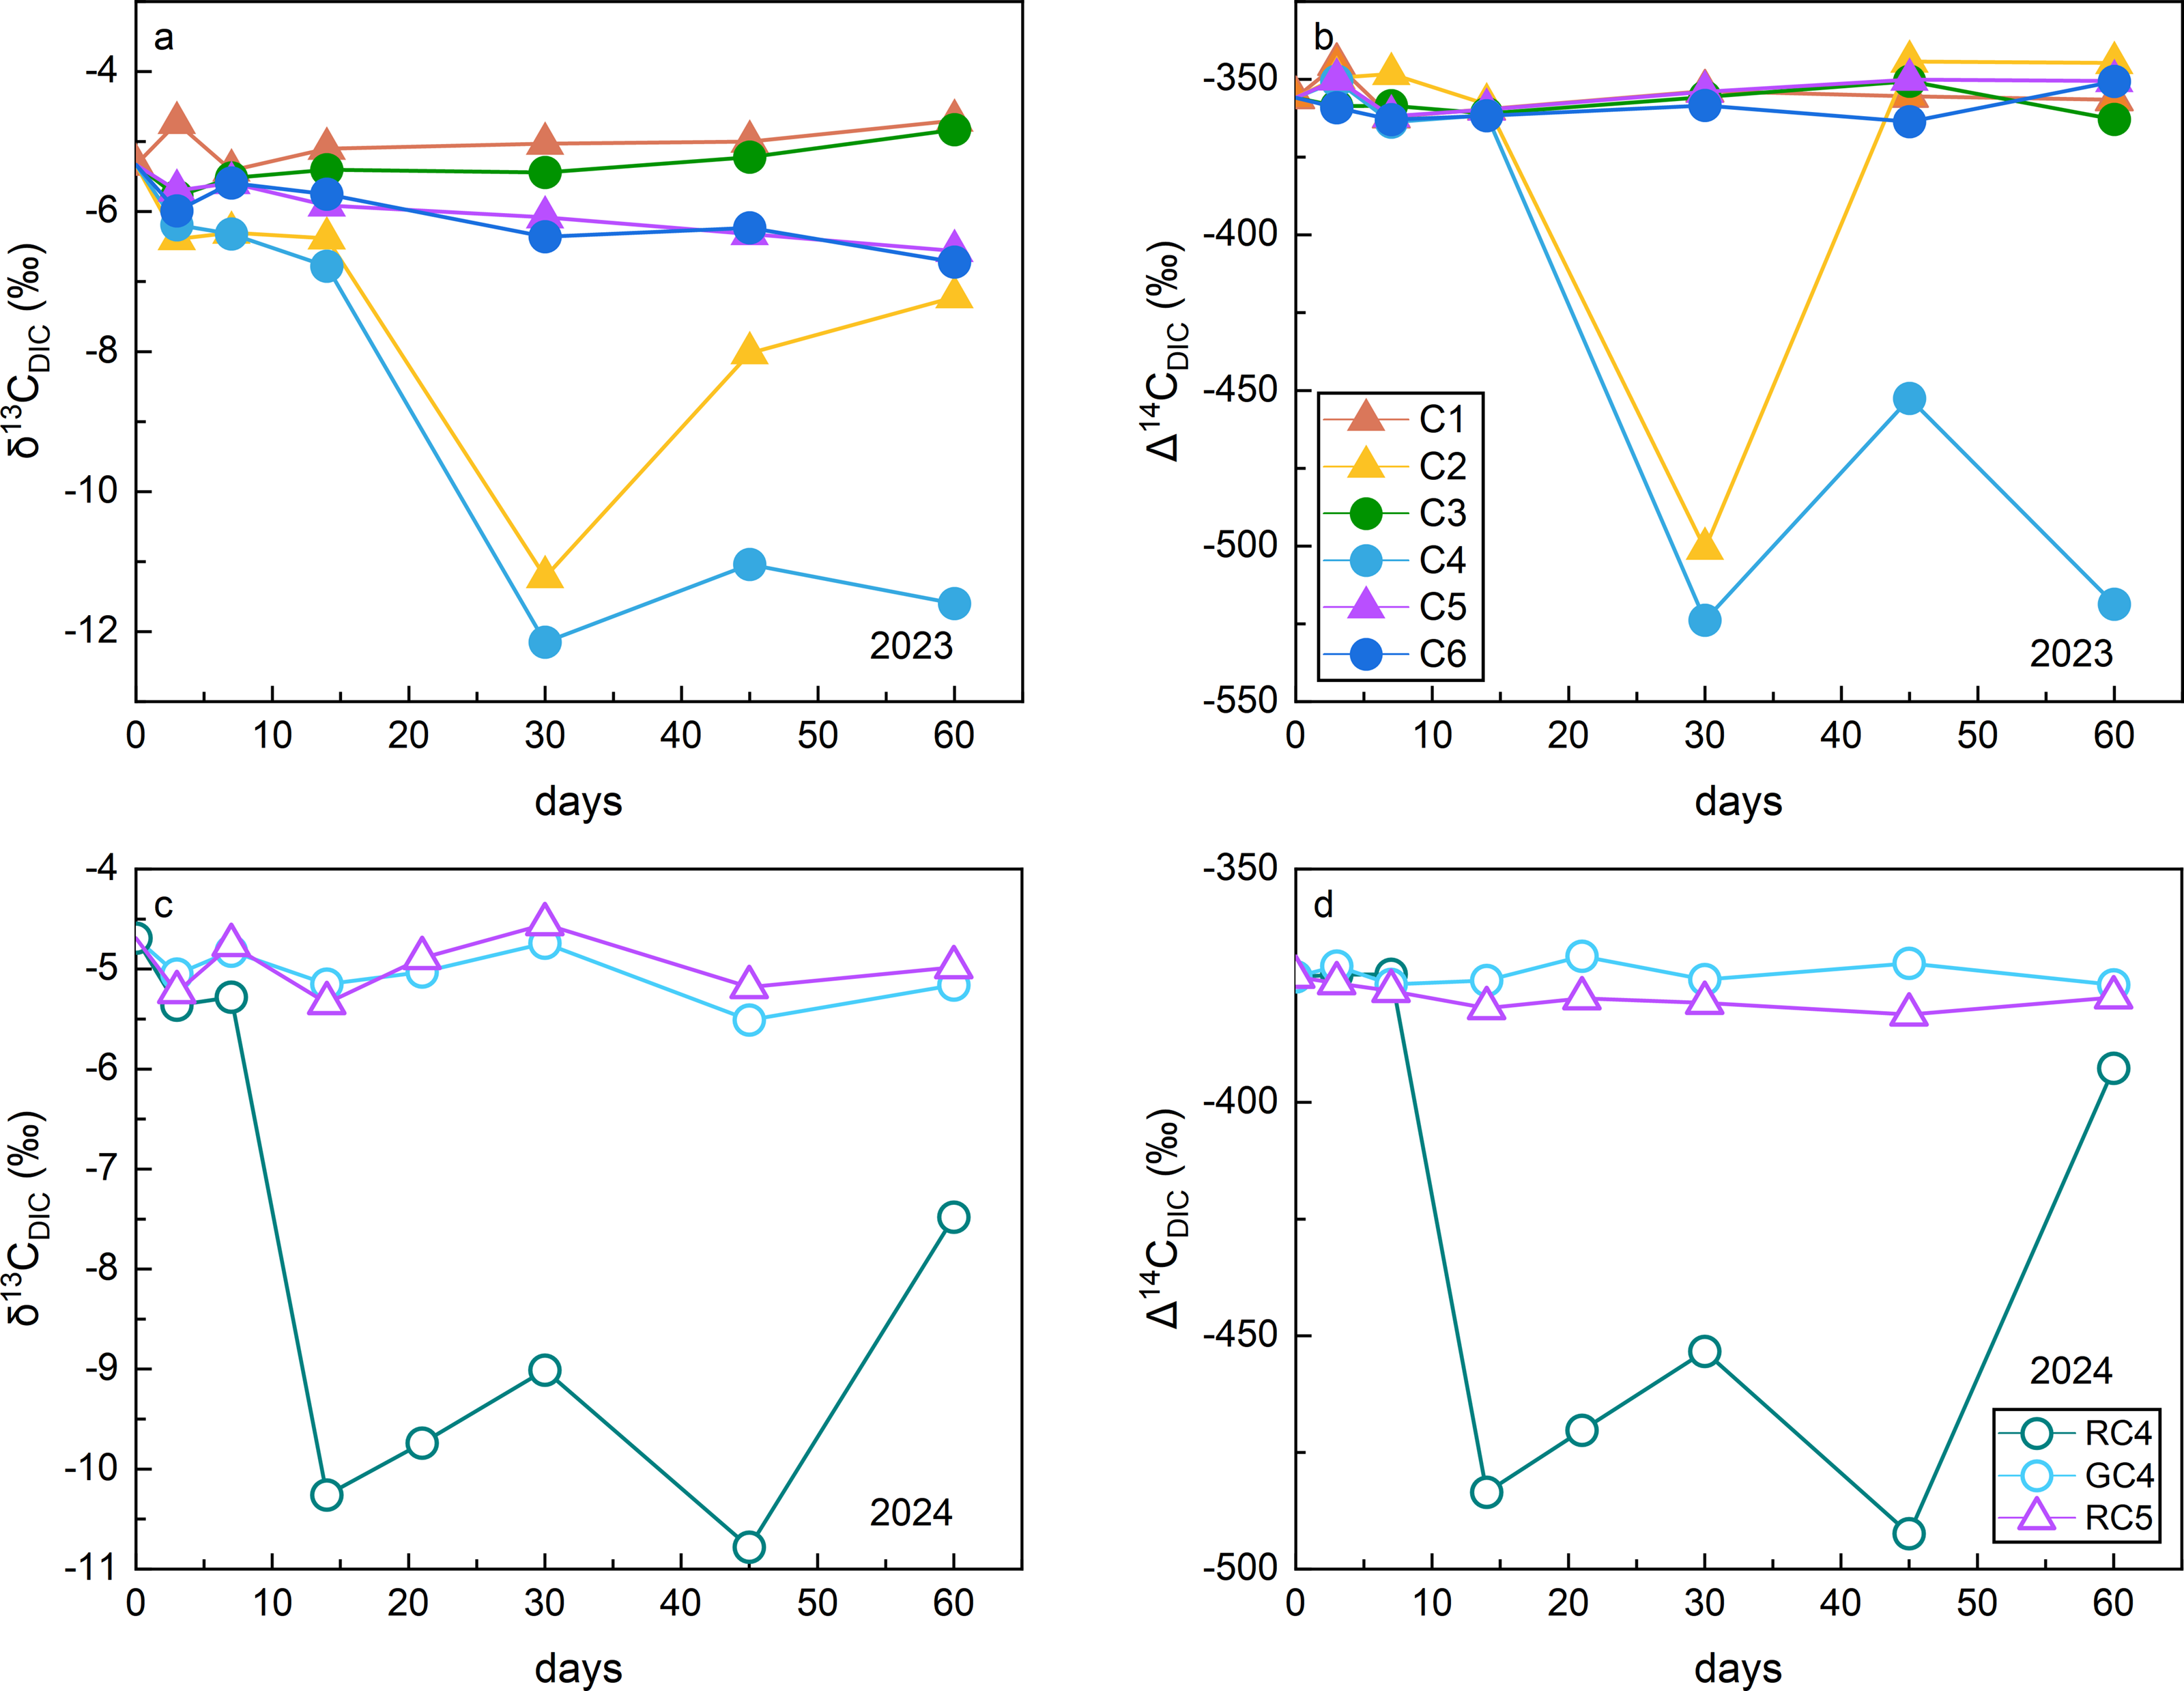
Refrigeration is a common storage condition used to minimize changes of DIC compositions (Li and Liu Reference Li and Liu2011; Myrbo and Shapley Reference Myrbo and Shapley2006). Samples stored under refrigeration exhibited minimal variations in pH, [DIC], and [DOC] throughout the experimental period. Correspondingly, the δ13CDIC values of C5 and C6 showed minor fluctuations, ranging from −6.6‰ to −5.3‰ and −6.7‰ to −5.3‰, respectively. The continuous decrease in δ13CDIC suggested that microbial activity influenced the carbon isotopic compositions (Keough et al. Reference Keough, Hagley, Ruzycki and Sierszen1998). The Δ14CΔ values of C5 and C6 remained positive on day 60, suggesting that the DIC system was potentially influenced by CO2 degassing (Taipale and Sonninen Reference Taipale and Sonninen2009). This effect appeared later in C6 than in C5, likely reflecting residual microbial activity. In contrast, samples stored at room temperature as controls (C2 and C4) exhibited notable changes in δ13CDIC and Δ14CDIC, indicating that room temperature storage of samples in PET bottles without antimicrobial agents is unsuitable for preserving isotopic integrity. The ranges of δ13CDIC and Δ14CDIC were 5.9‰ and 156‰ for C2, and 6.9‰ and 173‰ for C4, respectively.
Our results indicated that the stability of carbon isotopic compositions for samples in PET containers under refrigeration was comparable to that achieved with HgCl2 addition (Figure 3 and Table 2). The gradual decrease in δ13CDIC values suggested that refrigeration and filtration inhibited but did not completely prevent microbial activity. The oxidation of organic matter driven by microbial activity under refrigeration conditions continued to influence the DIC system and carbon isotopic compositions.
The variations of δ13CDIC and Δ14CDIC values in different storage conditions with the experimental period. The different storage conditions were as following: 2023, C1: PET bottles + 0.2 μm filter + 200 μL HgCl2 + Room temperature, C2: PET bottles + 0.2 μm filter + Room temperature, C3: PET bottles + 200 μL HgCl2 + Room temperature, C4: PET bottles + Room temperature, C5: PET bottles + 0.2 μm filter + Refrigeration, C6: PET bottles + Refrigeration; 2024, RC4: PET bottles + Room temperature, RC5: PET bottles + 0.2 μm filter + Refrigeration, GC4: Glass bottles + Room temperature.

3.3. Storage under different filtration conditions
Based on the filtering conditions, all samples were categorized into three groups (C1 vs. C3, C2 vs. C4, C5 vs. C6). Under otherwise identical conditions, filtered samples exhibited greater stability in [DOC] than unfiltered samples, suggesting that changes in [DOC] were largely driven by microbial activity. Microbially mediated conversions between DIC and DOC can occur through various metabolic pathways. Chemolithoautotrophic processes generally increase DOC (Ishii et al. Reference Ishii, Kawaichi, Nakagawa, Hashimoto and Nakamura2015), while heterotrophic respiration decreases it (He et al. Reference He, Xiao, Fan, Zhao, Cao, Zhang and Jiang2022). Under anaerobic oxidation, DOC may either increase or decrease depending on whether microorganisms use DIC as a carbon source for biosynthesis (Havas et al. Reference Havas, Thomazo, Iniesto, Jézéquel, Moreira, Tavera, Caumartin, Muller, López-García and Benzerara2023). These pathways highlight the diverse roles of microbial communities in carbon transformation. Additionally, the leaching and biodegradation of PET-derived compounds likely contributed to DOC accumulation in the system (Bach et al. Reference Bach, Dauchy, Chagnon and Etienne2012).
Under the HgCl2 addition and refrigeration, carbon isotopic compositions remained relatively stable, regardless of filtration treatment. In contrast, the DIC system in C2 and C4 exhibited significant disturbances at room temperature. The [DOC] of C4 increased substantially to 0.95 mmol/L by day 30, coinciding with the period of most pronounced apparent 14C aging. Meanwhile, the [DOC] of C2 remained relatively low at 0.48 mmol/L; nevertheless, C2 exhibited markedly depleted δ13CDIC and Δ14CDIC values. This pattern suggested that microbial activity strongly influenced the carbon isotopic compositions at room temperature (Keough et al. Reference Keough, Hagley, Ruzycki and Sierszen1998) and that filtration alone was insufficient to inhibit microbial activity.
3.4. Effects of container
3.4.1. Transformation of PET bottles
To assess the impact of containers, a supplementary experiment was conducted to compare the storage efficiency of glass and PET bottles for carbon isotopic composition analysis. Our results from 2023 suggested that refrigeration combined with filtration was effective under the predefined storage conditions, and thus this condition was used as a control. RC4 exhibited the similar aging phenomenon as C4, with Δ14CDIC values ranging from −373‰ to −492‰, suggesting that this effect was systematic rather than incidental. In contrast, GC4 did not exhibit apparent 14C aging, with Δ14CDIC values ranging from −375‰ to −369‰, indicating a container-specific influence associated with PET bottles. Additionally, the [DOC] in RC4 varied significantly, from 0.12 mmol/L to 0.76 mmol/L. The depleted δ13CDIC and Δ14CDIC values in the sealed system may be attributed to the microbial decomposition of organic matter, which produced DIC enriched in 12C (Keough et al. Reference Keough, Hagley, Ruzycki and Sierszen1998). The pH-dependent dissolution of acid-neutralizing substances in glass, such as borates, silicates, or hydroxyl ions, could potentially lead to increased alkalinity (Bunker Reference Bunker1994; Mos et al. Reference Mos, Holloway, Kelaher, Santos and Dworjanyn2021; Zhang et al. Reference Zhang, Fischer and Ortner1999). However, this phenomenon was not observed in this study. Unfiltered river water samples stored at room temperature in glass bottles showed the least change in DIC carbon isotopic compositions compared to other storage conditions in the 2024 experiment.
A comparison between RC4 and GC4 in the supplementary experiment indicated that the 14C-depleted carbon did not originate from the sample water, as GC4 did not exhibit the same magnitude of decrease in δ13CDIC and Δ14CDIC values as RC4. This contrast suggested the involvement of external δ13CDIC- and Δ14CDIC-depleted carbon sources into the DIC system associated with PET bottles (14C-depleted carbon) in this study (δ13C: −40‰ to −28‰, Δ14C: −1000‰, Jou et al. Reference Jou, Macario, Carvalho, Dias, Brum, Cunha, Ferreira and Chanca2015). The simultaneous increase and decrease of δ13C and Δ14C in C4 and RC4 were consistent with combined effects of atmospheric CO2 exchange and PET-related carbon inputs (Hua et al. Reference Hua, Turnbull, Santos, Rakowski, Ancapichún, De Pol-Holz, Hammer, Lehman, Levin and Miller2022; Keough et al. Reference Keough, Hagley, Ruzycki and Sierszen1998; Soto et al. Reference Soto, Araguás-Araguás, Han and Wassenaar2024; Sturm et al. Reference Sturm, Tuzson, Henne and Emmenegger2013).
3.4.2. Permeation of PET bottles
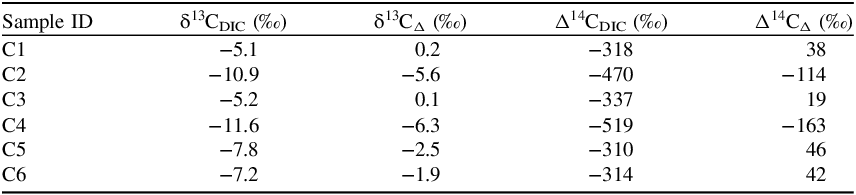
The permeation of PET bottles may significantly impact the DIC system (Taipale and Sonninen Reference Taipale and Sonninen2009; van Geldern et al. Reference van Geldern, Verma, Carvalho, Grassa, Delgado-Huertas, Monvoisin and Barth2013). Over extended storage periods, carbon isotope exchange between atmospheric CO2 and the stored water became an important factor influencing the carbon isotopic compositions of the DIC system (Soto et al. Reference Soto, Araguás-Araguás, Han and Wassenaar2024). The results of additional testing on δ13CDIC and Δ14CDIC over 110 days were presented in Table 3. The results showed that, except for C2 and C4, all other samples exhibited a significant deviations in Δ14CDIC. This increase in Δ14CDIC indicated that modern carbon from the atmosphere entered the system, increasing the 14C content (Hua et al. Reference Hua, Turnbull, Santos, Rakowski, Ancapichún, De Pol-Holz, Hammer, Lehman, Levin and Miller2022). Only the δ13CDIC values of C1 and C3 increased, whereas those of the other treatments decreased, suggesting that microbial processes likely persisted in the DIC systems under different storage conditions. HgCl2 addition was the most effective treatment for inhibiting microbial activity.
δ13CDIC and Δ14CDIC values and respective deviations relative to the original value over 110 days in 2023.

Table 3. Long description
A table comparing carbon isotope values and their differences over 110 days. The table has six rows and four columns. The columns are labeled Sample I D, delta 13 C D I C (percent), delta 13 C delta (percent), delta 14 C D I C (percent), and delta 14 C delta (percent). Row 1: Sample I D, C 1; delta 13 C D I C (percent), negative 5.1; delta 13 C delta (percent), 0.2; delta 14 C D I C (percent), negative 318; delta 14 C delta (percent), 38. Row 2: Sample I D, C 2; delta 13 C D I C (percent), negative 10.9; delta 13 C delta (percent), negative 5.6; delta 14 C D I C (percent), negative 470; delta 14 C delta (percent), negative 114. Row 3: Sample I D, C 3; delta 13 C D I C (percent), negative 5.2; delta 13 C delta (percent), 0.1; delta 14 C D I C (percent), negative 337; delta 14 C delta (percent), 19. Row 4: Sample I D, C 4; delta 13 C D I C (percent), negative 11.6; delta 13 C delta (percent), negative 6.3; delta 14 C D I C (percent), negative 519; delta 14 C delta (percent), negative 163. Row 5: Sample I D, C 5; delta 13 C D I C (percent), negative 7.8; delta 13 C delta (percent), negative 2.5; delta 14 C D I C (percent), negative 310; delta 14 C delta (percent), 46. Row 6: Sample I D, C 6; delta 13 C D I C (percent), negative 7.2; delta 13 C delta (percent), negative 1.9; delta 14 C D I C (percent), negative 314; delta 14 C delta (percent), 42.
C1: PET bottles + 0.2 μm filter + 200 μL HgCl2 + Room temperature, C2: PET bottles + 0.2 μm filter + Room temperature, C3: PET bottles + 200 μL HgCl2 + Room temperature, C4: PET bottles + Room temperature, C5: PET bottles + 0.2 μm filter + Refrigeration, C6: PET bottles + Refrigeration; 2024, RC4: PET bottles + Room temperature, RC5: PET bottles + 0.2 μm filter + Refrigeration, GC4: Glass bottles + Room temperature.
3.5. Reasons for apparent 14C aging
3.5.1. Biodegradation of PET-derived compounds
As shown in section 3.4.1, the factor that had the greatest impact on changes in δ13CDIC and Δ14CDIC was PET bottle storage, which involves leaching and biodegradation of PET-derived compounds. PET is a high molecular weight thermoplastic semi-crystalline polymer synthesized through the polycondensation of terephthalic acid (TPA) and ethylene glycol (EG, Webb et al. Reference Webb, Arnott, Crawford and Ivanova2012). The leaching of PET released PET oligomers and additives, including trace metals, carbonyl compounds, phthalates, bisphenol A, and other contaminants (Bach et al. Reference Bach, Dauchy, Chagnon and Etienne2012; Keresztes et al. Reference Keresztes, Tatár, Czegeny, Záray and Mihucz2013; Reimann et al. Reference Reimann, Birke and Filzmoser2012; Westerhoff et al. Reference Westerhoff, Prapaipong, Shock and Hillaireau2008). The degradation pathways of PET include photodegradation, thermo-oxidative degradation and biodegradation (Fotopoulou and Karapanagioti Reference Fotopoulou and Karapanagioti2017; Singh and Sharma Reference Singh and Sharma2008). The storage conditions in this study were light-protected at either room temperature or refrigeration, which precluded the possibility of photodegradation and thermo-oxidative degradation. Moreover, our results from experiments using different containers indicated that the detected 14C-depleted carbon was most likely associated with PET-derived compounds. The samples in which microbial activity was inhibited by HgCl2 addition or refrigeration did not show the apparent 14C aging, supporting the interpretation that 14C-depleted carbon in DIC was primarily driven through biodegradation. Under the applied experimental conditions, direct bulk PET biodegradation was unlikely to generate substantial DIC and to cause measurable changes in the carbon isotopic compositions (Chamas et al. Reference Chamas, Moon, Zheng, Qiu, Tabassum, Jang, Abu-Omar, Scott and Suh2020; Ioakeimidis et al. Reference Ioakeimidis, Fotopoulou, Karapanagioti, Geraga, Zeri, Papathanassiou, Galgani and Papatheodorou2016; Kushwaha et al. Reference Kushwaha, Goswami, Singhvi and Kim2023). These findings collectively demonstrated that the biodegradation of PET-derived compounds may be the principal contributor to apparent 14C aging under the experimental conditions. In contrast, samples stored in glass bottles did not show apparent 14C aging, consistent with their chemical inertness and poor suitability for biofilm formation.
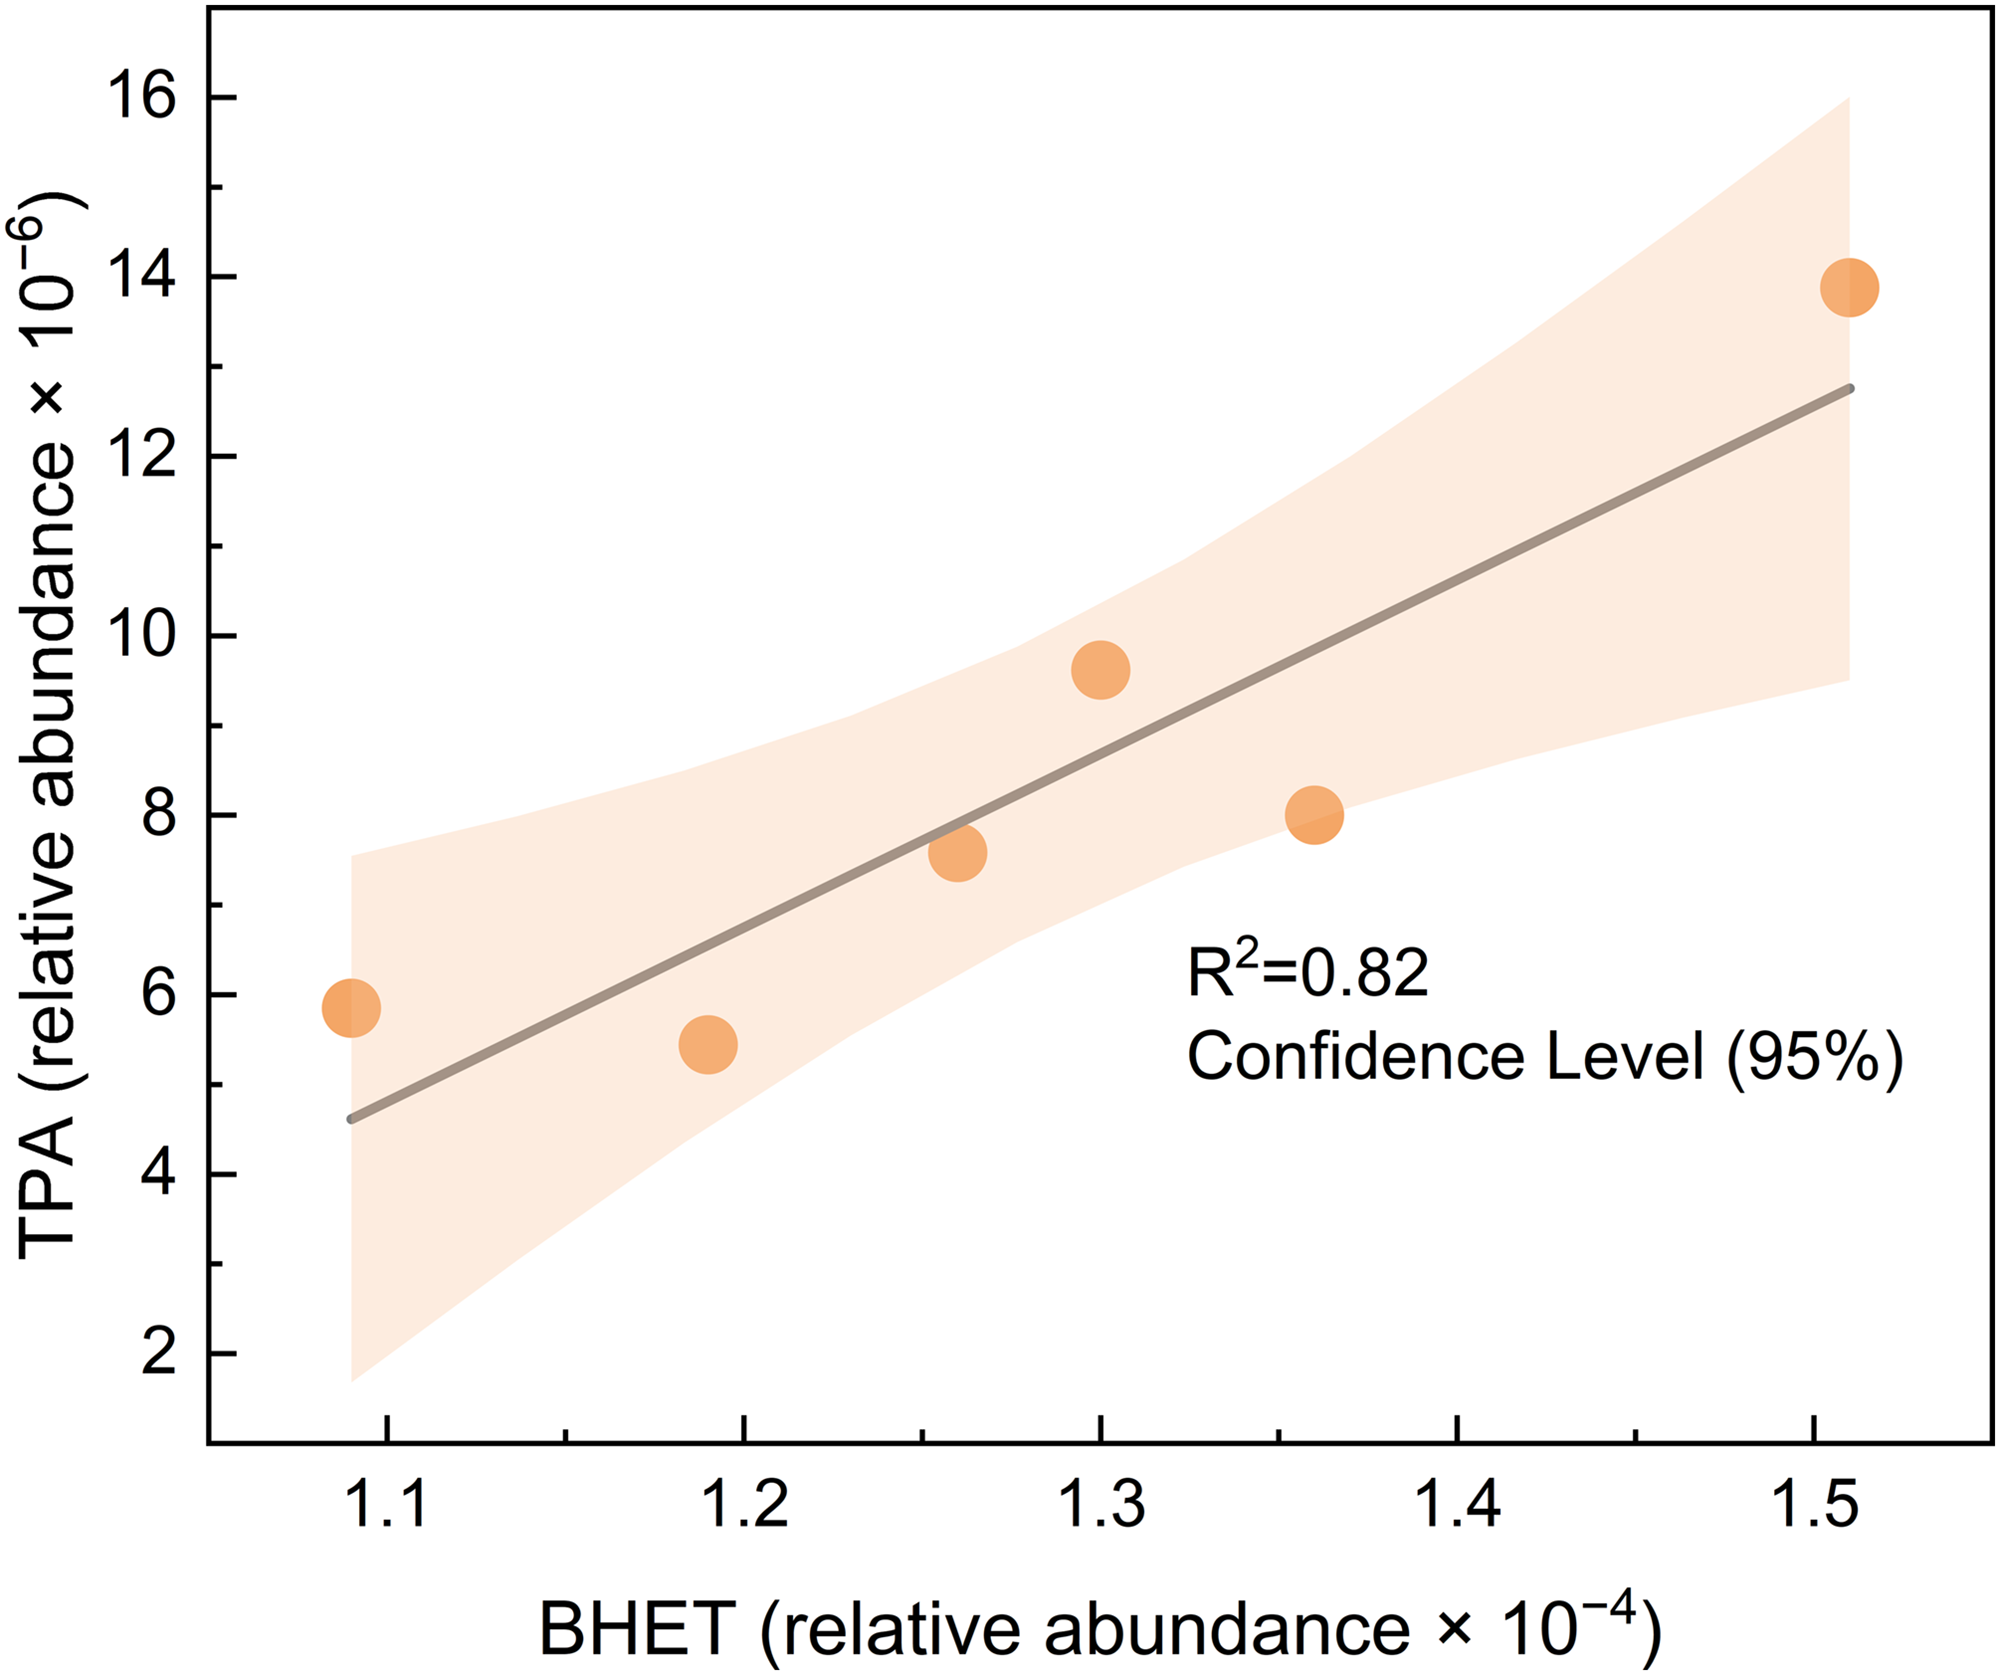
The biodegradation products of PET-derived compounds primarily consist of a mixture of TPA, EG, bis-(2-hydroxyethyl) terephthalate (BHET, de Queiros Eugenio et al. Reference de Queiros Eugenio, Campisano, Dias, de Castro, Coelho and Langone2022; Kushwaha et al. Reference Kushwaha, Goswami, Singhvi and Kim2023). The main intermediate products of PET degradation are BHET and MHET. In this study, MHET was not detected, further supporting that the observed apparent 14C aging was caused by the biodegradation of PET-derived compounds rather than bulk PET. In addition, EG could not be analyzed because its molecular weight was below the detection limit. Therefore, we focused on investigating the relative abundance changes of BHET and TPA. The relative abundance of BHET varied from 1.09×10⁻⁴ to 1.51×10⁻⁴, while the relative abundance of TPA ranged from 5.44×10⁻⁶ to 13.88×10⁻⁶. The relative abundance of BHET and TPA was positively correlated (Figure 4), indicating synchronous consumption and accumulation of both. The relative abundance of BHET and TPA was low during the first 14 days and showed a gradual increase thereafter, indicating progressive accumulation of PET-derived compounds. The relative abundance of BHET and TPA was negatively correlated with Δ14CDIC values (Supplementary Figure S1), indicating that the degradation of PET-derived compounds is the source of 14C-depleted carbon in DIC. The degradation of PET-derived compounds was consistent with changes in pH, [DOC], and carbon isotopic compositions, emphasizing the importance of containers for samples used for analyzing carbon isotopic compositions.
The correlation between terephthalic acid (TPA) and bis-(2-hydroxyethyl) terephthalate (BHET) in C4. The relative abundance of TPA and BHET was positively correlated, R2 = 0.82. C4: PET bottles + Room temperature.

3.5.2. Related enzymes of PET-derived compounds
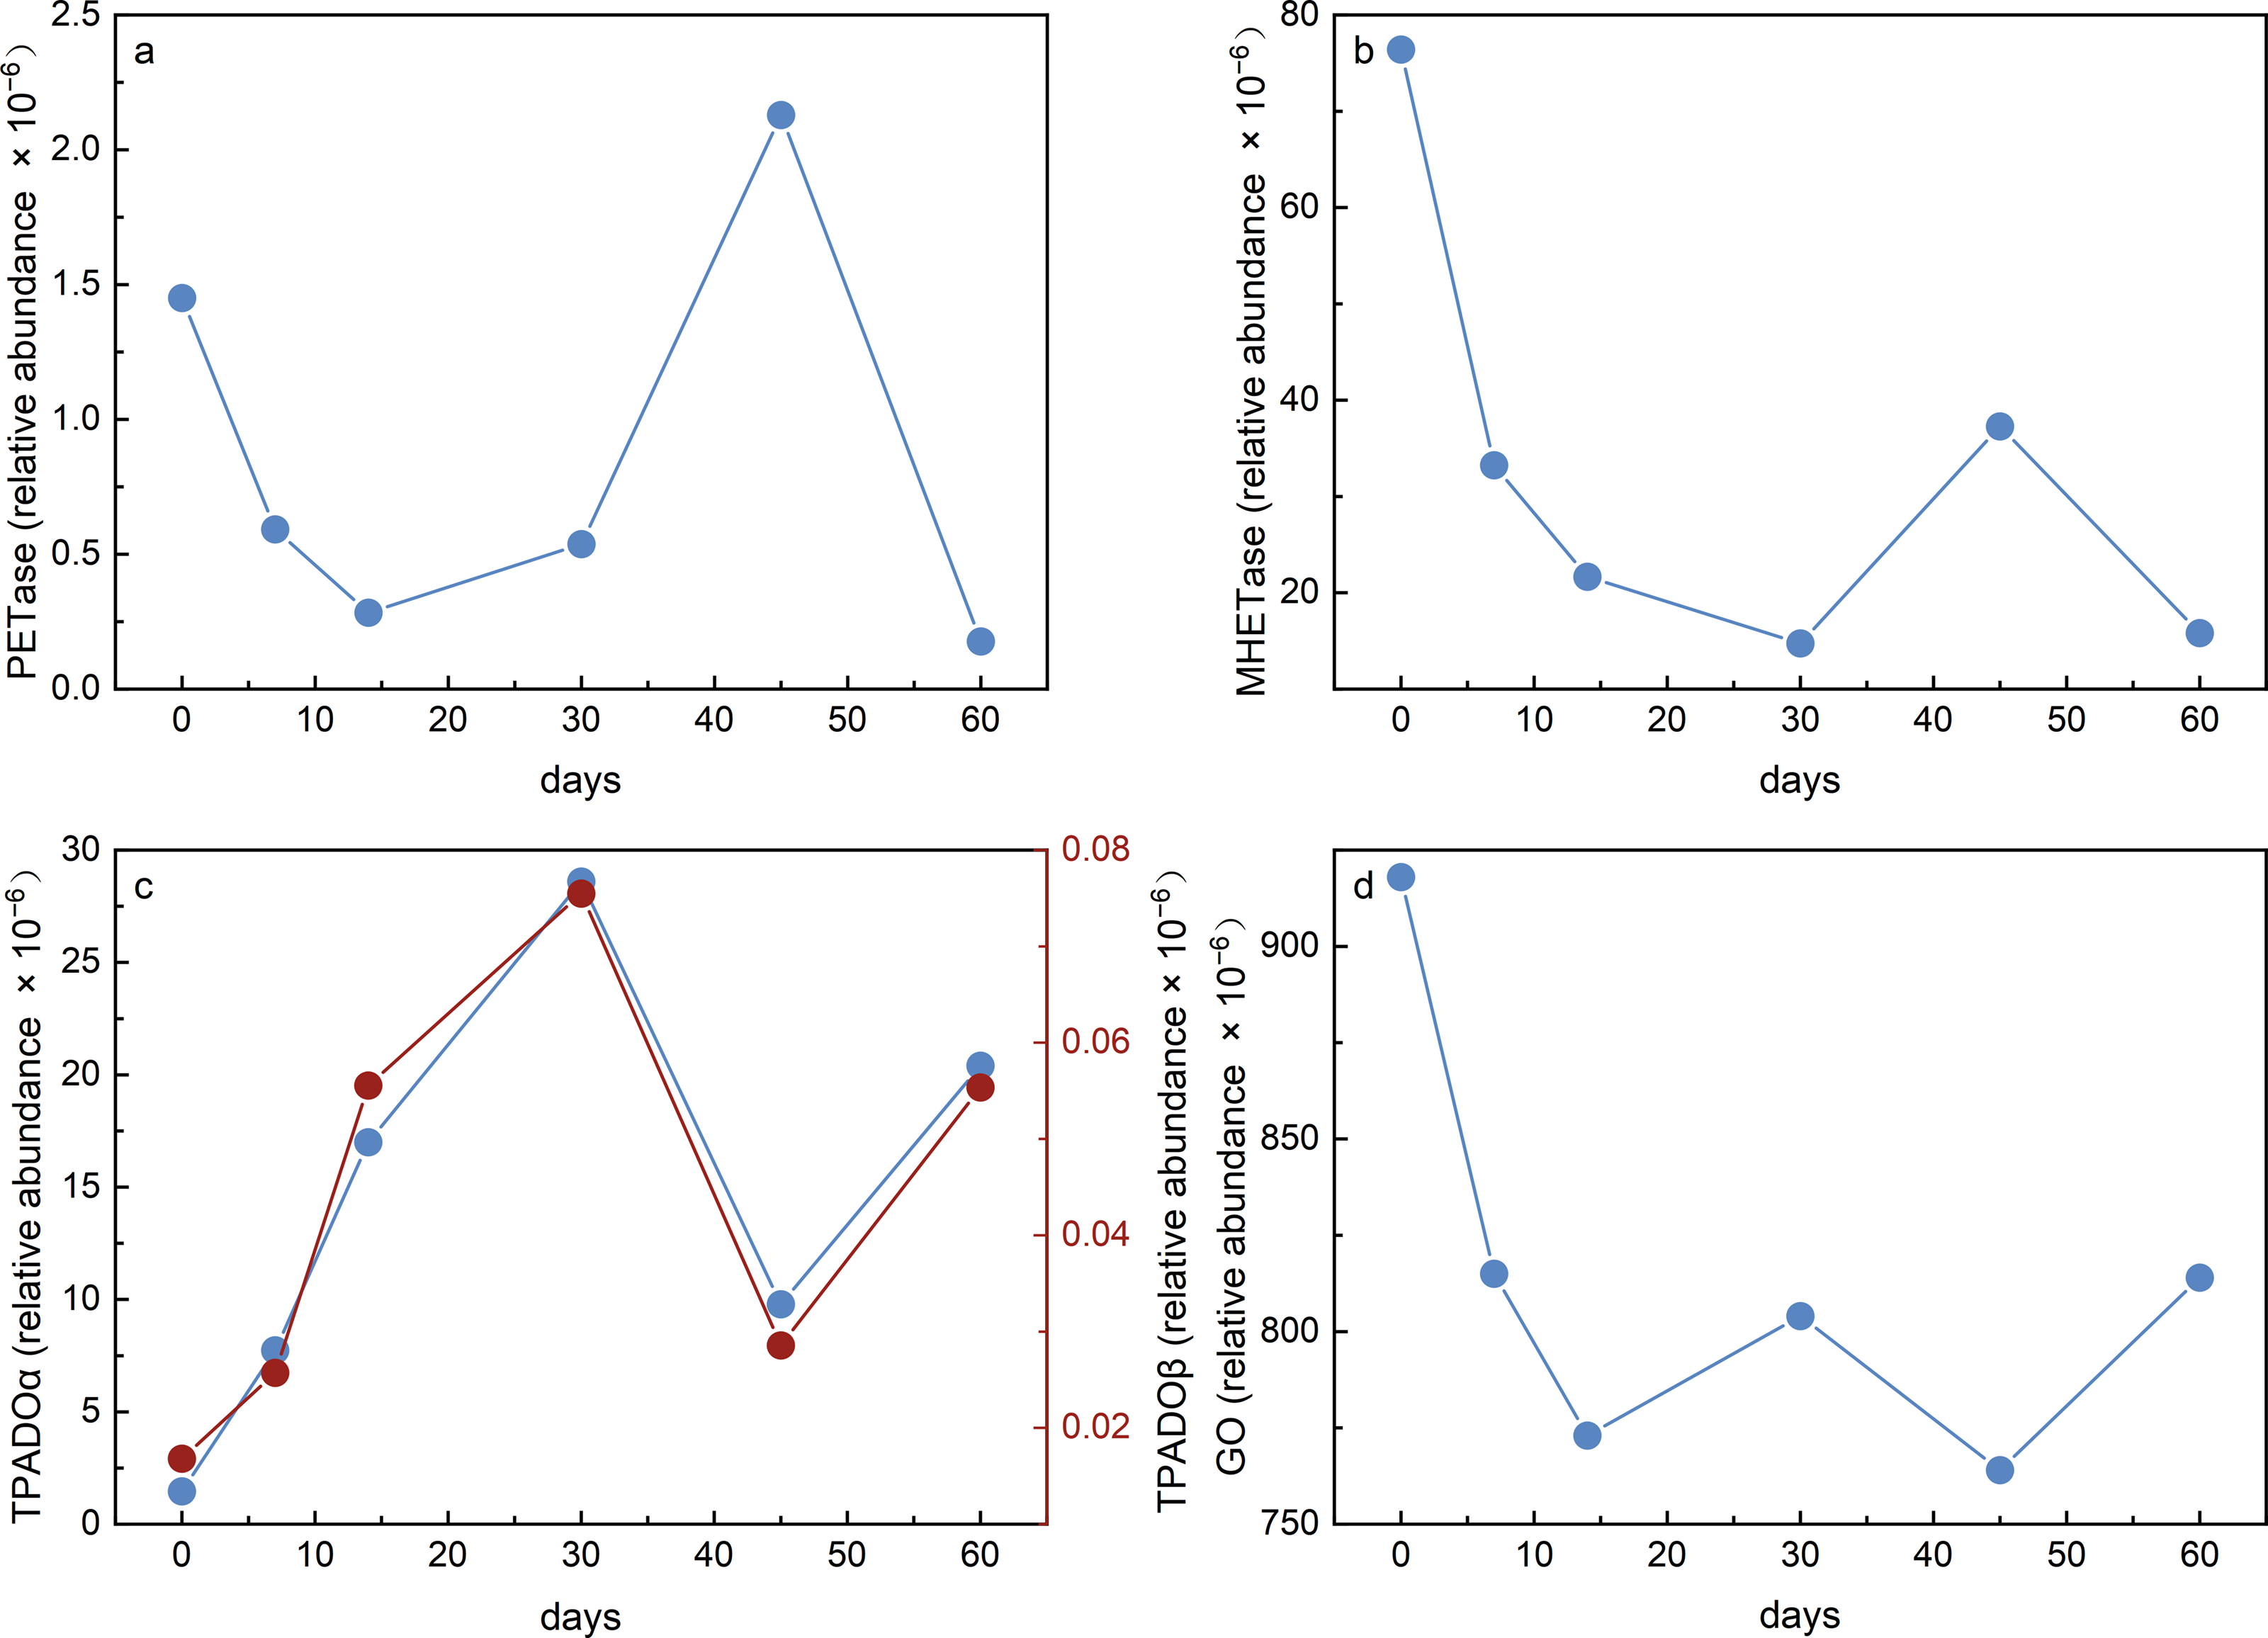
We did not detect any known microorganisms associated with plastic (PET) degradation (Carniel et al. Reference Carniel, Valoni, Junior, da Conceição Gomes and De Castro2017; Taniguchi et al. Reference Taniguchi, Yoshida, Hiraga, Miyamoto, Kimura and Oda2019; Wei and Zimmermann Reference Wei and Zimmermann2017). However, functional annotation based on Tax4Fun indicated the presence of genes encoding enzymes involved in the biodegradation of PET-derived compounds, including (1) poly (ethylene terephthalate) hydrolase, i.e. PETase; (2) mono (ethylene terephthalate) hydrolase, i.e. MHETase; (3) terephthalate 1,2-dioxygenase oxygenase component alpha subunit (TPADOα); (4) terephthalate 1,2-dioxygenase oxygenase component beta subunit (TPADOβ); (5) glycolate oxidase (GO). PET-derived oligomers can be enzymatically transformed into intermediates such as MHET and BHET, with MHET degraded into TPA and EG via MHETase (Müller et al. Reference Müller, Schrader, Profe, Dresler and Deckwer2005; Taniguchi et al. Reference Taniguchi, Yoshida, Hiraga, Miyamoto, Kimura and Oda2019). TPA is further degraded through terephthalate 1,2-dioxygenase (TPADO), ultimately generating CO2 and H2O through the tricarboxylic acid cycle (Kushwaha et al. Reference Kushwaha, Goswami, Singhvi and Kim2023; Mahto et al. Reference Mahto, Neetu, Sharma, Dubey, Vellanki and Kumar2022; Qi et al. Reference Qi, Yan, Cao, Ding and Yuan2021). The metabolic intermediate of EG, glycolate, undergoes oxidative decomposition catalyzed by GO. The relative abundances of the above-mentioned enzymes are shown in Figure 5.
The variations in the relative abundance of enzymes involved in the biodegradation of PET-derived compounds in C4 during the experimental period. C4: PET bottles + Room temperature.

The predicted occurrence of PETase and MHETase in the samples indicates the potential for PET biodegradation. However, given the intrinsically slow degradation rate of PET and the absence of detectable MHET, the results suggested that bulk PET biodegradation proceeded only at a very low rate. The relative abundance of PETase and MHETase showed a similar variation (Figure 5). In the early stage, both enzymes decreased due to the sealed and unsuitable environment. After 14 days, slow biodegradation of PET-derived compounds likely beagn, and PETase abundance began to increase. MHET, as an intermediate product, showed a delayed increase in the relative abundance compared to PETase. Consequently, after 30 days, the relative abundance of MHETase was observed to rise. The negative correlation between the relative abundances of TPA and TPADO was consistent with the role of TPADO in catalyzing TPA degradation, reflecting a typical substrate-enzyme consumption relationship. The relative abundance of GO was markedly higher than other enzymes involved in degradation, suggesting that the decomposition of EG is relatively active. The CO2 produced in this process may have been the primary source of contamination in the sample DIC. Notably, the relative abundance of TPADO exhibited a temporal pattern consistent with the Δ14CDIC values (Supplementary Figure S2), reinforcing the conclusion that the biodegradation of PET-derived compounds continued throughout the experimental period and significantly impacted the Δ14CDIC values. Therefore, the significant decreases of δ13CDIC and Δ14CDIC at day 30 can largely be attributed to the introduction of 14C-depleted carbon from PET bottles through simple leaching and the biodegradation of PET-derived compounds.
3.6. Storage effects and limitations in PET bottles
Under the PET bottle storage conditions examined in this study, temporal variations in chemical and isotopic indicators revealed that the biodegradation of PET-derived compounds and atmospheric CO2 exchange predominantly regulated the dynamic changes in the carbon isotopic compositions of DIC. The biodegradation of PET-derived compounds emerged as a key factor driving substantial deviations in both δ13CDIC and Δ14CDIC values (Figure 3).
Although HgCl2 addition effectively maintained the isotopic stability of δ13CDIC and Δ14CDIC values, its use as an antibacterial agent is not recommended due to extreme human toxicity and challenges in waste disposal (Argentino et al. Reference Argentino, Kalenitchenko, Lindgren and Panieri2023; Morel et al. Reference Morel, Kraepiel and Amyot1998; Takahashi et al. Reference Takahashi, Handa, Sugiyama, Matsushita, Kondo, Kimura and Tsujimura2019b). While refrigerated storage was comparable to HgCl2 addition in limiting shifts in δ13CDIC and Δ14CDIC over days, maximum deviations of δ13CDIC in C5 and C6 (1.3‰ and 1.4‰ from the initial value of −5.3‰, respectively) were substantial. These deviations may significantly affect the interpretation of the carbon isotopic compositions. Therefore, for the preservation of δ13CDIC samples, storing water samples in Exetainers preloaded with H3PO4 and flushed with helium gas, and kept at 4°C represent a well-established reference condition (Taipale and Sonninen Reference Taipale and Sonninen2009). This method, despite the potential for CO2 loss and carbon isotopic fractionation in pressurized containers, proved reliable for preserving consistent carbon isotopic compositions over six months. Notably, the variation range of Δ14CDIC values exhibited greater temporal stability under refrigeration (p>0.05) during 60 days, indicating that refrigeration can effectively constrain short-term Δ14CDIC alteration under PET bottles.
Beyond 110 days, river samples (excluding PET-affected C2 and C4) displayed significant 14C enrichment, indicating that atmospheric CO2 exchange dominated DIC system dynamics. In previous studies, the corresponding carbon isotopic fractionation was observed after approximately 180 days (Soto et al. Reference Soto, Araguás-Araguás, Han and Wassenaar2024), likely due to longer sampling intervals. Samples intended for long-term storage can be preserved in pre-evacuated glass serum bottles according to Soto et al. (Reference Soto, Araguás-Araguás, Han and Wassenaar2024). Our study provides experimental evidence supporting rational storage of samples for carbon isotopic measurements to ensure analytical accuracy and data availability.
4. Conclusions
The carbon isotopic compositions in sealed PET bottles were influenced by multiple interactive processes, including CO2 degassing, atmospheric CO2 exchange, external carbon contamination, biological activity, and carbonate dissolution-precipitation dynamics. Given the critical role of δ13CDIC and Δ14CDIC signatures in carbon source tracing, biogeochemical cycle elucidation, and groundwater age determination, our systematic evaluation of storage protocols provided a quantitative assessment of the extent to which storage-induced isotopic bias can be constrained under specific storage conditions and time scales.
At the end of the experiment, all samples had Δ14CDIC values lower than the initial value, with only C1 having δ13CDIC values higher than the initial value due to degassing caused by HgCl2 hydrolysis. The key findings demonstrated that PET-derived compounds, such as BHET and TPA, can significantly alter carbon isotopic compositions within the 60-day storage period. Meanwhile, the detection of functional enzymes involved in the degradation of PET-derived compounds in the samples provided evidence that these compounds undergo active microbial metabolism. HgCl2 addition and refrigeration during the 60-day experimental period substantially suppressed the biodegradation. Whether the samples were filtered or not had minimal effect on the Δ14CDIC values. The specific effects in different water types remain to be elucidated in further studies. The enrichment of Δ14CDIC observed at 110 days indicated that CO2 exchange between the storage container and the atmosphere became an important control on DIC isotopic evolution and should be carefully considered during long-term storage. By elucidating the processes governing δ13CDIC and Δ14CDIC alteration during storage, this study provides a mechanistic framework for evaluating storage-related uncertainty in carbon isotopic measurements.
Supplementary material
To view supplementary material for this article, please visit https://doi.org/10.1017/RDC.2026.10238
Acknowledgments
Funding for this study was provided by the National Natural Science Foundation of China (41930642; 42173013), the National Observation and Research Station, Institute of Geology, China Earthquake Administration (NORSCBS22-04), and the National Key Research and Development Program of China (2020YFA0607700). We are grateful to Ye Yang, Jiaxin Zhang, and Guangpei Zhong for field assistance.