


1 Introduction
The outbreak of the COVID-19 coronavirus in China has attracted extensive attention of many mathematicians working in the field of mathematical modelling. The first papers were already published in February–April 2020 (see, e.g., [Reference Brovchenko8, Reference Cherniha and Davydovych10, Reference Efimov and Ushirobira18, Reference Luo25, Reference Peng31, Reference Roda, Varugheseb, Han and Li34, Reference Shao36, Reference Tian38]). At the present time, the COVID-19 outbreak is already spread over the world as a pandemic. There were 83.8. mln. coronavirus cases and 1.8 mln. deaths caused by this coronavirus up to date 31 December [5].
Nowadays, there are many mathematical models used to describe epidemic processes and they can be found in any book devoted to mathematical models in biology and medicine (see, e.g., [Reference Brauer and Castillo-Chavez7, Reference Diekmann and Heesterbeek16, Reference Keeling and Rohani23, Reference Murray28] and papers cited therein). The paper [Reference Kermack and McKendrick24] is one of the first papers in this direction. The authors created a model based on three ordinary differential equations (ODEs), which nowadays is called the SIR model. There are several generalisations of the SIR model, and the SEIR model (see the pioneering works [Reference Anderson and May4, Reference Dietz17]), which involves four ODEs, is the most common among them. These two models are mostly used for numerical simulations in mathematical modelling for the COVID-19 outbreak (see, e.g., [Reference Brovchenko8, Reference Efimov and Ushirobira18, Reference Peng31, Reference Tian38]).
On the other hand, one may note that the spread of many epidemic processes, including the COVID-19 pandemic, is often highly non-homogenous in space. This fact can be taken into account in different ways, but the most common approach consists in dividing the large domain (say a country) into many small sub-domains (regions of the country) and applying the standard models based on ODEs to each sub-domain. However, there is another way when one uses the reaction–diffusion equations in order to model the spread of the infected population as a diffusion process [Reference Mammeri26, Reference Qiang, Wang and Wang33, 40] (see also earlier papers cited therein). A possible model was also suggested in our previous work [Reference Cherniha and Davydovych11]. The model has the form:
 \begin{equation}\begin{array}{l} u_t = d_1 \Delta u+u(a- bu^\gamma), \\[3pt] v_t = d_2\Delta u +k(t)u,\end{array}\end{equation}
where the lower subscript t means differentiation with respect to (w.r.t.) the time variable,
 $\Delta $
is the Laplace operator,
 $u=u(t,x,y)$
and
 $v=v(t,x,y)$
are two unknown functions, k(t) is the given smooth positive function,
 $d_1$
and
 $d_2$
are diffusivities, and
 $a, \ b$
and
 $\gamma$
are non-negative constants.
The function u(t,x,y) describes the density (rate) of the infected persons (the number of COVID-19 cases) in a vicinity of the point (x,y), while v(t,x,y) means the density of the deaths from COVID-19. The diffusion terms
 $d_1\Delta u$
and
 $d_2\Delta u$
describe the random movement of the infected persons, which cause acceleration of the pandemic spread on long distances. Formally speaking, one may take
 $d_1=d_2$
. However, we believe that
 $d_1>d_2$
because the movement of the infected persons leads firstly to higher rate of new COVID-19 cases but only some of them cause new deaths. Each coefficient in the reactions terms,
 $a, \ b, \ \gamma$
and k(t), has the meaning as described below.
The parameter a is defined as
 $a_0S$
, where
 $a_0<1$
is the infection rate and S is an average number of healthy persons, who was contacted by a fixed infected person (the so-called mechanism of the virus transmission). Obviously, each infected person can be in contact only with a limited number of people (usually it is relatives and close friends). The term
 $bu^{\gamma}$
has an opposite meaning to a, because one reflects the efforts B in order to avoid contacts with infected persons and to follow other restrictions introduced by the government. The coefficient B should increase with growing number of infected persons. In other words, the government and ordinary people should apply stronger measures in order to stop the increasing of the function u(t,x), otherwise the control on the epidemic process will be lost. Therefore, we assume that
 $B \approx bu^{1+\gamma}$
with
 $\gamma >0$
and the term
 $b u^{\gamma}$
(here
 $b>0$
) arises in (1.1). In the case
 $\gamma=1$
, the first equation in (1.1) is nothing else but the well-known Fisher equation. However, we have shown that
 $\gamma<1$
leads to the results, which better fit to the known data of COVID-19 cases in several countries during the first wave of this pandemic [Reference Cherniha and Davydovych11].
The coefficient
 $k(t)>0$
reflects the effectiveness of the health care system of the country (or a region) in question. From mathematical point of view, this coefficient should have the asymptotic behaviour
 $k(t)\to 0$
, if
 $ t \to \infty$
, otherwise all infected people will die. In particular, the useful form is
 $k(t)= k_0\exp(-\alpha t), \, \alpha>0 $
[Reference Cherniha and Davydovych11].
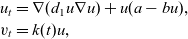
Of course, this model is an essential simplification because some factors causing the spread of COVID-19 are not taking into account. In paper [40], for example, the authors construct the diffusion model, which is essentially based on the SEIR model. As a result, their model consists of five partial differential equations (PDEs), which can be analysed only using numerical methods. Our idea was to construct a simpler model, which can be solved using analytical approaches, in particular, the Lie symmetry method [Reference Bluman, Cheviakov and Anco6, Reference Cherniha, Serov and Pliukhin14, Reference Ovsiannikov30] and to show its applicability for the spread of the coronavirus pandemic. It is interesting to note that equations (3) and (5) in the model developed in [40] produce a modification of our model (1.1). In fact, the density of infected population is proportional to that of the total living population and is proportional to the exposed population density (generally speaking, the relevant coefficients are some functions but we may keep constants). Having such assumptions, one arrives at the system (in our notations):
 \begin{equation}\begin{array}{l} u_t = \nabla(d_1 u \nabla u)+u(a- bu), \\v_t = k(t)u,\end{array}\end{equation}
The difference between (1.1) with
 $\gamma=1 $
and (1.2) consists only in the diffusion terms. In our model, the diffusivity is taking to be a constant, while one is a linear function in paper [40]. Notably, the diffusivities are some constants in [Reference Qiang, Wang and Wang33] while those are time-dependent functions in [Reference Mammeri26].
The remainder of this paper is organised as follows. In Section 2, a complete Lie symmetry classification (LSC) (another useful terminology is ‘group classification’) of system (1.1) is derived. In particular, we have proved that there are systems with the correctly specified parameters
 $d_1, \ d_2, \ a$
and
 $ \gamma$
when the system in question admits highly non-trivial Lie symmetry, which have no analogues for other known reaction–diffusion systems. The results were obtained using the Lie–Ovsiannikov method [Reference Ovsiannikov30], which is a combination of the classical Lie method and the known technique for finding equivalence transformations (ETs). The modern description of this method, its extension and applications can be found in [Reference Cherniha, Serov and Pliukhin14] (Chapter 2).
In Section 3, exact solutions of a specified system of the form (1.1) are constructed using its Lie symmetry operators. In particular, the travelling wave type solution is derived and its applicability is extensively discussed. It is shown that this exact solution describes adequately the spread of the coronavirus pandemic provided the 1D approximation in space is assumed. Finally, we discuss the main results of the paper in the last section.
2 Main results
In this section, it is identified that the basic system (1.1) for the pandemic modelling possesses a very reach Lie symmetry depending on the parameters
 $a, \ \gamma, \ d_1$
and
 $d_2$
and the function k(t). First of all, we note that for the LSC, we need only the restrictions
 $d_1^2+d_2^2\neq0$
(otherwise, the system in question degenerates into the ODE system, which was solved in [Reference Cherniha and Davydovych11]),
 $k\neq0$
(otherwise, the system in question seems to be useless for applications) and
 $b\neq0$
and
 $\gamma\neq0,-1$
(otherwise, the system in question is linear, hence is also integrable).
First of all, we present a statement about the group of ETs of system (1.1). For this purpose, we apply the technique, which was developed in [Reference Akhatov, Gazizov and Ibragimov3, Reference Ibragimov, Torrisi and Valenti21] (see also Section 2.3 in [Reference Cherniha, Serov and Pliukhin14]).
Theorem 2.1 The group of the continuous ETs’ transforming system (1.1) to that with the same structure, that is,
 \begin{equation}\begin{array}{l} \overline{u}_{\overline{t}} = \overline{d_1} \Delta \overline{u}+\overline{u}(\overline{a}- \overline{b}\overline{u}^{\overline{\gamma}}), \\[2pt] \overline{v}_{\overline{t}} = \overline{d_2}\Delta \overline{u} +\overline{k}(\overline{t})\overline{u},\end{array}\end{equation}
is the infinite parameter Lie group generated by the transformations:
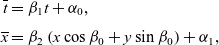 \begin{align*} \overline{t} &=\beta_1t+\alpha_0, \nonumber\\[2pt] \overline{x} &=\beta_2\left(x\cos \beta_0 +y\sin \beta_0\right)+\alpha_1, \nonumber\end{align*}
 \begin{align}\nonumber\\[-35pt]\overline{y}&=\beta_2\left(y\cos \beta_0 -x\sin \beta_0\right)+\alpha_2, \nonumber\\[2pt] \overline{u}&=\beta_3u, \ \overline{v}=\beta_4v+f(x,y), \nonumber\\[2pt] \overline{k}&=\frac{\beta_4}{\beta_1\beta_3}\,k, \ \overline{d_1}=\frac{\beta^2_2}{\beta_1}\,d_1, \ \overline{d_2}=\frac{\beta^2_2\beta_4}{\beta_1\beta_3}\,d_2, \ \overline{a}=\frac{a}{\beta_1}, \ \overline{b}=\frac{b}{\beta_1\beta_3^\gamma}, \ \overline{\gamma}=\gamma. \end{align}
Here,
 $\alpha_i\ (i=0,1,2)$
and
 $\beta_j \ (j=0,\dots,4)$
are the real group parameters with the restrictions
 $\beta_1\beta_2\beta_4\neq0, \ \beta_3>0,$
and f(x,y) is an arbitrary smooth function.
Remark 2.1 In order to obtain system (2.1) with the non-negative parameters (this is the biologically motivated requirement explained above), the additional restrictions
 $\beta_1>0$
and
 $\beta_4>0$
should take place.
Sketch of Proof of Theorem 2.1 is based on the known technique for constructing the group of ETs. It is nothing else but a modification of the classical Lie method. In the case of system (1.1), one should start from the infinitesimal operator:
 \begin{align}E&=\xi^0(t,x,y,u,v)\partial_t+\xi^1(t,x,y,u,v)\partial_x+\xi^2(t,x,y,u,v)\partial_y+\eta^1(t, x,y,u,v)\partial_u\nonumber\\[3pt] &\quad +\eta^2(t, x,y,u,v)\partial_v+\zeta(t,x,y,u,v,k)\partial_k+\mu^1\partial_{d_1}+\mu^2\partial_{d_2}+\mu^3\partial_{a}+\mu^4\partial_{b}+\mu^5\partial_{\gamma}, \end{align}
being
 $\xi^0, \ \xi^1, \ \xi^2, \ \eta^1,\ \eta^2 \ $
and
 $\zeta$
to-be-determined functions, while
 $\mu^i \ (i=1,\dots,5)$
to-be-determined constants. The operator E involves the additional terms with the coefficients
 $\mu^i$
and
 $\zeta$
, because
 $d_1, \ d_2, \ a, \ b, \ \gamma$
and k(t) should be treated as new variables.
In order to find the operator E, we should apply Lie’s invariance criteria to the system of equations consisting of (1.1) and a set of differential consequences of k(t) w.r.t. the variables t, x, y, u and v. Of course, each consequence is equal to zero, excepting
 $\frac{\partial k}{\partial t}=k'(t)$
(the latter is not useful because it is identity). As a result, we obtain a multicomponent system consisting of equations from (1.1) and primitive equations like
 $\frac{\partial k}{\partial x}= 0$
. Applying to this system the Lie’s invariance criteria, that is, the second prolongation of the infinitesimal operator E, for deriving the system of determining equations, the coefficients
 $\xi^{0},\ \xi^{1},\ \xi^{2},\ \eta^1, \eta^2, \ \zeta$
and
 $\mu^i \ (i=1,\dots,5)$
were found. They have the form:
 \begin{equation}\begin{array}{l}\xi^0=C_1t+C_2, \ \xi^1=C_3x+C_4y+C_5, \\[3pt]\xi^2=C_3y-C_4x+C_6, \\[3pt]\eta^1=C_7u, \ \eta^2=C_8v+h(x,y),\ \zeta=\left(C_8-C_1-C_7\right)k, \ \mu^1=\left(2C_3-C_1\right)d_1, \\[3pt] \mu^2=\left(2C_3-C_1+C_8-C_7\right)d_2,\\[3pt] \mu^3=-C_1a,\ \mu^4=-\left(C_1+C_7\gamma\right)b,\ \mu^5=0,\end{array} \end{equation}
where
 $C_i, \ i=1,\dots,8$
are arbitrary constants and h(x,y) is an arbitrary smooth function. The operator (2.3) with the coefficients (2.4) generates the Lie group (2.2).
The sketch of the proof is now completed.
In order to provide a complete LSC of system (1.1), one should identify the principal algebra of invariance (see definition, for example, in [Reference Cherniha, Serov and Pliukhin14], page 23) from the very beginning. In fact, system (1.1) involves an arbitrary function k and several parameters (some of them can vanish). Thus, it should be considered as a class of systems of PDEs, if one is going to provide a rigorous LSC.
Theorem 2.2 The principal algebra of invariance of system (1.1) is infinite-dimensional Lie algebra generated by the operators:
 \begin{equation} \partial_x, \ \partial_y, \ y\,\partial_x-x\,\partial_y,\ F(x,y)\,\partial_v,\end{equation}
where F(x,y) is an arbitrary smooth function.
The proof of this statement can be derived in different two ways. The direct approach consists of application of the classical Lie method to the system (1.1), assuming that all parameters are arbitrary. The second way is useful if the group of ETs is known. So, having Theorem 1, we simply calculate when transformations (2.2) transform (1.1) in itself, that is, system (2.1) coincides with (1.1). The result immediately leads to formulae (2.5).
Now we present two main theorems, which completely solve the LSC problem for (1.1). It turns out that there are two essentially different cases,
 $d_1\neq0$
and
 $d_1=0$
, leading to absolutely different results.
Theorem 2.3 System (1.1) with
 $d_1\neq0$
admits the extension of the principal algebra (2.5) only in five cases. These cases and the corresponding Lie symmetry operators are as follows”
-
(1)
 $k(t)=1$
:
$\partial_t$
;
-
(2)
$a=0, \ k(t)=\frac{1}{t}$
:
$2t\,\partial_t+x\,\partial_x+y\,\partial_y-\frac{2}{\gamma}\left(u\partial_u+v\partial_v\right)$
; -
(3)
$a=0, \ d_2=0, \ k(t)=t^p, \ p\neq-1,0$
:
$2t\partial_t+x\,\partial_x+y\,\partial_y-\frac{2}{\gamma}\left(u\partial_u+(1-\gamma p-\gamma)v\partial_v\right);$
-
(4)
$d_2=0, \ k(t)=e^{pt}, \ p\neq0$
:
$\partial_t+pv\partial_v$
; -
(5)
$a=0,\ d_2=0, \ k(t)=1$
:
$\partial_t,$
$2t\partial_t+x\,\partial_x+y\,\partial_y-\frac{2}{\gamma}\left(u\partial_u+(1-\gamma)v\partial_v\right)$
.


Here, p is an arbitrary constant.
Any other system (1.1) with
 $d_1\neq0$
admitting an extension of the principal algebra (2.5) is reduced by an ET from (2.2) to one of the listed in cases (1)–(5).
Remark 2.2 Using the simple ET from (2.2), one can set
 $k_0k(t)$
(
 $k_0$
is an arbitrary constant) instead of k(t) in each case of Theorem 2.3 without any changes in Lie symmetry operators. It is useful from the applicability point of view.
Remark 2.3 As it follows from Theorem 2.3, there are only three different forms of the function k(t) leading to the extensions of the principal algebra: 1,
 $t^p$
and
 $e^{pt}$
(the case
 $\frac{1}{t}$
is a subcase of
 $t^p$
). The function k(t) reflects the effectiveness of the health care system. Thus, the form
 $k(t)=1$
is rather unrealistic because the condition
 $k(t)\to 0$
, if
 $ t \to \infty$
is not satisfied, that is, all infected people will die (see the second equation in (1.1)). Two other forms are realistic that provided the exponent
 $p<0$
.
Theorem 2.4 System (1.1) with
 $d_1=0$
(then automatically
 $d_2\neq0$
) admits the extension of the principal algebra (2.5) only in four cases. In each case, the additional operators have the structure:
 \begin{align} X&=\xi^0(t,u)\,\partial_t+\xi^1(x,y)\,\partial_x+\xi^2(x,y)\,\partial_y+\eta^1(t,u)\,\partial_u\nonumber\\[3pt] &\quad +\left(G(t,x,y,u)+(\xi^0_t-2\xi^1_x+\eta^1_u)v\right)\partial_v,\end{align}
where the functions
 $\xi^1$
and
 $\xi^2$
form an arbitrary solution of the famous Cauchy–Riemann system:
 \begin{equation} \xi^1_x=\xi^2_y, \ \xi^1_y=-\xi^2_x, \end{equation}
and G is an arbitrary solution of the linear first-order PDE
 \begin{equation}G_t+u(a- bu^\gamma)G_u=k(t)\left(\eta^1+2u\xi^1_x-u\eta^1_{u}\right)+uk'(t)\xi^0+u^2k(t)\left(a- bu^\gamma\right)\xi^0_u.\end{equation}
In the operator X, the functions
 $\xi^0$
and
 $\eta^1$
depending on the parameters
 $\gamma$
and a have the forms :
-
(1) if
$\gamma\neq1$
and
$a\neq0$
then
\begin{equation*}\xi^0=\alpha_1+\frac{\alpha_2e^{at}}{au}\left(a-a\gamma+b\gamma u^\gamma\right)\left(a-bu^\gamma\right)^{-1+\frac{1}{\gamma}}, \ \eta^1=\alpha_2e^{at}\left(a-bu^\gamma\right)^{\frac{1}{\gamma}};\end{equation*}
-
(2) if
$\gamma\neq1$
and
$a=0$
then
\begin{equation*}\xi^0=\alpha_1-\gamma\alpha_2t, \ \eta^1=\alpha_2u;\end{equation*}
-
(3) if
$\gamma=1$
and
$a\neq0$
then
\begin{eqnarray} \nonumber && \xi^0=\frac{a\,\omega^2F''(\omega)}{u(a-bu)}+\frac{2b\,\omega F'(\omega)}{a-bu}-\frac{2bF(\omega)}{a}, \\[3pt] \nonumber &&\eta^1=a\,\omega^2F''(\omega)+2bu\,\omega F'(\omega),\ \omega=\frac{a-bu}{u}\,e^{at};\end{eqnarray}
-
(4) if
$\gamma=1$
and
$a=0$
then Here
\begin{eqnarray} \nonumber && \xi^0=\frac{F''(\omega)}{2bu^2}-\frac{F'(\omega)}{bu}+\frac{F(\omega)}{b}, \\[3pt] \nonumber &&\eta^1=-\frac{F''(\omega)}{2}+uF'(\omega),\ \omega=\frac{1}{u}-bt.\end{eqnarray}
$\alpha_1$
and
$\alpha_2$
are arbitrary parameters, while F is an arbitrary smooth function.


Proofs of Theorems 2.3 and 2.4 are based on the technique which is a combination of the classical Lie method and the group of ETs. This technique is often called the Lie–Ovsiannikov method because L.V. Ovsyannikov was the first person who applied such technique for solving the LSC problem (group classification problem) for a class of the non-linear heat equations [Reference Ovsiannikov30]. Here, we present the proof of Theorems 2.4 because that is more complicated compared with the proof of Theorem 2.3.
Proof of Theorem 2.4.
System (1.1) with
 $d_1=0, \ d_2\neq0$
can be rewritten as:
 \begin{equation}\begin{array}{l} u_t = u(a- bu^\gamma), \\[3pt] v_t = \Delta u +k(t)u.\end{array}\end{equation}
using an appropriate ET from (2.2). As usually, we start from the most general form of a Lie symmetry operator:
 \begin{equation} \begin{array}{l} X=\xi^0(t,x,y,u,v)\,\partial_t+\xi^1(t,x,y,u,v)\,\partial_x+\xi^2(t,x,y,u,v)\,\partial_y\\[3pt] \hskip1.5cm +\eta^1(t,x,y,u,v)\,\partial_u+\eta^2(t,x,y,u,v)\partial_v.\end{array}\end{equation}
In order to find all the Lie symmetry operators of the form (2.10) of system (2.9), one should apply the following invariance criterion :
 \begin{equation}\begin{array}{l}X_{1}\left(u_t - u(a- bu^\gamma)\right)\Big\vert_{{\mathcal{M}}} =0, \\[3pt] X_{2} \left(v_t-\Delta u -k(t)u\right)\Big\vert_{{\mathcal{M}}} =0,\end{array} \end{equation}
where operators
 $X_{1}$
and
 $X_{2}$
are the first and second prolongations of the operator X, and the manifold
 ${\mathcal{M}}$
is defined by the system of equations:
 \begin{eqnarray} \nonumber && u_t = u(a- bu^\gamma), \ v_t = \Delta u +k(t)u, \\[3pt] && \nonumber u_{tt} = \left(a- b(\gamma+1)u^\gamma\right)u_t, \ u_{tx} = \left(a- b(\gamma+1)u^\gamma\right)u_x,\ u_{ty} = \left(a- b(\gamma+1)u^\gamma\right)u_y.\end{eqnarray}
It should be stressed that the manifold
 ${\mathcal{M}}$
involves not only the equations of the system in question but also the first-order consequences of the first equation of (2.9). These consequences guarantee a complete solving of the LSC problem. Notably, such peculiarity does not occur for scalar PDEs, but one was noted for some systems of PDEs involving equations of different order (see, e.g., the relevant discussion in [Reference Bluman, Cheviakov and Anco6] Section 1.2.5).
Having the correctly defined manifold
 ${\mathcal{M}}$
, the invariance criterion (2.11) after rather standard calculations leads to the system of determining equations as follows:
 \begin{eqnarray} && \xi^0_{x}=\xi^0_{y}=\xi^0_{v}=0, \ \xi^1_{t}=\xi^1_{u}=\xi^1_{v}=0, \ \xi^2_{t}=\xi^2_{u}=\xi^2_{v}=0, \end{eqnarray}
 \begin{eqnarray} && \eta^1_x=\eta^1_y=\eta^1_v=0, \ \eta^2_v=\xi^0_t-2\xi^1_x+\eta^1_u, \end{eqnarray}
 \begin{eqnarray} && \xi^1_x=\xi^2_y, \ \xi^1_y=-\xi^2_x, \end{eqnarray}
 \begin{eqnarray} &&\eta^1_{uu}=2\left(a-b\left(1+\gamma\right)u^\gamma\right)\xi^0_u+u\left(a- bu^\gamma\right)\xi^0_{uu},\end{eqnarray}
 \begin{eqnarray} &&\eta^1_{t}=\left(a-b\left(1+\gamma\right)u^\gamma\right)\,\eta^1+u^2\left(a- bu^\gamma\right)^2\xi^0_u+u\left(a- bu^\gamma\right)\left(\xi^0_t-\eta^1_{u}\right),\end{eqnarray}
 \begin{eqnarray} && \eta^2_t+u\left(a- bu^\gamma\right)\eta^2_u=k(t)\left(\eta^1+2u\xi^1_x-u\eta^1_{u}\right)\nonumber\\[3pt] && +uk'(t)\xi^0+u^2k(t)\left(a- bu^\gamma\right)\xi^0_u. \end{eqnarray}
Equations (2.12) and (2.13) can be easily integrated; hence, the general form of the infinitesimal operator (2.10) can be specified as (2.6). Now substituting the function:
 \begin{equation*}\eta^2=G(t,x,y,u)+\left(\xi^0_t-2\xi^1_x+\eta^1_u\right)v,\end{equation*}
into equation (2.17) and splitting the equation obtained w.r.t. the variable v, we arrive at the linear equation (2.8) for G(t,x,y,u) and the equation:
 \begin{equation}u\left(a- bu^\gamma\right)\xi^0_{tu}+\xi^0_{tt}+u\left(a- bu^\gamma\right)\eta^1_{uu}+\eta^1_{tu}=0.\end{equation}
Obviously, equations (2.14) coincide with (2.7).
Thus, we need only to solve the overdetermined system of equations (2.15), (2.16) and (2.18) w.r.t. the functions
 $\xi^0$
and
 $\eta^1$
. This is a non-trivial task because the function
 $\xi^0$
depends on the dependent variable u in contrast to the standard situation for the systems of reaction–diffusion equations (see [Reference Cherniha, Davydovych and Muzyka12, Reference Cherniha and King13] and the papers cited therein). Differentiating equation (2.15) w.r.t. t, taking the second-order consequence of equation (2.16) w.r.t. u and making the relevant calculations, we were able to derive the simple relation:
 \begin{equation} \xi^0_{t}=\frac{\left(1-\gamma\right)\eta^1-u\eta^1_u}{u}.\end{equation}
Substituting the derivatives
 $\xi^0_{tu}$
and
 $\xi^0_{tt}$
derived from (2.19) into equation (2.18), one arrives at the classification equation:
 \begin{equation*}(1-\gamma)\Big(u(a-bu^\gamma)\eta^1_{u}-u^2(a- bu^\gamma)^2\xi^0_u+(a\gamma-a+bu^\gamma)\eta^1\Big)=0.\end{equation*}
Thus, the following two cases must be examined separately :
 $\gamma\neq1$
and
 $\gamma=1.$
In the case
 $\gamma\neq1$
, one immediately obtains
 \begin{equation} \eta^1_{u}=u\left(a- bu^\gamma\right)\xi^0_u+\frac{\left(a-a\gamma-bu^\gamma\right)\eta^1}{u\left(a-bu^\gamma\right)}.\end{equation}
Differentiating equation (2.20) w.r.t. the variable u and substituting the expression obtained for
 $\eta^1_{uu}$
into equation (2.15), one arrives at the equation:
 \begin{equation} \xi^0_{u}=\frac{a\left(\gamma-1\right)\eta^1}{u^2\left(a-bu^\gamma\right)^2}.\end{equation}
Equations (2.20) and (2.21) can be easily integrated. The general solutions are
 \begin{equation}\xi^0=g(t)+\frac{f(t)}{au}\left(a-a\gamma+b\gamma u^\gamma\right)\left(a-bu^\gamma\right)^{-1+\frac{1}{\gamma}}, \ \eta^1=\left(a-bu^\gamma\right)^{\frac{1}{\gamma}}f(t),\end{equation}
if
 $a\neq0$
and
 \begin{equation}\xi^0=g(t), \ \eta^1=f(t)u, \end{equation}
if
 $a=0$
. Here, f(t) and g(t) are arbitrary smooth functions at the moment. In order to find the functions f(t) and g(t), one needs to substitute (2.22) and (2.23) into equation (2.16). As a result, cases
 ${(1)}$
and
 ${(2)}$
of Theorem 2.4 were identified.
In the case
 $\gamma=1$
, equations (2.15), (2.16) and (2.19) take the forms:
 \begin{equation}\begin{array}{l} \xi^0_t=-\eta^1_{u}, \\ \xi^0_{tu}+u(a- bu)\xi^0_{uu}+2(a-2bu)\xi^0_u=0,\\ \eta^1_{t}+2u(a- bu)\eta^1_{u}=(a-2bu)\,\eta^1+u^2(a-bu)^2\xi^0_u,\end{array}\end{equation}
while equation (2.18) is satisfied identically.
Now, one can isolate
 $\xi^0_u$
from the third equation of (2.24) :
 \begin{equation}\xi^0_u=\frac{\eta^1_{t}}{u^2(a-bu)^2}+\frac{2\eta^1_{u}}{u(a-bu)}+\frac{(2bu-a)\eta^1}{u^2(a-bu)^2}.\end{equation}
Substituting (2.25) into the second equation of (2.24) and the equation
 $\xi^0_{tu}+\eta^1_{uu}=0$
(i.e., the differential consequence of the first equation of (2.24) w.r.t. the variable u), we arrive at the equations:
 \begin{equation}\eta^1_{tu}+u(a-bu)\eta^1_{uu}+(a-2bu)\eta^1_u+2b\eta^1=0,\end{equation}
and
 \begin{equation}\eta^1_{tt}+2u(a-bu)\eta^1_{tu}+u^2(a-bu)^2\eta^1_{uu}+(2bu-a)\eta^1_t=0,\end{equation}
respectively.
It turns out that equation (2.27) is reduced to the ODEs w.r.t. the time variable:
 \begin{equation*}\eta_{tt}+\left(a-\dfrac{2a\omega}{\omega+be^{at}}\right)\eta_{t}=0,\end{equation*}
and
 \begin{equation*}(\omega+bt)\eta_{tt}+2b\,\eta_{t}=0,\end{equation*}
by the transformation:
 \begin{equation*}\eta^1(t,u)=\eta(t,\omega), \ \omega=\left\{\begin{array}{l} \dfrac{a-bu}{u}\,e^{at}, \ a\neq0, \\ \dfrac{1}{u}-bt, \ a=0,\end{array} \right.\end{equation*}
in the cases
 $a\neq0$
and
 $a=0$
, respectively.
Integrating the above ODEs, we easily derive the general solution, that is, the function:
 \begin{equation*}\eta^1=uH_1(\omega)+H_2(\omega), \ \omega=\left\{\begin{array}{l} \dfrac{a-bu}{u}\,e^{at}, \ a\neq0, \\ \dfrac{1}{u}-bt, \ a=0,\end{array} \right.\end{equation*}
where
 $H_1$
and
 $H_2$
are arbitrary smooth functions at the moment. Substituting the above function into (2.26), we arrive at the restriction:
 \begin{equation*}H_2=\left\{\begin{array}{l} \dfrac{a}{2b}\left(\omega H_1'-H_1\right), \ a\neq0, \\ -\dfrac{H_1'}{2}, \ a=0.\end{array} \right.\end{equation*}
Thus, using notations
 $H_1=2b\omega F'$
(in the case
 $a\neq0$
) and
 $H_1=F'$
(in the case
 $a=0$
), one finds the function
 $\xi^0$
from the first equation of system (2.24)
 \begin{equation*}\xi^0=\left\{\begin{array}{l}\dfrac{a\,\omega^2F''(\omega)}{u(a-bu)}+\dfrac{2b\,\omega F'(\omega)}{a-bu}-\dfrac{2bF(\omega)}{a}+g(u), \ a\neq0, \\ \dfrac{F''(\omega)}{2bu^2}-\dfrac{F'(\omega)}{bu}+\dfrac{F(\omega)}{b}+g(u), \ a=0,\end{array} \right.\end{equation*}
where g(u) is to-be-determined function.
Substituting the functions
 $\xi^0$
and
 $\eta^1$
into equation (2.25), we obtain
 $g(u)=const$
. As a result, cases
 ${(3)}$
and
 ${(4)}$
of Theorem 2.4 are derived.
At the final stage, the functions,
 $\xi^0$
and
 $\eta^1$
, should be inserted into (2.8). The equation obtained is an integrable first-order PDE and its general solution is easily constructed in an explicit form provided that the function k(t) is given. Thus, all the coefficients of operator (2.6) are identified.
The proof is now complete.
Let us present examples of highly non-trivial Lie symmetries in cases
 ${(3)}$
and
 ${(4)}$
(see Theorem 2.4). Setting
 $F(\omega)=\omega^3$
, one can specify the functions
 $\xi^0$
and
 $\eta^1$
as follows:
 \begin{equation*} \xi^0=\frac{2}{au^{4}}\left(3a^2+2abu+b^2u^2\right)(a-bu)^2e^{3at}, \ \eta^1=\frac{6}{ u^{3}}(a+bu)(a-bu)^3e^{3at},\end{equation*}
and
 \begin{equation*} \xi^0=\frac{1}{bu^3}-b^2t^3,\ \eta^1=3bt\left(btu-1\right),\end{equation*}
in cases
 ${(3)}$
and
 ${(4)}$
, respectively.
Now one should use the functions
 $\xi^0$
and
 $\eta^1$
for finding the function G from equation (2.8). In order to avoid cumbersome formulae, we additionally take the particular solution
 $\xi^1=y, \ \xi^2=-x$
of the Cauchy–Riemann system (2.7) and fix the function k(t) :
 $k(t)=e^{-3at}$
(case
 ${3)}$
) and
 $k(t)=t^{-2}$
(case
 ${4)}$
). As a result, one arrives at the Lie symmetry operators:
 \begin{align} X&= \frac{2}{au^{4}}\,\big(3a^2+2abu+b^2u^2\big)(a-bu)^2e^{3at}\partial_t+\frac{6}{ u^{3}}(a+bu)(a-bu)^3e^{3at}\partial_u \nonumber\\[3pt] &\quad +y\partial_x-x\partial_y +\Big(6b^3\ln u+\frac{3}{u^3}(a-bu)(2a^2-abu+b^2u^2)+H\left(x,y,\frac{a-bu}{u}\,e^{at}\right)\Big)\partial_v,\end{align}
and
 \begin{equation}\begin{array}{l} X=\left(\frac{1}{bu^3}-b^2t^3\right)\partial_t+y\partial_x-x\partial_y+3bt\left(btu-1\right)\partial_u\\[3pt]\qquad +\Big(-2b\ln (tu)+\frac{1-btu}{bt^2u^2}+H\left(x,y,\frac{1}{u}-bt\right)\Big)\partial_v\end{array},\end{equation}
in cases
 $\textit{(3)}$
and
 $\textit{(4)}$
, respectively. Here H is an arbitrary smooth function.
3 Exact solutions and their interpretation
Theorems 2.3 and 2.4 allow us to reduce the basic system (1.1) to that of lower dimensionality. In fact, using the Lie symmetry operators (or their linear combinations) listed in Theorems 2.3 and 2.4, one can reduce (1.1) to the corresponding
 $(1+1)$
-dimensional system and the latter to an ODE system. Here, we examine two cases in order to show that those lead to useful exact solutions.
First of all, one may simplify the non-linear system (1.1) using the ETs (2.2) with the correctly specified parameters:
 \begin{eqnarray} \nonumber && \overline{t} =at,\ \overline{x}=\sqrt{\frac{a}{d_1}}\, x, \ \overline{y}=\sqrt{\frac{a}{d_1}}\, y,\\[3pt] \nonumber &&\overline{u}=\left(\frac{b}{a}\right)^{1/\gamma}u, \ \overline{v}=\left(\frac{b}{a}\right)^{1/\gamma}v,\end{eqnarray}
to the form:
 \begin{equation}\begin{array}{l} u_t = \Delta u+u(1- u^\gamma), \\[3pt] v_t = D \Delta u +\frac{1}{a}\,k\left(\frac{t}{a}\right)u, \ D=\frac{d_2}{d_1}. \end{array}\end{equation}
Here and in what follows, we preserve the old notations for all the variables.
Example 3.1. Let us apply the operator
 $\partial_y$
from the principal algebra (2.5) for reduction of the basic system (3.1). Obviously, this operator produces the trivial ansatz
 $u=u(t,x), \ v=v(t,x)$
, so that we arrive at the system:
 \begin{equation}\begin{array}{l} u_t = u_{xx}+u(1- u^\gamma), \\[3pt] v_t = D u_{xx} +\frac{1}{a}\,k\left(\frac{t}{a}\right)u, \ D=\frac{d_2}{d_1}. \end{array}\end{equation}
This system is nothing else but the initial system under the assumption that the distribution of the infected persons is one-dimensional in space (i.e., the diffusion w.r.t. the axis y is very small). In this case, the distribution of the total number of deaths will be also one-dimensional.
Making the further plausible assumption
 $d_1 \gg d_2$
, that is, the space diffusion of the infected persons leads mostly to increasing the total number of COVID-19 cases and not so much to new deaths, we may put
 $D=0$
. Following our previous paper [Reference Cherniha and Davydovych11], we specify the function
 $k(t)=k_0 e^{-\alpha t}$
(hereafter,
 $k_0>0, \ \alpha>0$
). Thus, system (3.2) takes the form:
 \begin{equation}\begin{array}{l} u_t = u_{xx}+u\left(1- u^\gamma\right), \\[3pt] v_t = \frac{k_0}{a}\exp\left(-\frac{\alpha t}{a}\right)u. \end{array}\end{equation}
Using Theorem 2.3 (see case 4) therein), one notes that system (3.3) admits the Lie symmetry
 $\partial_t-\frac{\alpha }{a}\,v\partial_v$
. So, taking the linear combination of this operator and the operator
 $\partial_x$
:
 \begin{equation*}X = c\partial_x + \partial_t-\frac{\alpha }{a}\,v\partial_v, \ c \in \mathbb{R},\end{equation*}
we obtain the ansatz:
 \begin{equation}u=\phi(\omega),\ v=\exp\left(-\frac{\alpha t}{a}\right)\psi(\omega), \ \omega=x-ct.\end{equation}
Substituting (3.4) into (3.3), one arrives at the ODE system:
 \begin{equation}\begin{array}{l} \phi''+ c\phi'+ \phi\left(1- \phi^\gamma\right)=0, \\[3pt] c\psi'+ \frac{\alpha}{a}\psi =-\frac{k_0}{a}\phi. \end{array}\end{equation}
The first equation in (3.5) is the known second-order ODE, which arises in many applications (e.g., for studying the Fisher equation and its natural generalisations [Reference Murray27]). The general solution of this ODE can be presented only in parametric form (see, e.g., [Reference Polyanin and Zaitsev32]), which is not useful for further analysis. However, an exact solution in the explicit form can be constructed for the correctly specified parameter
 $c=\frac{\gamma+4}{\sqrt{2(\gamma+2)}}$
. To the best of our knowledge, this parameter and the relevant solution were established in [Reference Abdelkader1] for the first time (see more references in [Reference Gilding and Kersner20]). As a result, we obtain the travelling front solution of the first equation in system (3.3):
 \begin{equation}u(t,x) =\left(1+ A\exp \left(\frac{\gamma}{\sqrt{2(\gamma+2)}}\,\omega\right)\right)^{-2/\gamma}, \ \omega=\pm\, x-\frac{\gamma+4}{\sqrt{2(\gamma+2)}}\,t, \ A>0.\end{equation}
Notably, (3.6) with
 $A<0$
is still a solution; however, one possesses a singularity. It should be also noted that the basic system (1.1) and its particular cases derived above are invariant under the discrete transformation
 $x \to -x$
; therefore, we may put
 $\omega= x-\frac{\gamma+4}{\sqrt{2(\gamma+2)}}\,t$
in what follows.
Having the function u in the explicit form (3.6), one easily derives the function v from the second equation of system (3.3):
 \begin{equation}v(t,x) =\frac{k_0}{a}\int \exp\left(-\frac{\alpha t}{a}\right)\left(1+ A\exp \left(\frac{\gamma}{\sqrt{2(\gamma+2)}}\,\omega\right)\right)^{-2/\gamma}dt + g(x),\end{equation}
where g(x) is an arbitrary smooth function. The integral in the right-hand side of (3.7) cannot be expressed in the terms of elementary functions for arbitrary parameters
 $a, \ \alpha$
and
 $\gamma$
; therefore, we study below a particular case.
In order to avoid cumbersome formulae, let us set
 $\gamma=1$
in system (3.3). In this case, the above exact solution takes the form:
 \begin{equation}\begin{array}{l} u(t,x) =\left(1+ A\exp \left(\frac{1}{\sqrt{6}}\,\omega\right)\right)^{-2}, \ \omega=x-\frac{5}{\sqrt{6}}\,t, \\v(t,x) =\frac{k_0}{a}\int \exp\left(-\frac{\alpha t}{a}\right)\left(1+ A\exp \left(\frac{1}{\sqrt{6}}\,\omega\right)\right)^{-2}dt + g(x).\end{array}\end{equation}
Remark 3.1 The expression for u(t,x) in (3.8) presents the well-known travelling front of the famous Fisher equation
 $u_t= u_{xx}+u(1-u)$
, which was firstly identified in [Reference Ablowitz and Zeppetella2].
The integral in the right-hand side of (3.8) can be expressed in the terms of elementary functions for several values of the parameter
 $\frac{\alpha }{a}$
. Taking
 $\frac{\alpha }{a}=\frac{5}{6}$
, for example, we obtain
 \begin{equation}\begin{array}{l} u(t,x) =\left(1+ A\exp \left(\frac{1}{\sqrt{6}}\,\omega\right)\right)^{-2}, \ \omega=x-\frac{5}{\sqrt{6}}\,t, \\v(t,x) =g(x) -\frac{6k_0}{5a}\exp\left(-\frac{x}{\sqrt 6}\right)\left(A+ \exp \left(-\frac{1}{\sqrt{6}}\,\omega\right)\right)^{-1}.\end{array}\end{equation}
Now we turn to a possible interpretation of solution (3.9). First of all, the functions u and v should be non-negative for any
 $t>0$
and
 $x \in \mathbb{I}$
(here
 $\mathbb{I} \subset \mathbb{R}$
) because they represent the densities. Obviously, the functions u is always positive. It is easily seen that each function g(x) satisfying the inequality:
 \begin{equation*} g(x) \geq \frac{6k_0}{5a}\exp\left(-\frac{x}{\sqrt 6}\right)\left(1+ A\exp \left(-\frac{x}{\sqrt{6}}\right)\right)^{-1}, \end{equation*}
guarantees also non-negativity of v. In particular, one may take the function:
 \begin{equation} g(x) = \frac{6k_0}{5a}\exp\left(-\frac{x}{\sqrt 6}\right)\left(1+ A\exp \left(-\frac{x}{\sqrt{6}}\right)\right)^{-1},\end{equation}
which guarantees that the zero density of the deaths in the initial time
 $t=0$
, that is,
 $v(0,x)=0$
. The initial profile for the density of the COVID-19 cases is
 \begin{equation*} u(0,x) =\left(1+ A\exp \left(\frac{x}{\sqrt{6}}\right)\right)^{-2}. \end{equation*}
Examining the space interval
 $\mathbb{I}=[x_1,x_2], \ x_1<x_2$
, we can calculate the total number of COVID-19 cases and deaths on this interval as follows:
 \begin{equation}\begin{array}{l} U(t)=\int_{x_1}^{x_2} u(t,x)dx, \\[3pt] V(t)=\int_{x_1}^{x_2} v(t,x)dx.\end{array}\end{equation}
So, substituting solution (3.9) into (3.11), we arrive at the formulae:
 \begin{equation}\begin{array}{l} U(t)=(x_2-x_1) - \sqrt{6}\Big[\Big(1+ A\exp \Big(\frac{x_1-\frac{5}{\sqrt{6}}\,t}{\sqrt{6}}\Big)\Big)^{-1}-\Big(1+ A\exp \Big(\frac{x_2-\frac{5}{\sqrt{6}}\,t}{\sqrt{6}}\Big)\Big)^{-1}\\[3pt]\hskip2cm +\ln\Big(1+ A\exp \Big(\frac{x_2-\frac{5}{\sqrt{6}}\,t}{\sqrt{6}}\Big)\Big)- \ln\Big(1+ A\exp \Big(\frac{x_1-\frac{5}{\sqrt{6}}\,t}{\sqrt{6}}\Big)\Big)\Big], \\[3pt] V(t)= \int_{x_1}^{x_2} g(x)dx - \frac{6\sqrt{6}\,k_0}{5a}e^{-\frac{5}{6}\,t}\Big[ \ln\Big(1+ A\exp \Big(\frac{\frac{5}{\sqrt{6}}\,t-x_1}{\sqrt{6}}\Big)\Big)-\ln\Big(1+ A\exp \Big(\frac{\frac{5}{\sqrt{6}}\,t-x_2}{\sqrt{6}}\Big)\Big].\end{array}\end{equation}
Obviously, the functions U(t) and V(t) are increasing and bounded, because
 \begin{equation*} (U,V) \to \Big((x_2-x_1), \int_{x_1}^{x_2} g(x)dx \Big) \ as \ t \to +\infty. \end{equation*}
Moreover, taking the appropriate function g(x), we can guarantee that
 \begin{equation*} U(0)=U_0\geq 0, \ V(0)=V_0\geq 0.\end{equation*}
Thus, one may claim that the exact solution (3.9) possesses all necessary properties for the description of the distribution of the COVID-19 cases and the deaths from this virus in time-space (under 1D approximation).
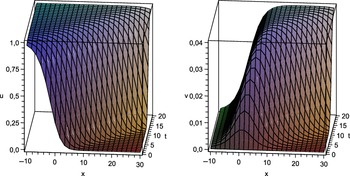
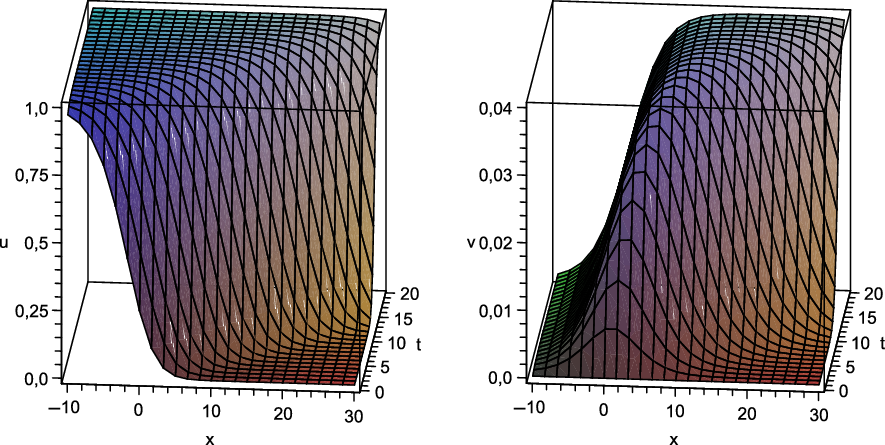
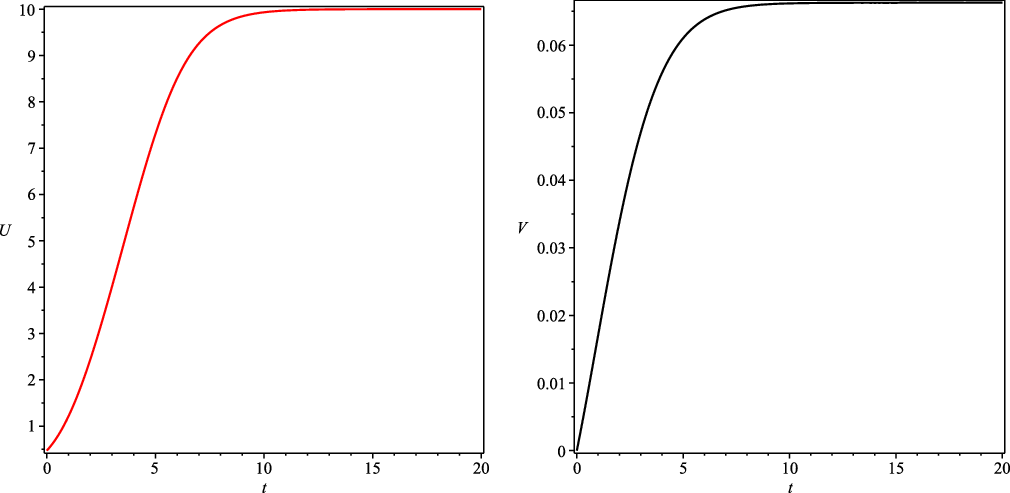
Examples of the exact solution (3.9) with the specified parameters and the corresponding functions (3.12) are presented in Figures 1 and 2. Notably, the parameters a and
 $k_0$
were taken approximately the same as in [Reference Cherniha and Davydovych11]. It follows from Figure 1 that the spread of the COVID-19 cases in space has the form of a travelling wave and this coincides (at least qualitatively) with the real situation in many countries. In Ukraine, for example, the COVID-19 pandemic started in the western part and then spread to the central and eastern parts of Ukraine (the major exception was only the capital Kyiv, in which the total number of COVID-19 cases was high from the very beginning). The distribution of deaths in space has more complicated behaviour (see the right plot in Figure 1). On the other hand, it is easily seen from Figures 1 and 2 that
 $v(t,x)\ll u(t,x)$
what is in agreement with the measured data in many countries [5]. Notably, the behaviour of the function v(t,x) can be essentially changed by the appropriate choice of the function g(x).


The functions (3.12) with (3.10). The function U(t) (left curve) shows the time evolution of the total number of COVID-19 cases on the space interval [0,Reference Cherniha and Davydovych10], while the function V(t) (right curve) shows the time evolution of total deaths. The parameters
 $k_0, \ a$
and A are the same as in Figure 1.
Example 3.2. Let us apply the operator
 $y\partial_x-x\,\partial_y$
from the principal algebra (2.5) for the reduction of the basic system (3.1). Obviously, this operator produces the well-known ansatz
 $u=u(t,r)$
,
 $v=v(t,r)$
and
 $r^2=x^2+y^2$
, that is, we examine the radially symmetric case. In this case, we arrive at the system:
 \begin{eqnarray} \nonumber && u_t = \frac{1}{r}\left(ru_{r}\right)_r+u\left(1- u^\gamma\right), \\ \nonumber &&v_t = D \frac{1}{r}\left(ru_{r}\right)_r +\frac{1}{a}\,k\left(\frac{t}{a}\right)u, \ D=\frac{d_2}{d_1}. \end{eqnarray}
Making the same assumptions
 $k(t)=k_0 e^{-\alpha t}$
and
 $d_1 \gg d_2$
, that is,
 $D=0$
, as in Example 3.1, we obtain the system:
 \begin{equation}\begin{array}{l} u_t = \frac{1}{r}\left(ru_{r}\right)_r+u\left(1- u^\gamma\right), \\v_t = \frac{k_0}{a}\exp\left(-\frac{\alpha t}{a}\right)u. \end{array}\end{equation}
We have proved that system (3.13) again admits the Lie symmetry
 $\partial_t-\frac{\alpha }{a}v\partial_v$
(however, the operator of the space translation
 $\partial_r$
is absent in this case). So, using this symmetry, one obtains the ansatz:
 \begin{equation}u=\phi(r),\ v=\exp\left(-\frac{\alpha t}{a}\right)\psi(r), \ r=\sqrt{x^2+y^2}.\end{equation}
Substituting (3.14) into (3.13), one arrives at the system:
 \begin{eqnarray} \nonumber && \phi''+ \frac{1}{r}\phi'+ \phi(1- \phi^\gamma)=0, \\[3pt] \nonumber &&- \frac{\alpha}{a}\psi =\frac{k_0}{a}\phi. \end{eqnarray}
Now one realises that the restriction
 $\alpha<0$
should take place because the function v means the density. So, the density of deaths increases to infinity as
 $t \to \infty$
. It means that the exponential growing of the function v is rather unrealistic because one obtains the total extinction of the population in question for a finite time. Thus, one should solve numerically the non-linear system (3.13) in order to get a realistic solution. Notably, numerical solutions of the Fisher-type equation from (3.13) can be found, for example, in [Reference Jordan and Puri22].
4 Conclusions
The main part of this paper is devoted to the LSC of the class of reaction–diffusion system with the cross-diffusion (1.1). The system in question was suggested in [Reference Cherniha and Davydovych11] as a natural generalisation of the mathematical model for describing the COVID-19 outbreak.
Firstly, we present a statement about the group of ETs of system (1.1) (see Theorem 2.1) in order to establish possible relations between systems that admit equivalent invariance algebras. Secondly, we find the principal algebra of system (1.1), that is, the maximal invariance algebra of this system with arbitrary coefficients (see Theorem 2.2). And lastly, we present two main theorems (Theorems 2.3 and 2.4) describing reaction–diffusion systems of the form (1.1) admitting non-trivial Lie symmetry, that is, present the LSC of system (1.1). In Section 3, we demonstrate that the Lie symmetries identified in Section 2 are useful for finding exact solutions, which can describe the spread of the COVID-19 pandemic.
From the mathematical point of view, the most interesting Lie symmetry operators of system (1.1) occur when
 $d_1=0$
and are presented in Theorem 2.4. One sees that the coefficient
 $\xi^0$
of the infinitesimal operator X (see (2.6)) depends on the variable u (excepting case
 ${2)}$
). Moreover, this dependence is nonlinear. To the best of our knowledge, it is the first example of such dependence for systems of evolution equations, in particular, reaction–diffusion systems. We assume that such unusual Lie symmetry of system (1.1) with
 $d_1=0$
can be a consequence of its integrability. In fact, one may consider the first equation as an ODE with the variables x and y as parameters. Solving this ODE, one obtains
 \begin{equation*} u(t,x,y)=a^{1/\gamma}e^{a t}C(x,y)\,\Big(a+b\,C^{\gamma}(x,y)\left(e^{a \gamma t}-1\right)\Big)^{-1/\gamma},\end{equation*}
where C(x,y) is an arbitrary function. Substituting this expression for u into the second equation of the system, one again obtains the integrable ODE to find the function v.
Finally, it should be pointed out that Lie symmetries operators, which are non-linear w.r.t. unknown functions, were recently identified for a simplification of the Shigesada–Kawasaki–Teramoto system in [Reference Cherniha, Davydovych and Muzyka12] (see Section 3). Such peculiarity of Lie symmetry also occurs for a special Schrödinger type equation [Reference Fushchych, Cherniha and Chopyk19], which can be rewritten in the form of a reaction–diffusion system with the cross-diffusion. However, the coefficient
 $\xi^0$
(see operator (2.10)) in all known Lie symmetries of a wide range of reaction–diffusion systems [Reference Cherniha, Davydovych and Muzyka12, Reference Cherniha and King13, Reference Cherniha and Wilhelmsson15, Reference Fushchych, Cherniha and Chopyk19, Reference Nikitin29, Reference Serov, Karpaliuk, Pliukhin and Rassokha35, Reference Stewart, Broadbridge and Goard37, Reference Torrisi, Tracina and Valenti39] (see also Chapter 2 in [Reference Cherniha and Davydovych9]) does not depend on the unknown function(s) in contrast to those in Theorem 2.4 and examples (2.28)–(2.29). Moreover, we may conclude that the well-known ‘people theorem’ stating that the coefficient
 $\xi^0$
in each Lie symmetry of an arbitrary scalar evolution PDE of the order two and higher can depend only on the time variable (no dependence on space variables and/or dependent variable!) cannot be generalised on the systems of evolution equations without additional restrictions. The problem how to define these restrictions is an open question.
From the applicability point of view, the most interesting system of the form (1.1) admitting non-trivial Lie symmetry is presented in case
 ${(4)}$
of Theorem 2.3. Here the function k(t) of system (1.1) has the form that can be useful for describing the COVID-19 outbreak [Reference Cherniha and Davydovych11]. Moreover, the diffusivity
 $d_2=0$
as it is stated in [40]. In Section 3, we demonstrate how the Lie symmetries obtained can be applied for the constructing of exact solutions. Furthermore, we prove that an exact solution (with correctly specified parameters) possesses all necessary properties for the description of the distribution of the COVID-19 cases and the deaths from this virus in time and space. Although it was done under 1D space approximation, this solution can be useful for the prediction of the COVID-19 pandemic if its spread has a favourite direction. A typical example is Ukraine. Of course, one needs to identify all the parameters in system (1.1) in order to calculate correct numbers of the COVID-19 cases and make a plausible prediction, but this lays beyond the scope of this work.
Acknowledgement
The authors are grateful for the very useful comments of unknown reviewers. Especially, we are indebted to the reviewer who gifted us some details in order to improve the results of Theorem 2.4 in Cases 3 and 4.