Introduction
Anurans are highly philopatric, an abundant component in terrestrial and aquatic communities, and presents a synergetic link between trophic levels, thus are considered appropriate models to investigate resource partitioning and trophic interactions (Whiles et al. Reference Whiles, Lips, Pringle, Kilham, Bixby, Brenes, Connelly, Colon-Gaud, Hunte-Brown, Huryn, Montgomery and Peterson2006, Verburg et al. Reference Verburg, Kilham, Pringle, Lips and Drake2007, Trakimas et al. Reference Trakimas, Jardine, Barisevičiūtė, Garbaras, Skipitytė and Remeikis2011, Deichmann et al. Reference Deichmann, Toft, Deichmann, Lima and Williamson2012, Huckembeck et al. Reference Huckembeck, Loebmann, Albertoni, Hefler, Oliveira and Garcia2014). Sympatric species that co-occur in local habitats within a region are particularly referred to as syntopic (Rivas Reference Rivas1964, Hirai & Matsui Reference Hirai and Matsui2001b, Sabagh et al. Reference Sabagh, da Silva Mello and Duarte Rocha2012, Garcia et al. Reference Garcia, Catherine and Fu2017, Hart et al. Reference Hart, Iverson, Fujisaki, Lamont, Bucklin and Shaver2018). Moreover, syntopic (ecologically similar) anurans exhibit varying levels of food resource partitioning (Toft Reference Toft1980a, de Oliveira et al. Reference de Oliveira, Gottschalk, Loebmann, dox Santos, Miranda, Rosa and Tozetti2015, Moser et al. Reference Moser, Gottschalk, Loebmann, dos Santos, Miranda, Rosa and Tozetti2017), have a dietary composition that depend on food availability (Toft Reference Toft1980b, Hirai & Matsui Reference Hirai and Matsui2000b, Araújo et al. Reference Araújo, Dos Reis, Giaretta, Machado and Bolnick2007), and show trophic interactions influenced by morphology and microhabitat use (de Oliveira et al. Reference de Oliveira, Gottschalk, Loebmann, dox Santos, Miranda, Rosa and Tozetti2015, Moser et al. Reference Moser, Gottschalk, Loebmann, dos Santos, Miranda, Rosa and Tozetti2017, Huckembeck et al. Reference Huckembeck, Winemiller, Loebmann and Garcia2018).
The anurans of the Philippine archipelago occupy restricted geographical ranges within five to seven distinct sub-faunal regions, assembled along elevational gradients at varying habitat types, and are presumably influenced by shared microhabitat substrates in forested communities (Brown et al. Reference Brown, Diesmos, Sanguila, Siler, Diesmos and Alcala2012, Reference Brown, Siler, Oliveros, Esselstyn, Diesmos, Hosner, Linkem, Barley, Oaks, Sanguila, Welton, Blackburn, Moyle, Peterson and Alcala2013, Diesmos et al. Reference Diesmos, Watters, Huron, Davis, Alcala, Crombie, Afunag, Gee-Das, Sison, Sanguila, Penrod, Labonte, Davey, Leone, Diesmos, Sy, Welton, Brown and Siler2015). Within these forested local habitats, anurans share space and occupy distinct zones — Ceratobatrachids and Rhacophorids occupy terrestrial zones, whereas Bufonids, Dicroglossids, and Ranids occupy riparian zones (Sanguila et al. Reference Sanguila, Plaza, Mahinay, Edma and Brown2021). Species belonging to these groups frequently co-occur and exhibit overlap in the use of aquatic (ephemeral pools, flowing and cascading waters of rivers and streams), arboreal (in shrubs and vegetation above ground), and ground (leaf litters on forest floors) microhabitat substrates (Plaza & Sanguila Reference Plaza and Sanguila2015, Sanguila et al. Reference Sanguila, Cobb, Siler, Diesmos, Alcala and Brown2016, Sanguila et al. Reference Sanguila, Plaza, Mahinay, Edma and Brown2021) along elevation gradients in riparian communities of the Mindanao island — a distinct sub-faunal region south of the Philippine archipelago.
The present study investigates the trophic resource partitioning of syntopic anurans in riparian communities in a tropical watershed ecosystem of northeast Mindanao, southern Philippines. We employed stomach content analysis (SCA) and SIA to (1) quantify anuran feeding niche metrics (diet composition, dietary niche overlap, and trophic niche breadth) on a temporal scale and (2) describe potential trophic interactions between anurans and prey inferred from carbon (δ 13C and δ 12C) and nitrogen (δ 15N and δ 14N) stable isotopes.
Methods
Study area
Our study site is formally known as the Taguibo River Watershed Forest Reserve (TRFWR) and popularly known as the Taguibo Watershed. Taguibo covers a total area of 43.6744 km2 that spans several political boundaries in the Province of Agusan del Norte, Caraga Region of the Mindanao Island, southern Philippines. (Figure S1). The area is located south of Mt. Hilong-hilong massif which is a key biodiversity area of the Eastern Mindanao biodiversity corridor. Taguibo Watershed provides important ecosystem services such as water for drinking and irrigation — also serves as a buffer zone from extreme weather conditions (Mallari et al. Reference Mallari, Tabaranza and Crosby2001, Santillan et al. Reference Santillan, Makinano and Paringit2011). We established two sampling sites in low- and mid-elevation areas in the Taguibo Watershed. Site 1: Barangay Pianing; Sitio Mandalayag; Coordinates WGS 84: 08o58'25.5"N, 125o 40'01.2"E; 200–300 m elevation. This site is near cultivated land and is a secondary forest characterised with a 3–5 m wide slow-moving stream. During fieldwork, air temperature range in the area was 25oC to 29oC, and the relative humidity range was 92% to 100%. Site 2: Barangay Anticala; Sitio Ginubatan; Coordinates WGS 84; 09o02'57.7"N, 125o41'76.3"E; 600–700 m elevation. Site 2 is a primary lower montane forest characterised with a 10–15 m wide fast flowing stream with large, mossy boulders, overhanging vegetations (ferns and pitcher plant Nepenthes), and dipterocarp trees. Air temperature range of the area was 21oC to 22.5oC, and the relative humidity range was 82.7% to 91% (Fig. S2).
Field survey and data collection
We surveyed anurans for 3–5 days from April to September 2017, following standardised collection techniques by Heyer et al. (Reference Heyer, Donnelly, McDiarmid, Hayek and Foster1994). One to three 100-m line transects (50 m away from each other) were established along and surrounding low- and mid-elevation forested streams. Each transect was marked at every 10-m interval using fluorescent flagging. Anurans were randomly collected by hand capture during nocturnal (1900–0000 h) walks. We identified specimens in the field following the relevant reference guides by Plaza & Sanguila (Reference Plaza and Sanguila2015) and Sanguila et al. (Reference Sanguila, Cobb, Siler, Diesmos, Alcala and Brown2016). We recorded associated natural history data (microhabitat), and we obtained specimen-associated data such as body mass (grams), snout to vent length (SVL), and mouth width (MW) in millimetre. All these data were logged onto field catalogs. We followed standardised specimen preservation techniques by Simmons (Reference Simmons2002). Each specimen was tagged with the corresponding field tag number series. Specimens were initially fixed in 10% formalin in the field and were later transferred to 70% ethanol at the Father Saturnino Urios University-Reference Natural History Collection.
We used two approaches for this study’s SCA. The captured anurans were examined for the collection of prey items by employing stomach flushing technique (Leclerc & Curtois Reference Leclerc and Courtois1993, Solé et al. Reference Solé, Beckmann, Pelz, Kwet and Engels2005). We also performed a ventral dissection to obtain the stomach and the first portion of the intestine (Schoener Reference Schoener1989). The stomach and intestinal contents (prey items) were then fixed in 95% ethanol in the field for its subsequent identification in the laboratory. Only intact prey items were considered for analysis which were identified to the level of Order or Family (for ants). We excluded plants, unidentified debris, rocks, and partially to completely digested items, fragments, or body parts of the prey items, as these are considered accidental ingestions in anurans (Hirai & Matsui Reference Hirai and Matsui2000a, Reference Hirai and Matsui2000b, Wells Reference Wells2007).
We obtained upper leg muscles from each anuran specimens, and we collected whole individuals for insects and other invertebrates as potential prey sources for this study’s SIA. The muscle samples and potential prey sources were oven dried at 60oC for at least 48 hours, pulverised in acid-washed mortar and pestle, and stored in appropriately labelled Eppendorf vials (Jardine et al. Reference Jardine, McGeachy, Paton and Cunjak2003, Huckembeck et al. Reference Huckembeck, Loebmann, Albertoni, Hefler, Oliveira and Garcia2014, Reference Huckembeck, Winemiller, Loebmann and Garcia2018). We determined the δ 13C and δ 15N stable isotopes for all samples by employing the dual stable isotopes technique processed in a Thermo Stable Isotopes Analyzer. We obtained the isotope ratio mass for the samples via a ConFlo-III continuous flow interface processed in a ThermoFinnigan DELTAplus XP isotope ratio mass spectrometer. The anuran samples with elemental C: N ratio >4 were corrected for elevated levels of lipid content (Post Reference Post2002). Isotopic ratio mass spectrometry data were reported as isotopic notations of carbon (δ 13C) and nitrogen (δ 15N) and were expressed as per milliliter ‰ (parts per thousand) using the following equation: δ 13C, δ 15N = [R sample/R standard − 1] × 1000 (‰) where R = 13C/12C or 15N/14N. We evaluated the measured values of carbon (δ 13C and δ 12C) and nitrogen (δ 15N and δ 14N) using standard patterns of Vienna Pee Dee belemnite limestone and atmospheric nitrogen (Peterson & Fry Reference Peterson and Fry1987). We used the fractionation values of 3.4+ ‰ for δ 15N for enrichment in δ 15N and 0.8+‰ for δ 13C in δ 13C from food or prey to consumer (Minagawa & Wada Reference Minagawa and Wada1984, Vander Zanden & Rasmussen Reference Vander Zanden and Rasmussen2001, Mantel et al. Reference Mantel, Salas and Dudgeon2004).
Data analysis
We measured the length and width of each prey items in millimetre, and we calculated prey volume (mm3) using the formula:
 $\;Volume = 4/3\pi \;\left( {l/2} \right){\left( {w/2} \right)^2}$
, where
 $l$
= prey length and
 $w =\ $
prey width (Dunham Reference Dunham, Huey, Pianka and Schoener1983). We further calculated Index of Relative Importance (IRI) to reduce bias and to determine the important prey categories in anuran dietary data (Pianka Reference Pianka1973) using the formula by Pinkas et al. (Reference Pinkas, Oliphant and Iverson1971):
 $IRI = \left( {N\; + \;\;V} \right)\;x\;FO$
, where
 $N$
= percentage numerical count of each food item relative to the total count of all prey items,
 $V =\ $
percentage volume of each prey item relative to the volume of all prey items combined, and
 $FO =\ $
percentage occurrence of each prey item in the stomach and intestine of all anuran individuals examined for this study. We calculated monthly IRI in each species and use the calculated pooled IRI values for all sampling months (April to September 2017) to illustrate the ecological interaction between anurans and its prey.
We employed a bipartite network analysis to visualise patterns in predator–prey relationship between anurans and its prey items via ecological network links. To plot the web links (in grey bars), we used anuran abundance data (=species counts; lower gray bars; predators) and the calculated pooled values of IRI of the prey items (invertebrates; upper bars). The width of the grey bars linking the lower to the upper bars indicate the strength of the interaction between predators and prey items — a wide bar implies a strong interaction, whereas a thin bar implies a weak interaction. We further used the function visweb to illustrate the calculated values of the visualised ecological interactions between anurans and its prey items. The intensity of the colour of each shaded area (in squares) in the table indicates the strength of an interaction — darker shades imply a stronger interaction and the lighter shades imply a weaker interaction (Dormann et al., Reference Dormann, Gruber and Fründ2008).
We determined the dietary niche breadth and overlap in anurans using appropriate feeding ecology metrics. We used the calculated values of the numerical proportion of prey items (
 $n$
), where
 $n$
= percentage numerical count of each prey item relative to the total count of all prey items to determine trophic niche breadth following Levins’ measure:
 $B = \frac{1}{{\sum\nolimits_i^n {p_i^2} }}$
where
 $p =\ $
proportion of total food items in the category
 $i$
, and
 $n$
= total number of food categories. Levins’ measure was standardised on a scale of 0–1, using the following equation: B
st
=
 $B\; - 1/n\; - 1$
, where
 ${B_{st}}$
corresponds to Levins’ standardised niche breadth and
 $n$
is the number of possible resource states (i.e. prey categories). The calculated values range from 0 to 1 — 0 implies the narrowest breadth when there is use of a single resource category and 1 implies the broadest breadth when all categories are equally used. We followed the consideration that the anuran species with
 ${B_{st}}\;$
≥ 0.5 exhibits a wide niche breadth and those anuran species with
 ${B_{st}}$
< 0.50 exhibits a narrow niche breadth (Krebs Reference Krebs1999). We determined dietary niche overlap using Pianka’s index (Pianka Reference Pianka1973) following the formula:
 $Ojk = \frac{{\sum {{p_{ij}}} {p_{jk}}}}{{\sqrt {\sum {p_{ij}^2} } p_{jk}^2}}$
where
 ${p_{ij}}$
and
 ${p_{jk}}$
represent the proportion of prey category
 $i$
in the diet of species
 $j\;$
and
 $k$
. We followed the interpretation of the calculated dietary overlap values, such that, dietary values
 $Ojk$
= 1 implies that two anuran species exhibit similarity of diet (complete overlap) and those species with dietary values
 $Ojk$
= 0 indicate dissimilarity of diet (no overlap). In addition, we followed the interpretation that the calculated dietary overlap values between anuran species arbitrarily set at the following levels each imply that —
 $Ojk\;$
> 0.70 (high),
 $Ojk$
= 0.4 − 0.7(intermediate), and
 $Ojk\;$
< 0.40 (low) dietary overlaps between the anuran species. We employed Kruskal–Wallis H and Wilcoxon signed-rank test to compare the calculated values of the dietary overlap values (
 $Ojk)$
and feeding niche breadth (
 ${B_{st}}$
) exhibited by the seven syntopic anurans across sampling months and to compare dietary overlap and feeding niche breadth between the anuran species L. magnus and P. grandocula recorded between the two study sites, respectively.
We estimated the relative contribution of potential sources to the diet of anurans using the Bayesian stable isotope mixing model in stable isotope analysis in R (SIAR). The SIAR mixing model allows the incorporation of uncertainties associated with sample variability and trophic enrichment systems and assumes that variability associated with food sources and trophic enrichment is normally distributed. Proportion values ≥ 0.2 at 95% internal credibility were used to determine specific food sources that strongly influence species at different trophic position (Parnell et al. Reference Parnell, Inger, Bearhop and Jackson2010). Carbon and nitrogen isotope values between anurans and potential sources were plotted using OmniGraphSketcher version 1.1.4. All calculations for feeding ecology metrics, i.e., niche breadth and overlap were done in a Microsoft Excel spreadsheet. Analyses of predator–prey relationship using bipartite package, relative contribution of potential sources using SIAR, and the comparison of means for the test of significance, i.e., Kruskal–Wallis and Wilcoxon tests were performed in R (R Core Team 2017).
Results
Dietary composition, prey importance, and feeding interaction
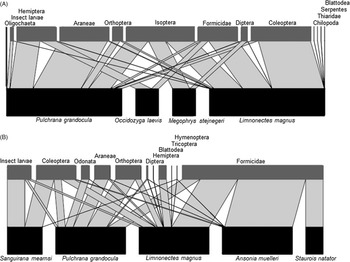
The bipartite network analysis revealed the diet composition, prey importance, and feeding interaction of the seven syntopic anurans (Ansonia muelleri, Limnonectes magnus, Occidozyga laevis Megophrys stejnegeri, Pulchrana grandocula, Sanguirana mearnsi, and Staurois natator) in relation to different prey categories — sampled from low- and mid-elevation sites in forested riparian communities of the Taguibo Watershed (Fig. 1). We recorded a total of 13 ingested prey types in low-elevation anurans (L. magnus, O. laevis, P. grandocula, and M. stejnegeri) and 11 prey types in mid-elevation anurans (A. muelleri, L. magnus, P. grandocula, S. mearnsi, and S. natator). Majority of the 13 prey categories belonged to insect groups (i.e., Blattodea, Coleoptera, Diptera, Hemiptera, Hymenoptera, Formicidae, Isoptera, Orthoptera, insect larvae, Odonata, and Trichoptera) and other prey types such as arthropods (Araneae and Chilopoda), annelids (Oligochaeta), gastropods (Thiaridae), and a vertebrate (Serpentes) [see also Fig. S2–S4; Table S1–2).
Bipartite network analysis (predator-prey links) of seven syntopic anurans and its important prey taxa documented in low- (A) and mid- elevation (B) forested riparian sites of the Taguibo Watershed, Agusan del Norte, northeast Mindanao, Philippines. The width of the bars in the bipartite plot determines the degree of interaction between syntopic anurans (predator; species abundance counts, lower bars) and its associated prey items (sum total of IRI across sampling months, upper bars).

In this study, we considered the first five prey types with the highest value of pooled IRI — indicated by darker shades — as the most important prey types ingested by the anurans. Low-elevation anuran species (Site 1), ingested Isoptera, Coleoptera, Araneae, Formicidae, and Hemiptera, whereas mid-elevation anuran species ingested Formicidae, Coleoptera, Orthoptera, insect larvae, and Araneae. In addition, based on the width of the bars in the bipartite plots — the link of association and the strength of the interaction between predator (anurans’ species abundance counts) and prey items (sum of the pooled IRI values across sampling months) — the following feeding interactions were observed on each site (Fig. 1 and Fig. S2).
Among the low-elevation anuran species (Site 1), P. grandocula and L. magnus were found to be the most abundant species in the area. The aquatic-dwelling P. grandocula exhibited a strong interaction to spiders (Araneae = 208.85), bugs (Hemiptera =100.00), and Isoptera (=95.69), whereas L. magnus depicted a strong interaction to beetles (Coleoptera = 226.72), ants (Formicidae = 126.56), and Isoptera (=124.92). Moreover, we recorded only two prey types in O. laevis and M. stejnegeri. Interestingly, in O. laevis, ants (Formicidae = 31.16) revealed a strong interaction than Hemiptera (6.84) to this anuran species, whereas M. stejnegeri showed a strong interaction to Isoptera (=74.96) than Diptera (25.04) [Fig. 1 and S2; Table S1–2).
Among mid-elevation anurans (Site 2), A. muelleri, L. magnus, and P. grandocula were the most abundant anurans in the area. Of the five prey types associated with A. muelleri, it was observed that ants (Formicidae = 386.51) exhibited a strong interaction to A. muelleri, whereas the four remaining prey types showed weak interactions — Coleoptera (11.81), Araneae (0.55), Diptera (0.81), and Hemiptera (0.32). The Mindanao-endemic L. magnus exhibited a strong interaction to prey types such as ants (Formicidae = 214.12), Coleoptera (72.28), and Blattodea (43.60). Samples of P. grandocula from this area depicted a strong interaction to prey types such as Orthoptera (112.06), ants (Formicidae = 101.84), and Araneae (79.36). Moreover, P. grandocula also revealed weak interactions to the remaining prey types such as Odonata = 45.04, Coleoptera = 41.34, insect larvae = 14.24, and Diptera = 6.12. The northeast Mindanao-endemic S. mearnsi showed strong interaction to two prey types — insect larvae = 100.00 and Coleoptera = 99.94. Finally, in S. natator, only one prey type (Formicidae = 100.00) was recorded (Fig. 1 and S2; Table S1–2).
Anuran trophic niche breadth
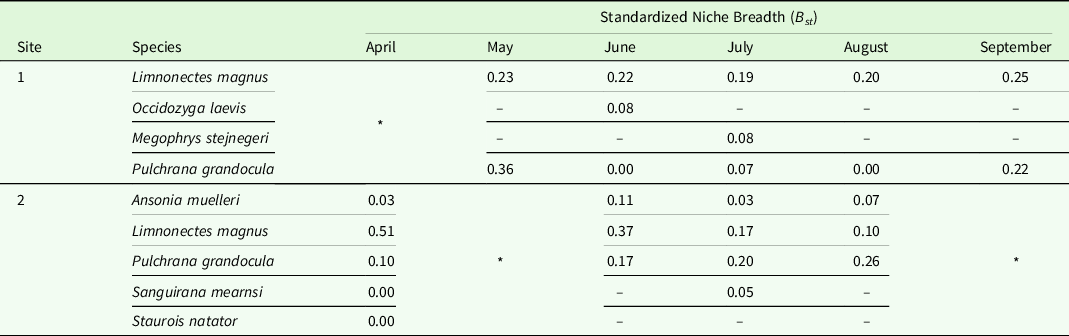
In this study, the calculated niche breadth
 $Bst$
values (Table 1) revealed that the low-elevation anuran species L. magnus (
 $Bst$
= 0.19 − 0.25), and P. grandocula (
 $Bst$
= 0.00 − 0.36) showed a narrow niche breadth across sampling months (April–September). However, comparison of
 $Bst$
values among sampling months for the two anurans (L. magnus: X
2 = 4, df = 4, P-value = 0.41; P. grandocula: X
2 = 3.2, df = 3, P-value = 0.36, see Table S3–4) were not significant. Moreover, we are uncertain of the observed narrow niche breadth in O. laevis and M. stejnegeri (
 $Bst$
= 0.08) because this observation was based only on single specimen observations on two separate months (June and July). Among the mid-elevation anurans, S. natator (
 $Bst$
= 0.00) and S. mearnsi (
 $Bst$
= 0.00 and 0.05) exhibited the narrowest niche breadth. Across sampling months, A. muelleri (
 $Bst$
= 0.03 − 0.11), L. magnus (
 $Bst$
= 0.10 − 0.51), and P. grandocula (
 $Bst$
= 0.10 − 0.26) also exhibited a narrow niche breadth. Comparison of
 $Bst$
values across sampling months for these species (A. muelleri: X
2 = 1.8, df = 2, P-value = 0.41; L. magnus: X
2 = 3, df = 3, P-value = 0.39; P. grandocula: X
2 = 3, df = 3, P-value = 0.39) were not significant (Table S3–4).
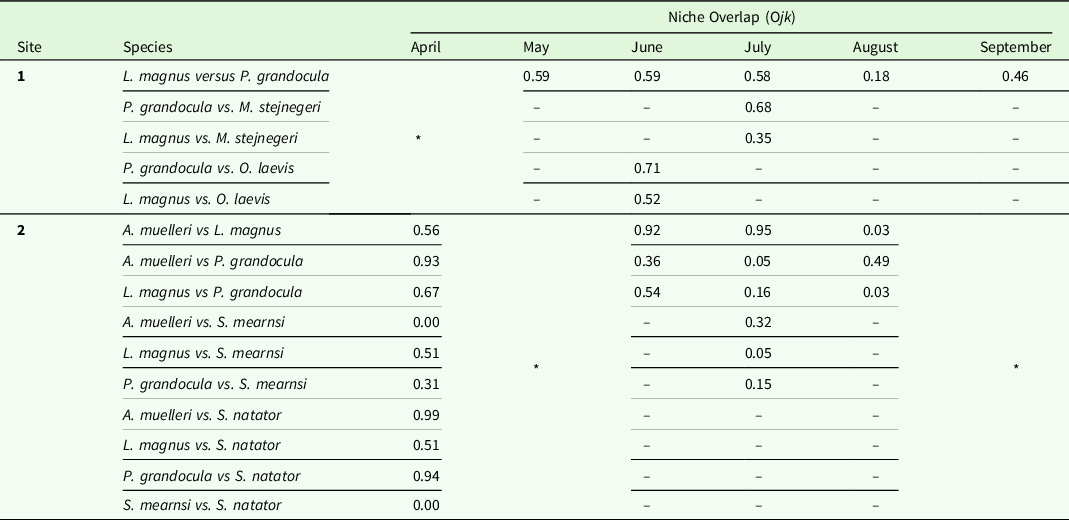
Dietary niche overlap (Ojk) between syntopic stream anurans documented in low (Site 1) and mid-elevation (Site 2) riparian communities of the Taguibo River Watershed Forest Reserve, Agusan del Norte Province, northeast Mindanao, Philippines

Asterisk (*) means month was not sampled. Dash (–) indicates O jk cannot be calculated.
Interspecific trophic niche overlap
Across sampling months (April–September), among the low-elevation anurans (Site 1), L. magnus and M. stejnegeri exhibited a low dietary niche overlap (
 $Ojk$
= 0.35), whereas an intermediate dietary niche overlap was detected between L. magnus and O. laevis (
 $Ojk =\ $
0.52), P. grandocula and M. stejnegeri (
 $Ojk$
= 0.68), and P. grandocula and O. laevis (
 $Ojk =\ $
0.71). All mentioned species pairs were single specimen observations. In addition, a low to intermediate dietary niche overlap was detected between L. magnus and P. grandocula (
 $Ojk =\ $
0.18 − 0.59). However, the comparison of
 $Ojk$
values among sampling months between these species were not significant (X
2
= 3.8, df = 3, P-value = 0.28, see Table S3–4). Among the mid-elevation anurans (Site 2), the following dietary niche overlap between anuran species were observed: (1) none to low overlap between A. muelleri and S. mearnsi (April:
 $Ojk =\ $
0.00; July:
 $Ojk =\ $
0.32); (2) low overlap between L. magnus and S. natator based on a single specimen observation (April:
 $Ojk =\ $
0.51); (3) low to intermediate overlap between (a) S. mearnsi and L. magnus (April:
 $Ojk =\ $
0.51; July:
 $Ojk =\ $
0.05), (b) P. grandocula and S. mearnsi (April:
 $Ojk =\ $
0.31; July:
 $Ojk =\ $
0.15), and (c) L. magnus and P. grandocula (
 $Ojk =\ $
0.03 − 0.67); (4) low to high overlap between A. muelleri and L. magnus (
 $Ojk$
= 0.03 − 0.95) and A. muelleri and P. grandocula (
 $Ojk$
= 0.05 − 0.93); and (5) high overlap between A. muelleri and S. natator based on a single observation (April:
 $Ojk =\ $
0.99). Comparison of
 $Ojk$
values between species pairs present across sampling months (April to September), i.e., (a) L. magnus and P. grandocula (X
2
= 3, df = 3, P-value = 0.39), (b) A. muelleri and L. magnus (X
2
= 4.86, df = 4, P-value = 0.30), and (c) A. muelleri and P. grandocula (X
2
= 4.86, df = 4, P-value = 0.30) were not significant (Table 2; see also Table S3–4).
Standard trophic niche breadth in syntopic stream anurans documented in low (Site 1) and mid-elevation (Site 2) riparian communities of the Taguibo River Watershed Forest Reserve, Agusan del Norte Province, northeast Mindanao, Philippines

Asterisk (*) means month was not sampled. Dash (–) indicates B st cannot be calculated.
Trophic position and assimilation of potential prey sources
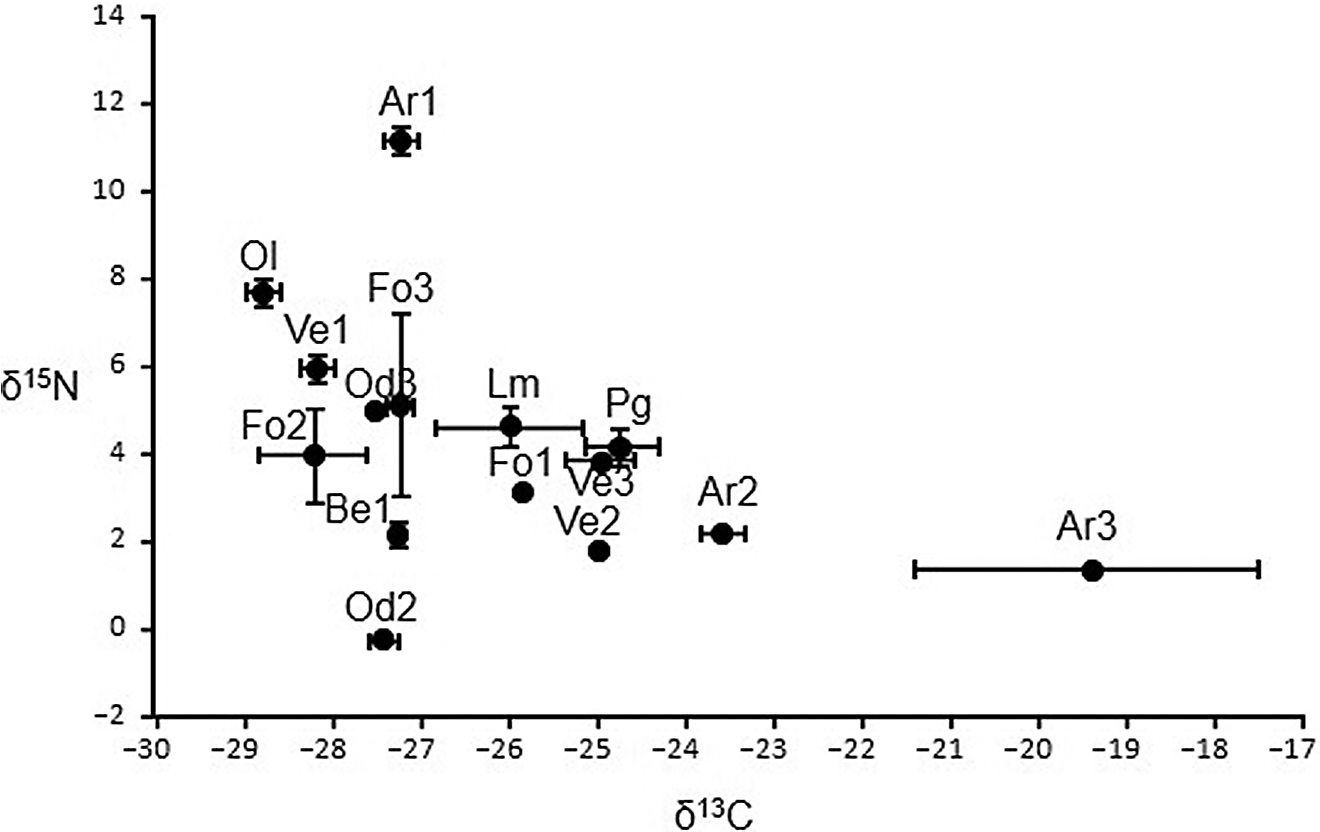
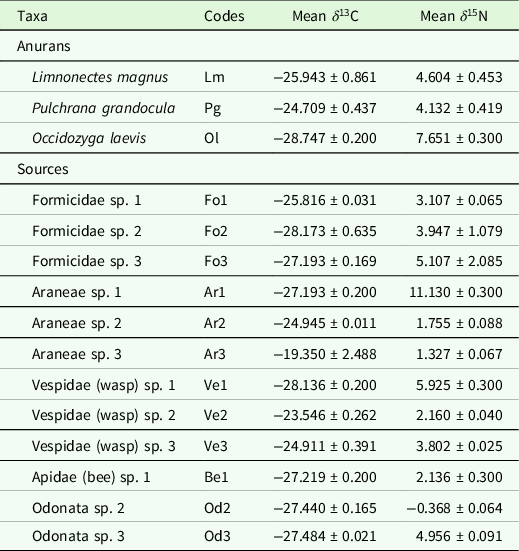
We investigated the assimilation of potential prey sources (Formicidae, Vespidae, Apidae, Odonata, and Araneae) in three low-elevation syntopic stream anurans (L. magnus, P. grandocula, and O. laevis) via dual carbon δ 13C and δ 12C and nitrogen δ 15N and δ 14N stable isotopes (Fig. 2–3, Table 3). The relative positions of these anurans revealed low interspecific differences in the assimilation of carbon and nitrogen isotopes from the potential prey sources (Fig. 2). Anurans L. magnus (mean δ 13C = −25.94‰; mean δ 15N = 4.60‰) and P. grandocula (mean δ 13C = −24.70‰; mean δ 15N = 4.13‰) had similar mean carbon and nitrogen isotopic signatures compared to O. laevis (mean δ 13C = −28.75‰; mean δ 15N = 7.65‰). All five potential prey sources had similar mean δ 13C values, whereas high mean δ 15N (mean δ 15N = 11.13‰) values were detected in Araneae (Table 3).
Mean carbon and nitrogen stable isotope signatures of the syntopic anurans Limnonectes magnus (Lm), Pulchrana grandocula (Pg), Occidozyga laevis (Ol) and the five potential prey sources of the family Formicidae (Fo), Odonata (Od), Araneae (Ar), Vespidae (Ve), and Apidae (Be) documented in low- (A) and mid- elevation (B) forested riparian sites of the Taguibo Watershed, Agusan del Norte, northeast Mindanao, Philippines.

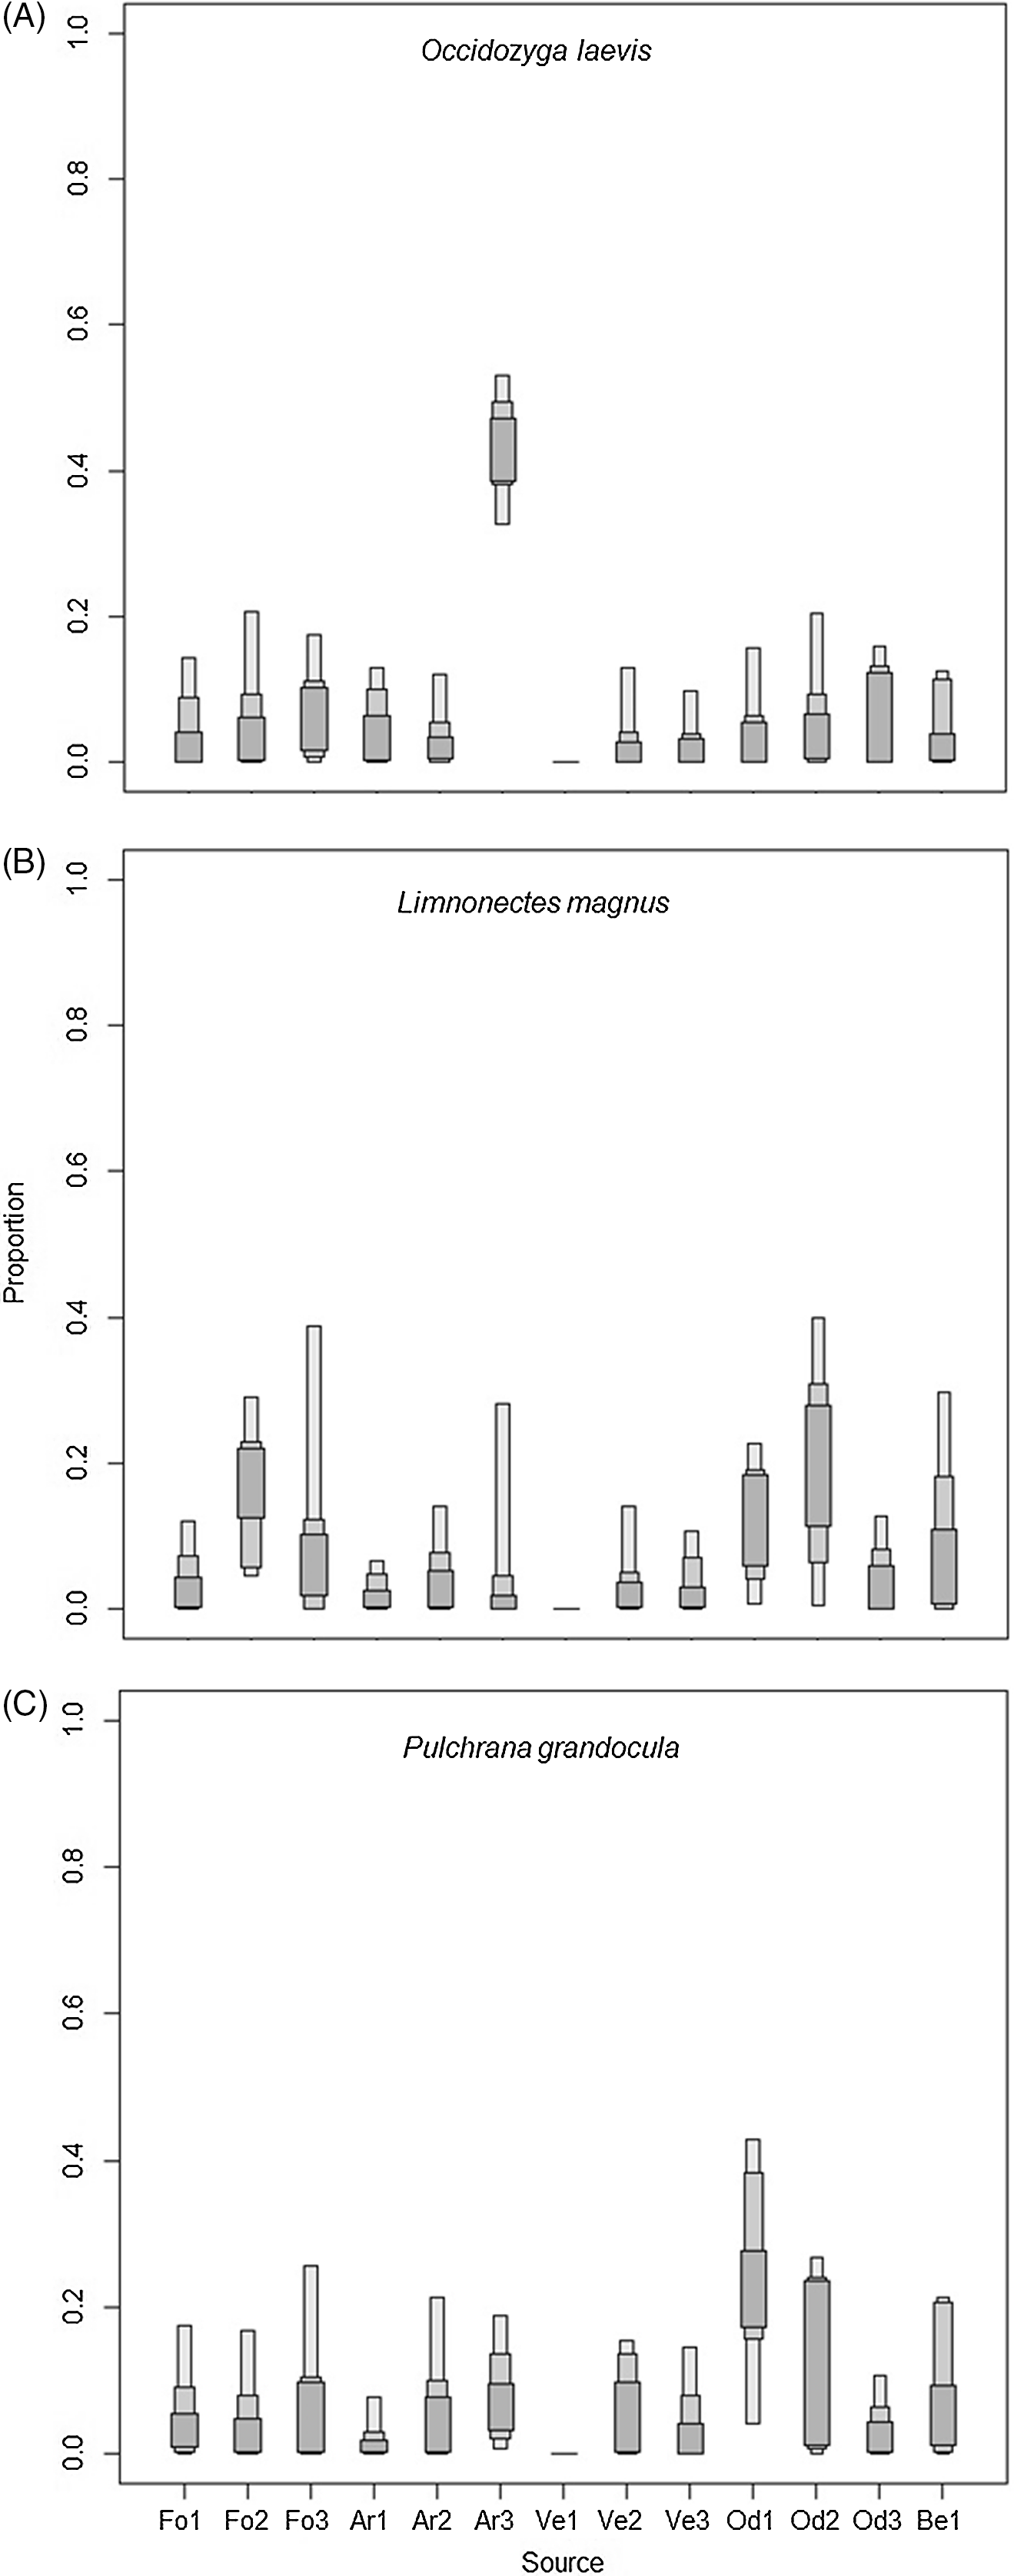
Relative contribution of potential prey sources assimilated by syntopic stream anurans Occidozyga laevis (A), Limnonectes magnus (B), and Pulchrana grandocula (C) collected from low-elevation riparian communities of the Taguibo Watershed, Agusan del Norte, northeast Mindanao, Philippines.

Mean δ 13C and δ 15N (± SD) in syntopic stream anurans and potential sources documented in low-elevation riparian communities of the Taguibo River Watershed Forest Reserve, Agusan del Norte Province, northeast Mindanao, Philippines

We estimated proportions of assimilated prey sources by L. magnus, P. grandocula, and O. laevis using isotope mixing models. Potential prey sources Formicidae, Vespidae, Apidae, and Odonata were estimated to be assimilated in relatively equal proportions (˜20%) except for the family Araneae (>50%) by O. laevis. Assimilating Formicidae (˜40%) and Odonata (˜40%) were the two potential prey sources to have possibly assimilated in high proportions into the diet of L. magnus and P. grandocula (Fig. 3).
Discussion
Our study provides the first picture of the trophic interaction of seven syntopic anurans (Ansonia muelleri, Limnonectes magnus, Occidozyga laevis, Megophrys stejnegeri, Pulchrana grandocula, Sanguirana mearnsi, and Staurois natator) in tropical riparian zones of northeast Mindanao — an important amphibian faunal region of the Philippine archipelago (Sanguila et al. Reference Sanguila, Cobb, Siler, Diesmos, Alcala and Brown2016).
In this study, the dietary composition of low- and mid-elevation syntopic anurans consisted mostly of insect prey categories across sampling months. These stream anurans also exhibited diet similarities as indicated by its consumption of locally abundant prey items such as Formicidae (ants), Coleoptera (bettles), Isoptera (termites), Araneae (spiders), Hemiptera (bugs), Insect larvae, and Odonata. Specifically, such results indicate that the syntopic anurans L. magnus, P. grandocula, M. stejnegeri, O. laevis, A. muelleri, S. mearnsi, and S. natator are generalist predators. The observed consumption of these prey categories was also observed in other Philippine anuran species (Almeria & Nuñeza Reference Almeria and Nuñeza2013) and other southeast Asian anurans (Inger & Greenberg Reference Inger and Greenberg1966, Direp et al. Reference Direp, Das and Haas2009, Ngo et al., Reference Ngo, Lee and Ngo2014, Le et al. Reference Le, Rowley, Tran, Vo and Hoang2018). Moreover, our data indicated that A. muelleri exclusively selected ant prey into large volumetric quantities across sampling months, confirming myrmecophagy of the southeast Asian bufonid (Direp et al. Reference Direp, Das and Haas2009).
Sympatric anuran species with similar patterns of microhabitat use exhibit high dietary overlap and narrow trophic niche breadth (Moser et al. Reference Moser, Gottschalk, Loebmann, dos Santos, Miranda, Rosa and Tozetti2017). We found a generally low interspecific dietary niche overlap and narrow trophic niche breadth between and among L. magnus, P. grandocula, M. stejnegeri, O. laevis, A. muelleri, S. mearnsi, and S. natator from both low- and mid-elevation sites. The low dietary niche overlaps and narrow niche breadth could be attributed to the overlaps of microhabitat preferences (Delima et al. 2007, Ates & Delima Reference Ates and Delima2008, Nuñeza et al. Reference Nuñeza, Ates and Alicante2010, Plaza & Sanguila Reference Plaza and Sanguila2015, Coritico et al. Reference Coritico, Sinambahan, Mohagan and Amoroso2018) and a species selection of specific prey items (Toft Reference Toft1985, Das Reference Das1996, Hirai & Matsui Reference Hirai and Matsui2000a, Reference Hirai and Matsui2000b, Vignoli & Luiselli Reference Vignoli and Luiselli2012) that may minimise competition for food resources (Toft Reference Toft1985, Lima & Magnusson Reference Lima and Magnusson1998, Cloyed & Eason Reference Cloyed and Eason2017).
At mid-elevation site, high dietary niche overlaps were observed between A. muelleri, L. magnus, and P. grandocula when Formicidae (ants) form a high proportion of these species’ diet during sampling months of April, June, and July. Based on our available dietary data, we argue that the high dietary niche overlaps and strong competition for Formicidae (ants) among these anuran species may be diffused and temporary, since the large-bodied anurans L. magnus and P. grandocula were also found to consume other insects, invertebrates, or vertebrate prey groups. In addition, the diet of these anuran species is not restricted to consuming ants or even beetles, in contrast with small-bodied A. muelleri. This observed dietary pattern in A. muelleri, L. magnus, and P. grandocula maybe reflective of the local availability of abundant prey categories (Toft Reference Toft1981, Reference Toft1985, Lima Reference Lima1998, Lima & Magnusson Reference Lima and Magnusson1998, Reference Lima and Magnusson2000, Ngo et al., Reference Ngo, Lee and Ngo2014) or indicative of a possible seasonal prey availability (Toft Reference Toft1980a, Reference Toft1980b, Lima & Magnusson Reference Lima and Magnusson1998, Hirai & Matsui Reference Hirai and Matsui2000b, Reference Hirai and Matsui2001b).
We provide supporting evidence for our SCA as revealed in our SIA to further describe food resource partitioning in the low-elevation samples of P. grandocula, L. magnus, and O. laevis to its potential prey sources. Our SIA verified our SCA results that P. grandocula, L. magnus, and O. laevis consumed varied insect prey categories, thus are confirmed generalist predators (Wells Reference Wells2007, Toft Reference Toft1980a, Reference Toft1981, Hirai & Matsui Reference Hirai and Matsui2000b, Reference Hirai and Matsui2001a, Hirai & Matsui Reference Hirai and Matsui2001b).
Syntopic anuran species with a large body and mouth gape which consumes a wide array of available prey is hypothesised to have a broad trophic niche width (Lima Reference Lima1998, Whitfield & Donnelly Reference Whitfield and Donnelly2006, Huckembeck et al. Reference Huckembeck, Winemiller, Loebmann and Garcia2018). Our SIA results showed that the larger-bodied P. grandocula, L. magnus and the smaller-bodied O. laevis exhibit diverse dietary composition. In addition, O. laevis had a high assimilation of Araneae sp. 3 (spider). We hold inference on the trophic niche of the aforementioned anurans since we did not quantify trophic niche breadth based on our stable isotope data. However, we emphasise that the low- and mid-elevation stream anurans P. grandocula and L. magnus (Delima et al. Reference Delima, Diesmos and Ibañez2007, Plaza & Sanguila Reference Plaza and Sanguila2015), and O. laevis (Nuñeza et al. Reference Nuñeza, Ates and Alicante2010) all exhibit overlaps of microhabitat preferences. Whether the microhabitat preferences overlap of P. grandocula, L. magnus, and O. laevis is attributed to a possible wide trophic niche breadth of these large- and small-bodied anurans (Huckembeck et al. Reference Huckembeck, Winemiller, Loebmann and Garcia2018) is pending further studies.
Larger species are generally considered to have more enriched 15N values indicating that they occupied higher trophic positions (Michener & Schell Reference Michener, Schell, Lajtha and Michener1994, Verburg et al. Reference Verburg, Kilham, Pringle, Lips and Drake2007). Noteworthy, the smaller-bodied O. laevis were the most enriched in δ 15N values when compared to larger-bodied anurans L. magnus and P. grandocula, which suggests that O. laevis occupied a higher trophic level than L. magnus and P. grandocula. Furthermore, the nitrogen isotopic signature of O. laevis (mean δ 15N = 7.651‰) is comparable and within the observed range of δ 15N values of O. lima (5.62 to 8.65‰), in tropical ponds of Thailand (Kupfer et al. Reference Kupfer, Langel, Scheu, Himstedt and Maraun2006).
In summary, our results showed that syntopic anurans co-occurring in stream habitats partition food resources and presumably limit competition to facilitate co-existence in the same ecological community. Stomach content and stable isotope analyses revealed that food resource partitioning is associated with varied selection of available prey. We consider stream anurans as one feeding guild and highlight its important ecological role as generalist predators in riparian communities. However, our interpretation of the dietary niche results based on SCA should be treated with caution because some of the sample sizes were small in some of the anurans studied. The inferred trophic niche and relationships of anurans — and their interacting species — could be used as basis for ecosystem-based conservation to understand amphibian communities at different elevations and contribute to the maintenance of self-sustaining insect prey and anuran populations for species persistence in watershed ecosystems, which is critically important for ecosystem services.
Supplementary material
To view supplementary material for this article, please visit https://doi.org/10.1017/S0266467421000158
Acknowledgements
We thank the Department of Environment and Natural Resources-Caraga Regional Office for the assistance in logistical details for the conduct of the fieldworks and issuance of specimen collection permits (DENR Permit No. R13-2016-007) to J. L. Plaza, the Local Government Units of Pianing and Anticala, Indigenous and Local Tribal Council of Anticala and Pianing. Bonifacio Pasion for his assistance with R, Janrick Inchoco, Jeszyrus Plaza, local guides and porters of Pianing and Anticala for their valuable assistance during fieldwork and data collection, Japhet Anunciado for the map, Eddie Mondejar and Milton Medina for the identification of insects and invertebrates, Rafe M. Brown (University of Kansas), Christine Cherry Solon (Department of Biological Sciences, MSU-IIT), Thomas von Rintelen, Hendrik Freitag, Marivene Santos and Astrid Sinco of the Biodiversity teaching in a Philippine-Cambodian-German network (BIO-PHIL) Module 1 (DAAD Grant No. 57393541), Alex Kupfer and Arvin Diesmos for constructive comments on previous drafts of the manuscript.
Financial Support
This work was funded by the Philippine Department of Science and Technology-Science Education Institute Outright and Student Research Support Fund (SRSF), The Rufford Foundation (Grant Reference No. 21083-1) to J. L. Plaza. The Philippine Commission on Higher Education-Institutional Development and Innovation Grant (CHED-IDIG; CMO No. 33 Series of 2016) to M. B. Sanguila, and the Food Webs Project of E. B. Metillo.