Introduction
Loneliness has been considered a psychosocial chronic stressor that can harm both physical and mental health (Jaremka et al., Reference Jaremka, Fagundes, Glaser, Bennett, Malarkey and Kiecolt-Glaser2012). Cross-sectional and longitudinal studies indicate that loneliness is related to increased mortality risk (Luo et al., Reference Luo, Hawkley, Waite and Cacioppo2012), high blood pressure (Hawkley et al., Reference Hawkley, Thisted, Masi and Cacioppo2010), higher risk for immune dysregulation, higher level of pain and fatigue (Jaremka et al., Reference Jaremka, Fagundes, Glaser, Bennett, Malarkey and Kiecolt-Glaser2012), and a generalized decline in physical competence (Pinquart and Sörensen, Reference Pinquart and Sörensen2001). The relationship between loneliness and functional autonomy can be reciprocal; loneliness may trigger poor functional autonomy, and loneliness may itself result from restricted social interactions due to poor functional autonomy (Luo et al., Reference Luo, Hawkley, Waite and Cacioppo2012). In regard to mental health, recent studies have also shown that loneliness is related to depression (Cohen-Mansfield and Parpura-Gill, Reference Cohen-Mansfield and Parpura-Gill2007; Losada et al., Reference Losada, Márquez-González, García-Ortíz, Gómez-Marcos, Fernández-Fernández and Rodríguez-Sánchez2012), suicidal ideation (Cukrowicz et al., Reference Cukrowicz, Cheavens, Van Orden, Ragain and Cook2011), impaired global cognition, and progression of Alzheimer's disease (Holwerda et al., Reference Holwerda, Deeg, Beekman, van Tilburg, Stek, Jonker and Schoevers2012). For example, Holwerda et al. (Reference Holwerda, Deeg, Beekman, van Tilburg, Stek, Jonker and Schoevers2012) showed that older adults with feelings of loneliness had a 64% greater risk of dementia. In cancer patients, feelings of loneliness are a major risk of depression due to their negative effects on the immune system (Jaremka et al., Reference Jaremka, Fagundes, Glaser, Bennett, Malarkey and Kiecolt-Glaser2012)
Regarding subjective well-being, loneliness has consistently been associated with higher levels of negative affect, and lower levels of positive affect and satisfaction with life. Their reciprocal effects have also been supported using longitudinal data (VanderWeele et al., Reference VanderWeele, Hawkley and Cacioppo2012). Meta-analyses carried out by Pinquart and Sörensen (Reference Pinquart and Sörensen2001) found that the main sociodemographic and behavioral risk factors of loneliness were: being female, widowhood, low income and educational level, living alone, poor social integration, reporting deficits in the quality of social contacts, low social support, and low competence and activity.
More interestingly, the negative effects of loneliness go beyond the individual, and can be considered a serious public health problem. For example, some authors have indicated that individuals suffering loneliness increase the use and costs of the healthcare system; they visit their general practitioner more frequently, take more medication, and have a higher incidence of falls (Pitkala et al., Reference Pitkala, Routasalo, Kautiainen and Tilvis2009).
The measurement of loneliness and the Rasch model
The most widely used instrument in Europe for measuring loneliness is the 11-item De Jong Gierveld Loneliness Scale (DJGLS; de Jong Gierveld and Kamphuis, Reference de Jong Gierveld and Kamphuis1985) composed of six items formulated negatively and five items formulated positively. At a theoretical level, the scale was developed “to assess severe feelings of loneliness as well as less intense loneliness feelings, and represent a latent continuum of deprivation” (p. 290). At a methodological level, the scale was developed “to meet the criteria of the Rasch model” (p. 289). Subsequently, some studies have supported the existence of two subscales more homogeneous than the general scale (van Baarsen et al., Reference van Baarsen, Snijders, Smit and Van Duijn2001). The first subscale, composed of positively worded items, and called social loneliness, assesses feelings of sociability and the existence of meaningful relationships. The second, composed of the negatively worded items, and called emotional loneliness, relates to feelings of abandonment and missing companionship. However, these studies highlighted that the distinction between these two factors may be due to a methodological artefict such as the response set.
From the Classical Test Theory (CTT), confirmatory factor analysis (Buz et al., in press; Grygiel et al., Reference Grygiel, Humenny, Rebisz Switaj and Sikorska2012) revealed that the 11-item DJGLS was essentially unidimensional, measuring primarily and overall, general loneliness. These studies showed that some items had very low factor loadings, and some cross-loadings, and therefore their use in measuring social or emotional loneliness would be inappropriate. Paradoxically, although the DJGLS was developed as a Rasch-type scale, the examination of its psychometric properties using this model has been almost non-existent. To our knowledge, only two studies have been conducted. The first one (Ayala et al., Reference Ayala2012) reported that the 6-item version of the DJGLS was a unidimensional scale, with acceptable reliability, although the fit to the Rasch model was not as good as expected. The second one (Buz and Prieto, Reference Buz and Prieto2013) found similar results using the 11-item version, although the nature of the sample, and certain methodological limitations, do not allow the generalization of the results, and only a limited examination of its external validity.
The Rasch model is a prescriptive model to which the data need to be fitted. Thus, the probability, P, of endorsing an item i by a person n is a logistic function of the difference between the location for the person ability B n (e.g. loneliness) and the location for the item difficulty Di along a common continuum of measurement. Person ability is used generically to refer to what we are measuring about the individuals (e.g. loneliness), and item difficulty is used generically to refer to what we are measuring about the items (e.g. the level of loneliness expressed by the item). For dichotomous items, this location is the point at which each category (e.g. yes/no) has a 50% probability of being endorsed (Linacre, Reference Linacre2011). Item calibration defines the hierarchical order of difficulty (“severity”) of the items along the latent continuum, and it is expressed in logits positioned along a hierarchical scale. Logits of greater magnitude represent increasing item difficulty. Two essential major assumptions of the model are: (1) unidimensionality, i.e. latent variable can be represented on a single dimension where persons and items are conjointly located (so-called “person-item map”), and (2) local independence (i.e. the likelihood of the person correctly answering an item is independent from the other items in the test). Furthermore, the parameter estimators in the Rasch model are sufficient, that is, the total score is a sufficient statistic for estimating a person's level in a trait (e.g. loneliness), and the number of persons passing an item is a sufficient statistic for estimating item difficulty (Rasch, Reference Rasch1960). Person's ability and item difficulty are separate parameters. That is, the parameter that characterizes an item does not depend on the ability distribution of the persons, and the person's parameters do not depend on the set of test items (so-called “test-free” and “person-free” measurement, respectively).
The statistical methods based on the CTT present some weaknesses in assessing the internal structure of the DJGLS. The main weakness is that the factor analytic approach is not based on sample-distribution free and item-distribution free measures. It is important to use alternative methods of psychometric analysis in order to achieve significant improvements in terms of the precision of the psychological measures. Thus, the objective of this study was to examine the construct validity and measurement invariance of the Spanish version of the DJGLS by means of Rasch analysis. We further examined its convergent and discriminant validity. Based on previous findings (Buz et al., in press; van Baarsen et al., Reference van Baarsen, Snijders, Smit and Van Duijn2001; Prieto-Flores et al., Reference Prieto-Flores, Forjaz, Fernandez-Mayoralas, Rojo-Perez and Martinez-Martin2011; Grygiel et al., Reference Grygiel, Humenny, Rebisz Switaj and Sikorska2012), we expected that the DJGLS scores would relate to high levels of self-rated loneliness, depression and negative affect, and low levels of positive affect and satisfaction with life. We also expected the scale to have the ability to detect differences in loneliness among various population sub-groups: females, widows, those with poor health, older adults living alone, those with low educational level, a low number of nuclear family members, low emotional support, low satisfaction with their social relationships, and low social participation (Buz et al., in press; Pinquart and Sörensen, Reference Pinquart and Sörensen2001; Sánchez et al., Reference Sánchez, de Jong Gierveld and Buz2012).
Methods
Sample and procedure
Participants were Spanish community-dwelling adults aged 60 and older living in Salamanca. A stratified sampling with equal allocation was used based on the municipal census in 2008. For the final selection of sample units, quotas were established to achieve an approximately equal distribution of male and female respondents across two age groups (60–74; 75+). Data were gathered from 601 older adults (a response rate of 66.77%). Participants with missing values in demographic variables were discarded (n = 16). The results reported here refer to 585 participants. All households were visited by trained interviewers that explained to the participants the purpose of the study, asked permission to carry out the interview, and obtained the informed consent. After obtaining their approval, the interviews were carried out at the respondent's home. The exclusion criterion was impaired cognitive capacity as measured with the Mini-Mental State Examination (MMSE < 23). The study was approved by the Ethics Committee of the University of Salamanca. Participants were not paid for their participation.
Measures
Besides the sociodemographic variables, the survey included the following measures:
The 11-item De Jong Gierveld Loneliness Scale (DJGLS; de Jong Gierveld and Kamphuis, Reference de Jong Gierveld and Kamphuis1985; adapted by Buz and Prieto, Reference Buz and Prieto2013) with three answering categories: 3 = yes, 2 = more or less, 1 = no. Scale scores are based on dichotomous item scores. Responses have to be dichotomized by counting neutral and positive answers (i.e., more or less, yes) to the negatively worded items, and neutral and negative answers (i.e., more or less, no) to the positively worded items. The total score ranges from 0 = not lonely to 11 = extremely lonely, which can be categorized in four levels: not lonely (0–2), moderate lonely (3–8), severe lonely (9–10), and very severe lonely (11) (see de Jong Gierveld and van Tilburg, Reference de Jong Gierveld and Van Tilburg2011). Similarly to van Baarsen et al. (Reference van Baarsen, Snijders, Smit and Van Duijn2001) we also asked participants to rate their levels of loneliness using a 4-point Likert-type scale from 1 = not lonely to 4 = very severe lonely.
Emotions were measured with the Positive and Negative Affect Schedule (PANAS; Watson et al., Reference Watson, Clark and Tellegen1988). The PANAS is an adjective checklist with 10 items for positive affect (PA) and 10 for negative affect (NA). Items were rated on a 5-point Likert scale from 1 = not at all or very slightly to 5 = very much. Previous studies with older adults have reported Cronbach's α of 0.89 for both PA and NA (e.g. Ready et al., Reference Ready, Vaidya, Watson, Latzman, Koffel and Clark2011). In the present study, the reliability for PA was 0.93, and for NA was 0.83.
Depression was measured with the 8-item Spanish version of the Geriatric Depression Scale (Yesavage et al., Reference Yesavage, Brink, Rose, Lum, Huang, Adey and Leirer1983, adapted by Buz, Reference Buz1996). Participants were asked to answer the questions using a dichotomous response (1 = yes, 0 = no). The total score ranged from 0 to 8 points, with higher scores indicating more depressive symptoms. This scale showed good psychometric properties with Spanish samples, with a reliability of 0.83 (Buz et al., in press). In this study, the α-value was 0.93.
Satisfaction with life was measured with the 5-item Satisfaction with Life Scale (SWLS; Diener et al., Reference Diener, Emmons, Larsen and Griffin1985, Spanish version provided by Diener, Reference Diener2009). Each item was rated on a 5-point Likert scale from 1 = strongly disagree to 5 = strongly agree. Higher scores indicated more satisfaction with life. Previous studies have reported satisfactory reliability values (α = 0.81) (Buz et al., in press). In this study, the reliability was 0.85.
Health was assessed with two measures: (a) A single item of self-rated health on a 5-point Likert scale from 1 = very bad to 5 = excellent, and (b) the scale of activities of daily living scale (ADLs; Deeg et al., Reference Deeg, Beekman, Kriegsman and Westendorp-de Serière1998) developed for the Longitudinal Aging Study Amsterdam (LASA) which has shown adequate psychometric properties (Buz et al., in press). It comprises five items of basic and instrumental activities rated on a 5-point Likert-type scale from 1 = I can't perform it to 5 = without difficulty. The average score for the five items was calculated. The α-value obtained in this study was 0.95.
Structural characteristics of social networks were measured by means of (a) marital status (1 = single, 2 = divorced, 3 = widowed, 4 = married), (b) number of children (as a quantitative variable), (c) living arrangements (1 = living alone, 2 = living with others, 3 = living with children, 4 = living with partner and children, 5 = living with a partner), and (d) social network size, differentiating three domains of social relationships: nuclear family (spouse and children), extended family (brothers and sisters, nephews/nieces), non-kin (friends). Network size was calculated by adding up the number of members identified in each domain.
Functional and qualitative aspects of social support were measured by means of the emotional support received from each member and the domain was measured with the question (“How often did you talk to your. . . about your personal problems or feelings?”) on a 4-point scale from 1 = never to 4 = often. Satisfaction with the relationships with each member was measured with the question (“How satisfied are you with your relation with your. . . .?”) on a 4-point scale from 1 = not at all satisfied to 4 = very satisfied. For emotional support and satisfaction, a mean score was calculated for each domain.
Social activity was measured with one question about belonging to associations (e.g. cultural or sport) (1 = yes; 0 = no), another question on participation in leisure activities organized by formal or informal groups (1 = yes; 0 = no), and a third question on the frequency of attending bars and cafés with answers ranging from 1 = never to 4 = daily.
Statistical analyses
First, unidimensionality was assessed by examining (a) response patterns using fit statistics, (b) point-measure (PTMEA) correlations, (c) patterns among the standardized residuals using principal component analysis (PCA) without rotation, and (d) the presence of DIF. Fit statistics to test assumptions of fundamental measurement included the average mean square (MNSQ) of persons and items determined for both infit (weighted by the distance between the person location -loneliness level- and item difficulty -severity level-) and outfit (an unweighted measure reflecting unexpected responses to items with a loneliness severity level markedly different from one's loneliness level). Thus, the MNSQ reflects how well the data fit the Rasch model. Outfit statistics are influenced by unexpected responses made by persons on items that are not targeted for their latent trait level. Infit statistics are influenced by unexpected patterns of responses made by persons on items targeted for their ability level. The misfit is considered to be moderately high if these statistics range between 1.5 and 2.0 (Linacre, Reference Linacre2011). We adjusted MNSQ by sample size and test length. The corrected critical range for infit was 1 ± 0.12, and for outfit,1 ± 0.35. Point-measure (PTMEA) correlation, which indicates how each item is contributing to the measure, ranges from -1 to 1. Items with negative values show that they do not function as intended. A variance of 50% or greater in PCA accounted for by the first dimension is considered to be good. The second dimension should have at least three items, and the eigenvalue of the first component of residuals should be approximately 2.0 or lower (Linacre, Reference Linacre2011). We examined measurement invariance by means of differential item functioning (DIF) across age (60–74 vs. 75+ years), gender (male vs. female), marital status (married vs. non-married), parental status (having children vs. no children), and living arrangements (living alone vs. accompanied). DIF examines whether items perform similarly across different groups. Its presence suggests a violation of the assumptions of the model because it is likely that factors outside the construct are spuriously affecting DJGLS scores. Items were evaluated in terms of Bonferroni-adjusted statistical significance (0.05/11).
Second, we measured the appropriateness of item difficulty for the sample. The difficulty parameter (Di) and person-item map show how easy or how difficult an item is, and whether the person-item targeting is adequate.
Third, we measured Person Separation Reliability (PSR) to estimate the degree to which the DJGLS discriminates persons into enough levels, and Item Separation Reliability (ISR) to estimate the ability to define a distinct hierarchy of items along the loneliness scale. PSR and ISR ranges from 0 to 1, with higher values indicating better reliabilities. Rasch analysis was performed using the software WINSTEPS software (Linacre, Reference Linacre2011).
Finally, we examined convergent and discriminant validity based on the associations of the scale with other subjective well-being measures and the ability of the scale to discriminate between different groups of older adults as we hypothesized was examined by means of ANOVAs and regression analyses. Statistical analyses were performed using SPSS version 21 for Windows.
Due to the nature (dichotomous or Likert-type scales) and asymmetry of the distributions, we calculated the reliability of the scales from the polychoric correlations matrix using the non-linear procedure implemented in FACTOR 8.1 (Lorenzo and Ferrando, Reference Lorenzo-Seva and Ferrando2006) which provided more accurate estimations.
Results
Descriptive characteristics of the participants
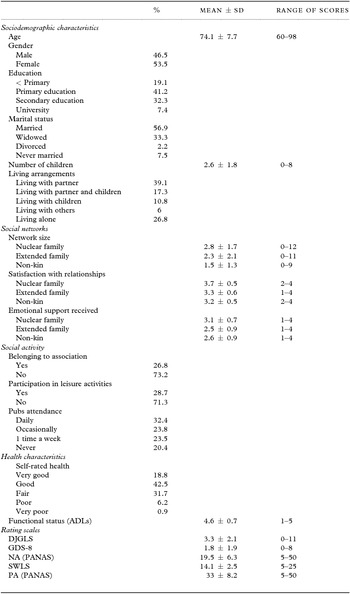
Table 1 shows the sociodemographic characteristics, health status, and the scores of participants in the measurement instruments. In short, the mean and standard deviation (M ± SD) age was 74.11 ± 7.92 years (range = 60–98). The proportion of females was 53.50%. Most of the sample was married (56.9%) and had children (M ± SD = 2.61 ± 1.80). More than half of the participants were living with their partner, and 26.8% were living alone. Approximately 20% of the sample had less than primary education, and 73.5% had primary or secondary education.
Descriptive statistics of the sample (N = 585): Sociodemographics, social networks, social participation and health characteristics, and applied rating scales

SD = standard deviation; ADLs = activities of daily living; DJGLS = De Jong Gierveld loneliness scale; GDS-8 = 8-item geriatric depression scale; NA = negative affect (10-item subscale of the PANAS); SWLS = satisfaction with life scale; PA = positive affect (10-item subscale of the PANAS)
Dimensionality and psychometric properties of the scale
To measure the persons and items validity, we tested whether the data fit the Rasch model reasonably well examining the infit and outfit statistics. Person fit statistics showed adequate person-response validity (for infit: MNSQ = 1.00; SD = 0.34; for outfit: MNSQ = 0.96, SD = 0.69). Person standard errors were low (SE = 0.12–1.10). The percentage of misfitting persons was very low (4.44%), indicating that persons’ responses fit the model adequately.
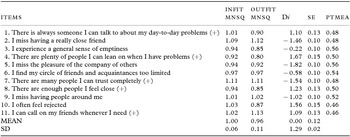
Item fit statistics (Table 2) revealed a perfect fit or very close fit to the model (for infit: MNSQ = 1.00, SD = 0.06; for outfit: MNSQ = 0.96, SD = 0.11). The infit values oscillated between 0.92 and 1.11, and the outfit values between 0.80 and 1.13, indicating that they were inside the corrected critical range. Hence, all items were productive for measurement. Item standard error ranged from 0.10 to 0.15, indicating that item reliabilities were high. Moreover, all items had positive and moderate item-total correlation (PTMEA: 0.46–0.56). Therefore, the fit of persons and items to the Rasch model was adequate and data indicated an overall acceptable fit.
Item fit statistics of the DJGLS

SD = standard deviation; δ = item location (loneliness severity level); MNSQ = Mean-square-fit statistic; SE = standard error; PTMEA = point-measure correlation between participants’ scores on each item and their overall trait level based on the Rasch calibrated item scores and total scores. Items with (+) must be reversed before scoring.
PCA showed that the Rasch model explained nearly 60% of the raw variance, and that the first contrast had an eigenvalue of 2.1, which represents 6.1% of the unexplained variance. Although it was accounting for a low-moderate amount of the unexplained variance, the eigenvalue suggested a unidimensional latent variable.
The DJGLS did not display DIF either across age, gender, parental status nor health. However, we found DIF across marital status and living arrangements. Given identical levels of loneliness, item 3 (“I experience a general sense of emptiness”), item 5 (“I miss the pleasure of the company of others”), and item 9 (“I miss having people around me”) are easier to agree with for non-married individuals and those living alone, while item 7 (“There are many people I can trust completely”) was easier to agree with for married respondents and those living with at least one person. Tentatively, we tested the effects of removing items that displayed DIF. As a result, item reliability remained high (0.99) in all cases, but person reliability decreased to a low level (0.62, 0.59, 0.61 and 0.62, when items 3, 5, 7, and 9 were removed, respectively). When we removed the four items simultaneously, person reliability decreased to an unacceptable level (0.37). We did not observe improvements for infit and outfit statistics or explained variance after deleting these items.
As can be seen in the item hierarchy (D i ) of the DJGLS (Table 2), the most difficult items were item 4 (D i = 1.67; “There are plenty of people I can lean on when I have problems) and item 10 (D i = 1.56; “I often feel rejected”), with low-lonely persons having low probabilities of endorsing them, while the easiest was item 5 (D i = −1.82; “I miss the pleasure of the company of others”), with many persons having at least a moderate probability of endorsing it.
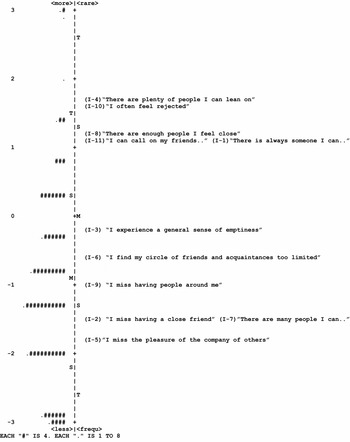
The Rasch person-item map showed that the distribution of person logit positions was positively skewed (Figure 1) indicating that the items were difficult for the older adults to endorse. The figure showed that the items were reasonably targeting the persons. However, the map also revealed the lack of items to measure individuals with low levels of loneliness accurately. More interestingly, there was a gap for items between D i = −0.22 and D i = 1.09 indicating that some individuals were not being adequately measured. The extreme points of the map revealed that older adults with higher levels of loneliness were measured with more precision with items such as “I often feel rejected” while older adults with low levels of loneliness are better measured with items such as “I miss the pleasure of the company of others.”
Person-item map of the DJGLS. The left side shows older adults, from the higher level of loneliness at the top to the lower at the bottom, and the right side shows items, from the most difficult at the top to the least difficult at the bottom.

When we examined reliability, item reliability was 0.99, and therefore the DJGLS items were measured with high precision. Person reliability was 0.65, close to the recommended level, and the person raw score reliability (equivalent to Cronbach's α) was 0.71. The person mean was −0.96, indicating that the items were difficult, on average, for persons to agree with.
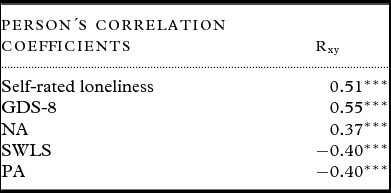
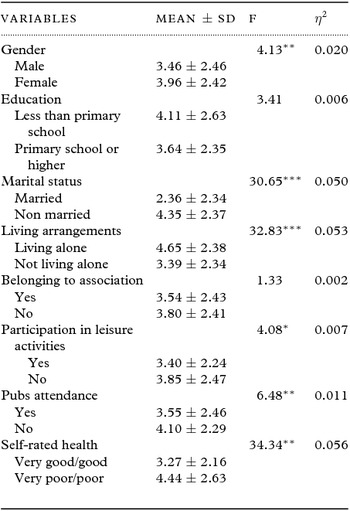
As expected, the results regarding the convergent and discriminant validity showed that the DJGLS correlated positively with depression, self-rated loneliness, negative affects, and negatively with satisfaction with life and positive affects (Table 3). ANOVAs revealed that the scale differentiated between known-groups with different levels of loneliness: as we expected, higher scores were found in female, non-married, older adults living alone, with poor self-rated health, and not participating in social activities, specifically not attending pubs (Table 4). Complementarily, regression analysis introducing quantitative variables partially supported our hypothesis, since loneliness was associated with functional status (β = −0.27, p < 0.001), nuclear family network size (β = −0.12, p < 0.05), and satisfaction with the relationships with the nuclear family members (β = −0.26, p < 0.001), but not with the emotional support received.
External validity of the DJGLS

*** < 0.001 in all cases.
GDS-8 = 8-item geriatric depression scale; NA = negative affect (10-item subscale of the PANAS); SWLS = satisfaction with life scale; PA = positive affect (10-item subscale of the PANAS)
Known-groups validity of the DJGLS

*** < 0.001; ** < 0.01; * < 0.05.
SD = standard deviation; η2 = effect size.
Discussion
The aim of the present study was to examine the psychometric properties and measurement invariance of the 11-items DJGLS, and its external validity. To date, the DJGLS has been examined mainly by means of factorial techniques that have found mixed results about its internal structure. The scarce studies carried out from the perspective of the Rasch model have reported inconclusive findings. All these studies have highlighted different problems in several items related to low factor loadings, item bias and misfit.
Overall, our results support previously reported findings indicating an essential (i.e. sufficient) unidimensionality of the DJGLS (e.g. Ayala et al., Reference Ayala2012). Person fit statistics, item fit statistics and PTMEA suggest that the empirical data had an acceptable fit to the Rasch model. Additionally, Rasch residual-based PCA suggested that all items were measuring the same construct. These results give additional support to those reported by Buz et al. (in press), Grygiel et al. (Reference Grygiel, Humenny, Rebisz Switaj and Sikorska2012). However, the presence of DIF was the main threat to unidimensionality. The DJGLS showed DIF across marital status and living arrangements. The presence of item bias has been reported previously (e.g. van Baarsen et al., Reference van Baarsen, Snijders, Smit and Van Duijn2001; de Jong Gierveld and van Tilburg, Reference de Jong Gierveld and Van Tilburg2010; Ayala et al., Reference Ayala2012; Grygiel et al., Reference Grygiel, Humenny, Rebisz Switaj and Sikorska2012; Buz and Prieto, Reference Buz and Prieto2013). When we ran the analyses removing the biased items to determine whether the psychometrics properties of the scale would improve, we neither found an improvement in overall fit to the model nor in person-item reliability. So, taking a conservative stance, instead of removing items, we would suggest that items 3, 5, 7 and 9 be revised. The accumulation of evidences on DIF will provide additional support for deleting these items. In any case, it should be taken into account that, unfortunately, short tests suffer from low measurement precision, leading to inevitable dilemmas.
Regarding the appropriateness of the items to the sample, the item difficulty values showed a sufficient range of difficulty from the most difficult items (item 4; “There are plenty of people I can lean on when I have problems”) to the easiest (item 5; “I miss the pleasure of the company of others.”) Particularly, findings about the most difficult items are in line with those reported by Buz and Prieto (Reference Buz and Prieto2013), de Jong Gierveld and van Tilburg (Reference de Jong Gierveld and Van Tilburg2010), and by van Baarsen et al. (Reference van Baarsen, Snijders, Smit and Van Duijn2001). That is, according to the original aim of the de Jong Gierveld and Kamphuis (Reference de Jong Gierveld and Kamphuis1985), higher levels of loneliness were associated with feelings of abandonment and the lack of intimate network members who provide social support when needed. By contrast, because of the changes in living arrangements in old age, the probability of endorsing an easy item such as “I miss the pleasure of the company of others” is high for a wide range of persons.
The person-item map showed that the DJGLS permits a reliable assessment of the loneliness level since the range of item difficulty and person's ability had a reasonable overlap. One concern was related to the ability of the scale to discriminate among older adults along the continuum of the latent variable. Although the range of item difficulties was acceptable (D i from -1.54 to 1.67) the items did not provide accurate measures to discriminate among the older adults with lower levels of loneliness. It is also important to note the gap between item 3 (“I experience a general feeling of emptiness”) and item 11 (“I can call on my friends whenever I need”), indicating that persons with locations between 0 and 1.0 were not being measured adequately. Similarly to results reported by Ayala et al. (Reference Ayala2012), our skewed distribution (a floor effect) can probably be related to the characteristics of our sample: community dwelling-older adults with a satisfactory social network. Moreover, because loneliness is socially stigmatized, some older adults might be reluctant to admit that they feel lonely (de Jong Gierveld and Kamphuis, Reference de Jong Gierveld and Kamphuis1985). Hence, in contrast to recent developments to shorten the scale, and considering that the 11-item DJGLS is psychometrically a short scale, we strongly recommend the addition of a few easier items in order to improve the measurement range.
Perhaps the major concern with the DJGLS is the low, although acceptable, person separation reliability statistic (PSR = 0.65). This implies that the DJGLS was not sensitive enough to distinguish among older adults in four levels of loneliness as originally intended. The reported person reliability coefficient was not surprising because (a) the sample was mainly comprised of socially well-integrated older adults, thus lowering the variance in loneliness, (b) the scale was short, (c) the total scores were based on dichotomous response categories, and (d) as the person-item map showed, the sample-item targeting had some “gaps.” Because similar acceptable person reliability statistics were reported in Spanish samples (e.g. Ayala et al., Reference Ayala2012; Buz and Prieto, Reference Buz and Prieto2013), future studies should consider the inclusion of different methodological strategies to examine their effects on person reliability.
The examination of the convergent and discriminant validity was satisfactory, with linear relations among variables as expected. In line with growing research, loneliness was highly correlated with depression (Cohen-Mansfield and Parpura-Gill, Reference Cohen-Mansfield and Parpura-Gill2007; Cukrowicz et al., Reference Cukrowicz, Cheavens, Van Orden, Ragain and Cook2011; Grygiel et al., Reference Grygiel, Humenny, Rebisz Switaj and Sikorska2012; Jaremka et al., Reference Jaremka, Fagundes, Glaser, Bennett, Malarkey and Kiecolt-Glaser2012; Losada et al., Reference Losada, Márquez-González, García-Ortíz, Gómez-Marcos, Fernández-Fernández and Rodríguez-Sánchez2012). This finding provides additional evidence to the studies that point out significant associations between loneliness and depression, and highlights the need to consider the measurement of loneliness for a better understanding of mental health in the elderly. For example, Cukrowicz et al. (Reference Cukrowicz, Cheavens, Van Orden, Ragain and Cook2011) found that loneliness was a strong predictor of suicide risk, and Jaremka et al. (Reference Jaremka, Fagundes, Glaser, Bennett, Malarkey and Kiecolt-Glaser2012) demonstrated that feelings of loneliness reactivated herpesviruses -indicating dysregulated cellular immunity- thus increasing the risk for depression. In this line, the theoretical framework developed by Cohen-Mansfield and Parpura-Gill (Reference Cohen-Mansfield and Parpura-Gill2007) has shown the mutual relationship between loneliness and depression and their common predictors. Similarly to van Baarsen et al. (Reference van Baarsen, Snijders, Smit and Van Duijn2001), the DJGLS scores and the self-rated loneliness item were highly correlated as well, suggesting a good content validity of the DJGLS. Additionally, moderate to high associations were found between loneliness and positive and negative emotions, and satisfaction with life, suggesting that loneliness is an important component of subjective well-being.
Regarding the discriminant validity, in line with de Jong Gierveld and van Tilburg (Reference de Jong Gierveld and Van Tilburg2010), and van Baarsen et al. (Reference van Baarsen, Snijders, Smit and Van Duijn2001) our results indicate that the DJGLS can be used to identify the following population subgroups at risk for loneliness: females, older non-married adults, living alone, with poor objective and subjective physical health, small nuclear family network size, low satisfaction with the relationships with the nuclear family, and with low social activity. The results also supports previous findings from Losada et al. (Reference Losada, Márquez-González, García-Ortíz, Gómez-Marcos, Fernández-Fernández and Rodríguez-Sánchez2012) that showed that being a woman, living alone, having low perceived health and low satisfaction with social contacts were the main predictors of loneliness among Spanish older adults. As they stated, satisfaction with social contacts emerges as a central variable in the explanation of loneliness among the elderly and highlights the importance of assessing older adults’ subjective perception of their social networks. Our study is also the first one to provide empirical support for the discriminative validity of the scale found by Ayala et al. (Reference Ayala2012) -6-item version- across marital status, living arrangements and health reported in a Spanish sample, and extends this evidence across gender, social network size, social network quality, and social activity. Unfortunately, there are no previous results to compare our findings about the external validity of the 11-item Spanish version of the scale.
Limitations of the study
This study has several limitations that should be considered. We used a local sample, which limits somewhat the generalizability of the results to other populations. Additional studies should be carried out based on nationally representative samples. The scale was applied by face-to-face interviews. Due to the social stigma associated with loneliness, this procedure could partially explain the low scores of loneliness. The use of the scale in a self-administered questionnaire could most likely result in higher scores. The original authors of the scale reported evidences pointing in this direction (de Jong Gierveld and van Tilburg, Reference de Jong Gierveld and Van Tilburg2011). Despite the efforts made in the translation process from Dutch, item validity could be compromised due to the content of some items. In this regard, van Baarsen et al. (Reference van Baarsen, Snijders, Smit and Van Duijn2001) also highlighted the ambiguity of the social or emotional component of the items, thus making the examination of the internal structure of the scale more difficult. Similarly, Grygiel et al. (Reference Grygiel, Humenny, Rebisz Switaj and Sikorska2012) found that not all the positive items defined social loneliness and not all negative items defined emotional loneliness. Despite the presence of DIF we did not deeply examine it by means of different techniques other than the Rasch model. To shed more light on the construct validity, the multitrait-multimethod (MTMM) could be applied. Moreover, cross-cultural studies should examine measurement invariance across countries (e.g. collectivistic vs. individualistic) to explore whether cultural standards regarding social support may be biasing the measure.
The correlation between the DJGLS and the self-rated loneliness item was high and in the expected direction. However, it would be desirable to examine this aspect of criterion validity with a loneliness standardized scale as “the gold standard” instead of with a single item. As we noted earlier, the low person separation reliability of the scale could be related to the relative homogeneity of our sample. Future studies should consider the inclusion of samples with social deficits, such as marginalized older adults. To our knowledge, no studies have examined the psychometric properties of the DJGLS in these populations.
Epidemiological, research and clinical studies require precise and useful instruments to detect the presence of loneliness as a major risk factor for physical and mental health. The use of the Item Response Theory (IRT) is a recognized and promising line of future research to construct and validate scales to measure the physical and mental health of older adults.
Conflict of interest
None.
Description of authors’ roles
Jose Buz designed the study, carried out the statistical analysis and drafted the paper. Diana Pérez-Arechaederra supervised the statistical analysis, assisted with writing, reviewed the paper for important conceptual content and approved the final version.
Acknowledgments
This research was supported by a grant (SA015A-08) from the Educational and Culture Council of the Autonomous Community of Castilla y León, Spain.
We would like to thank the three anonymous reviewers for their valuable advices and comments on previous versions of this paper.