1 Introduction
Financial literacy is a fundamental component of a well-functioning civil society. In New Zealand, there has been a growing awareness of its importance and value in an environment of (currently) light-handed financial regulation, financial product diversity, and economic recession.
With the onset of an economic recession in late 2007, housing, shares, and other asset prices followed a boom and bust scenario. Although the banking system proved resilient, there have been a number of failures of finance companies (non-bank deposit-taking institutions) and these losses have been felt by many New Zealanders, both directly and indirectly. In response, there has been growing mistrust of parts of the financial sector, a flight back to the security of bank deposits, a more cautious approach to borrowing and debt on the part of households, and a rapid increase in the number of KiwiSaverFootnote 1 retirement savings accounts. Financial sector regulation is being reformed and tightened (Retirement Commission, 2010c).
These events and developments have highlighted the importance of financial competency among New Zealanders. Improving the quality of information given to borrowers and investors would improve their ability to compare products and their understanding of risk. Provision of better information is also, potentially, another way of raising financial literacy as it could induce people to apply knowledge and, in the process, become more financially literate.
With regard to making financial plans for retirement, New Zealanders are in a somewhat different situation from people in many other countries because of the structure of New Zealand's public pension system. New Zealand pays a universal, flat-rate pension to people aged 65 and aboveFootnote 2, irrespective of their assets, income, or employment status. The public pension, known as New Zealand Superannuation (NZS), is funded on a pay-as-you-go basis out of general taxation. It provides a level of income that generally minimizes poverty among older peopleFootnote 3. The level of NZS equates to 33–43%Footnote 4 of the national average after-tax ordinary-time weekly wage. As such, it represents a predictable, basic, indexed annuity on which people are able, without penalty, to layer additional earnings, investment income, and assets.
While New Zealand has no mandatory pension savings schemeFootnote 5, a new government-incentivised but voluntary retirement savings scheme, known as KiwiSaver, was introduced in 2007. It is available to all people under age 65. Employees are automatically enrolled in the scheme when they start a new job, but have the right to opt out.
This unusual pension structure has implications for the long-term saving strategies of New Zealanders. The longevity insurance and income protection provided by the basic annuity reduces the necessity for private long-term saving, particularly among lower income groups. It may also elicit a somewhat higher degree of risk-taking with investments among higher-income groups. Additionally, extended time in paid employment beyond age 65 is not penalised and this opens up a great range of earning, saving, and decumulation options.
These factors suggest that financial literacy (as indicated by general understanding of just three basic financial concepts) might play only a minor role in retirement planning, since the cost of potential ‘mistakes’ is cushioned by the universal public pension. At the same time, however, financial literacy, information, and skills remain key elements in other aspects of everyday life, in particular, consumer debt management, family budgeting, and homeownership.
A National Strategy for Financial Literacy (Retirement Commission, 2010b) sets the framework for the development and coordination of financial literacy programmes throughout New Zealand. The Retirement Commission has a mandate to inform and educate New Zealanders about financial management and retirement planning. The Ministry of Education is responsible for providing financial education in schools, but work is just commencing on this. Other agencies provide financial education that is aligned with their areas of interest. A Financial Literacy Strategy for Māori has also been developed by the Retirement Commission (Retirement Commission, 2010a).
This paper uses data from the ANZ/Retirement Commission Survey of Financial Literacy 2009 to describe financial literacy levels in New Zealand. The objectives of this paper are first, to enable comparison of financial literacy levels in New Zealand with those in seven other countries. This is made possible through the inclusion of the same (or similar) three financial literacy questions (understanding of interest rates, the effects of inflation, and risk diversification) in financial literacy surveys in each country.
In a separate exercise, the same survey, including the three financial literacy questions, was administered in 2010 to members of the Ngāi Tahu, a Māori tribe of the South Island of New Zealand (Colmar Brunton, 2010). We compare levels of financial literacy among the general New Zealand population, people of Māori ethnicity, and then, more specifically, members of the Ngāi Tahu tribe.
Finally, the paper discusses the effects of financial literacy on retirement planning and provides estimates of the relationship between financial literacy and financial planning for retirement.
2 Dataset
The evidence presented for the cross-country comparison is drawn from the 2009 ANZ/Retirement Commission Financial Knowledge Survey conducted by Colmar Brunton, a large market and social research organization (Colmar Brunton, 2009). A nationally representative sample of 850 New Zealanders were interviewed face-to-face, with a response rate of 62%. Each respondent was selected randomly and so was not necessarily the financial decision maker in the household. Respondents were given NZ$20 to take part in the interview.
This was the second such survey to be undertaken, the first being completed in 2005–06 (Colmar Brunton, 2006). The same questions were used in both surveys so comparisons over time can be made. The 2005–06 Financial Knowledge Survey included a booster sample of Māori people from throughout New Zealand to provide enough Māori respondents to allow for more detailed analysis. A Māori booster was not included in the 2009 survey. A repeat of this survey will be carried out in 2013.
We also report results from a financial knowledge survey of 400 Ngāi Tahu iwi (tribe) members aged 18 years or above that was carried out between 5 April and 18 June 2010. This survey used the same financial knowledge questions as the 2009 Financial Knowledge Survey of the general population. Further contextual background to this survey is provided later in this paper with a discussion of results. Additional technical details are available at the Retirement Commission websiteFootnote 6.
Financial knowledge, for the purposes of the Surveys, is defined as ‘the ability to make informed judgments and to take effective decisions regarding the use and management of money’. Each Survey tested the following areas of personal financial knowledge: money management, budgeting, goal setting, financial planning, debt management, home loans and mortgages, managing risk, savings, planning for retirement, and investing. Survey questions were designed to capture the most important skills and knowledge within all categories in the framework.
3 Empirical evidence
3.1 How financially literate are individuals?
For the purposes of measuring financial literacy in a cross-country context, three questions that most closely match those used in other studies have been selected from within the extensive questionnaire administered in New Zealand. The first two questions, on the understanding of interest rates (numeracy) and understanding of inflation, are effectively identical to those originally developed for the 2004 US Health and Retirement Study, but the third question selected, on long-term investment returns, was not a close match to the recommended standard question on understanding of risk diversification, for reasons explained below.
1. Understanding of interest rate (numeracy)
If Nicky had $100 in a savings account and the interest rate was 2% per year, after 5 years how much would Nicky have in her account if she left the money to grow? Would it be more than $102, exactly $102 or less than $102?
This question appears to be easy for most New Zealanders to understand and answer. There are no particularly difficult terms or words in the question, and it requires very rudimentary mathematical abilities.
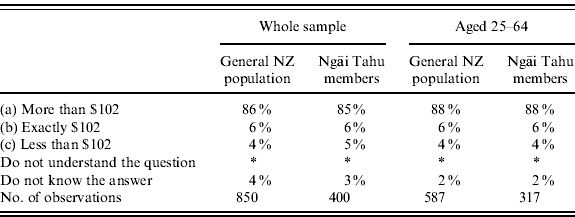
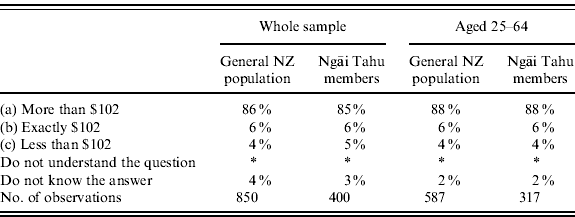
New Zealand schools teach pupils how to calculate compound interest. Tertiary students are familiar with the term through considerable media discussion on interest-free student loans. Homeowners and business people are familiar with compounding interest through normal borrowing from or saving with banks or other financial institutions (Table 1a).
Interest question
* Percentage is between 0.0% and 0.5%.
This question was understood by nearly all respondents, as fewer than 1% indicated that they did not understand the question. As can be seen in the table, the majority of the general population (86%) and Ngāi Tahu (85%) answered the Interest question correctly. Nevertheless, 14% of respondents either got it wrong or did not know the answer (15% Ngāi Tahu). Those who did get it wrong were more likely to respond ‘exactly $102’ rather than ‘less than $102’.
2. Understanding of inflation
If the interest rate on Anne's savings account was 1% per year and inflation was 2% per year, after 1 year, with the money in this account, would she be able to buy more than today, exactly the same as today, or less than today?
The Inflation question should be easy for most New Zealanders to understand and answer. There are no particularly difficult terms or words in the question. Compared with the Interest question, answering this question does, however, involve the additional step of comparing two increasing amounts and interpreting the difference as a reduction in purchasing power.
Young adults may be less used to comparing income flows against rising prices and interpreting the results in terms of real purchasing powerFootnote 7. New Zealand homeowners and business people are more familiar with inflation impacts through such events as housing booms, business cycles, and the impact on earnings from investments.
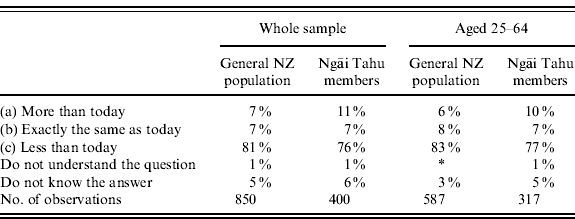
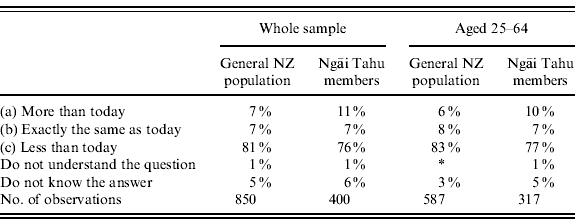
New Zealanders who experienced the periods of high inflation in the 1970s and 1980s are particularly aware of the impact of inflation. Those born after the mid-1980s – since inflation has been low – have not experienced the impacts of high inflation but are likely to understand the concept either through school or media discussions (Table 1b).
Inflation question
* Percentage is between 0.0% and 0.5%.
The majority (81%) of the general population and Ngāi Tahu (76%) were able to answer the Inflation question correctly; as such, it appears to be well understood, but with a slightly lower percentage of correct answers than to the Interest question. However, nearly one in five (Ngāi Tahu nearly one in four) either got it wrong, did not know, or did not understand the question. Just 1% in each respondent category indicated that they did not understand what was being asked.
3. Understanding of risk/return
The question in the original US Health and Retirement Study was designed to measure understanding of risk diversification and read as follows:
Do you think that the following statement is true or false? Buying a single company stock usually provides a safer return than a stock mutual fund.
This question is unlikely to be well understood in New Zealand. The word stock is likely to be interpreted by many in the context of agricultural stock. Terms like single company stock and stock mutual fund are not used much, if at all, among New Zealanders. Furthermore, only 22% of New Zealanders over age 18 invest in shares directly, i.e., not through managed funds (Colmar Brunton, 2009).
Consequently, the New Zealand survey questionnaire did not contain this question nor did it contain a similarly worded question measuring knowledge of risk diversification. The following question has been selected as it was deemed to be most closely related:
Which one of the following is generally considered to make you the most money over the next 15–20 years? (a) a savings account, (b) a range of shares, (c) a range of fixed interest investments, (d) a cheque account.
This question is about the expected returns of different types of financial securities and does not explicitly address diversification as a risk-reducing investment strategy. Unfortunately, this reduces the value of the question for cross-country comparison purposes.
Interpretation of the results is further complicated by determining which response should be regarded as the correct answer. ‘A range of shares’ is generally considered the best answer by those in the finance sector and, indeed, a range of shares may well yield the greatest return, depending on the timing of investment and withdrawal. Recently, however, returns from fixed interest investments have been better than those of share investmentsFootnote 8. Public perception may be that fixed interest investments are likely to provide better returns than will equities.
While the general expert consensus may be that over the long run a range of shares will outperform other investments, the impact of the recession and the collapse of many financial institutions have changed the public's perception of risk and consequently response to this question appears to include elements of both risk and returns.
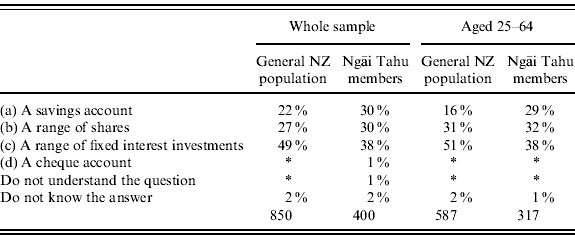
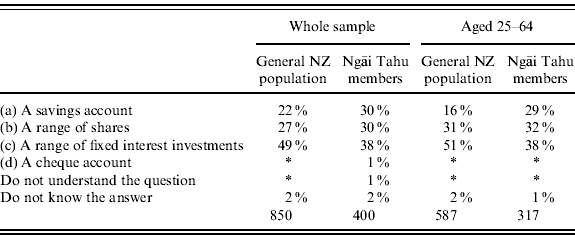
This needs to be borne in mind when considering the analysis. Many who got this question ‘wrong’ could well be financially sophisticated (Table 1c).
Risk question
* Percentage is between 0.0% and 0.5%.
Fewer than a third of the general population (27%) and Ngāi Tahu (30%) answered this question correctly. But, as we have discussed, given the recent economic recession there could be some dispute as to which answer is most correct. New Zealanders, and to some extent Ngāi Tahu, appear to expect that a range of fixed interest investments would yield the greatest returns over the next 15–20 years.
Fewer than 1% of the general population surveyed and just 1% of Ngāi Tahu surveyed indicated that they could not answer the question. However, although respondents said they understood the question, the different interpretations of which answer is correct means that those who chose option c may well be just as financially literate as those who chose option b, the ‘correct’ answer.
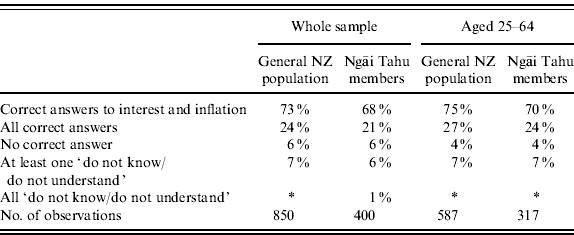
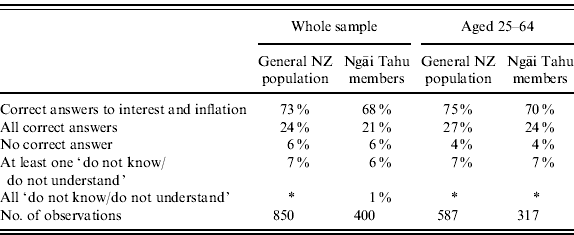
The potentially ambiguous interpretations of this question have, unfortunately, cast some doubt over its usefulness in combination with the first two questions as an accurate indicator of financial literacyFootnote 9. Table 1d shows the distribution of various combinations of responses to the three questions.
Combined responses
* Percentage is between 0.0% and 0.5%.
There are no statistically significant differences in response patterns between Ngāi Tahu and the general population at the 95% confidence level.
While around three-quarters of respondents answered the interest and inflation questions correctly, fewer than a quarter answered all three questions correctly.
3.2 Who knows the least?
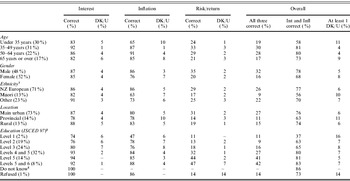
The distribution of responses to the three financial literacy questions across a selection of demographic characteristics is presented in Table 2. Information on income (within specified groups) was sought in the questionnaires, but because of the number of missing values, the breakdown has not been included here.
Distribution of financial literacy across demographics

1 Ethnic groups are not mutually exclusive because respondents can identify with more than one group. Note that an unknown number of members of the Ngāi Tahu tribe would have been sampled in the general survey and included in the Māori ethnicity classification here.
2 The questionnaire used some categories that were too broad to map to ISCED97 (i.e., postgraduate qualification, technical, trade, or other tertiary qualification).
3 Percentage is between 0.0% and 0.5%.
Table 2 shows that for the general population, low financial knowledge of interest, inflation, and risk/return (as indicated by the low percentages of those who answer all three questions correctly) is associated with both youth and old age, being female, identifying as Māori, living in a provincial or rural area, and lower educational attainment.
A similar analysis of the results from the 2010 Ngāi Tahu Financial Knowledge Survey (excluding ethnicity) shows similar demographic factors associated with low financial knowledge.
3.3 Comparisons among the New Zealand general population, Māori, and Ngāi Tahu
Table 2, based on the 2009 Financial Knowledge Survey, shows that people reporting Māori ethnicity scored lower, on average, on each of the three financial literacy questions than the New Zealand population generally. People of Māori ethnicity make up 14% of the New Zealand population. Ngāi Tahu members comprise 9.6% of those of Māori descentFootnote 10 who identify with a tribal affiliation and just over 1% of the total New Zealand population of around 4 million. As mentioned earlier, Ngāi Tahu do not score lower on financial literacy questions than New Zealanders.
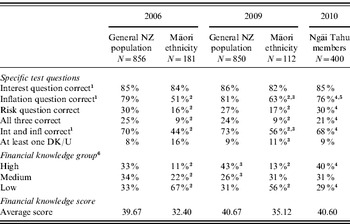
In Table 3, changes in the levels of financial literacy among Māori and the general New Zealand population between the 2006 and 2009 Surveys are compared, using additional measures of financial literacy. Also shown for comparison are the same measures for Ngāi Tahu members from their 2010 Survey.
Indicators of financial literacy, 2006, 2009, and 2010

1 In 2006, the base was 817 for the general population and 166 for Māori, as the interest and inflation questions were not asked during the pilot stage.
2 Significantly different from general population (in the same year).
3 Significantly different from sample group in 2006.
4 Significantly different from Māori in 2009.
5 Significantly different from the general population in 2009. There were no significant differences between Māori in 2009 and Māori in 2006.
6 Financial knowledge score group ranges are: low, 0–37.25; medium, 37.25–44; and high, 44–58.5.
Each Survey's questions covered a broad range of topics, including basic mathematical and literacy skills and the understanding of financial records and financial terms, methods of money management and payment, mortgages, knowledge of financial planning, budgeting, debt management and consumer rights. Respondents’ answers to these questions in 2006 were converted into a financial knowledge score and then, for profiling purposes, respondents were assigned to one of three equal-sized groups: low, medium, or high knowledge. Following the second survey, the 2009 respondents were scored in the same way and assigned to knowledge group categories, keeping the original category boundaries.
Table 3 shows an overall improvement in financial knowledge levels between 2006 and 2009, particularly at the upper end of the distribution of scores. Māori remain heavily over-represented within the low financial knowledge group, but this shows signs of improving.
Lower average levels of financial literacy among those of Māori ethnicity can also be seen when using the three financial literacy questions that are the focus of this paper.
The simple univariate statistics reported in Tables 2 and 3 do not reveal the extent to which low financial knowledge scores for people of Māori ethnicity are associated with economic and educational disadvantage or are a result of other factors more specific to Māori. However, fitting a linear regression model for individual financial knowledge scores in 2009 revealed that, even after including highly significant controls for age group, education level, income, partnership status, homeownership, and being an investment decision maker, Māori ethnicity remained a highly significant explanatory factorFootnote 11.
3.4 Ngāi Tahu
With the evidence strongly suggesting that Māori are disadvantaged in terms of financial knowledge, it may seem surprising that Table 3 shows that members of Ngāi Tahu, one particular Māori tribe, have levels of financial literacy that are significantly different from Māori as a group and not significantly different from those of the general population.
One reason might be that having a tribal affiliation has a number of positive effects in terms of well-being and opportunities for learning and advancement in comparison with those of Māori ethnicity who have no such affiliations. In recent years, financial settlements from the Crown to compensate for land confiscation and other historical breaches of Treaty agreements are helping to boost the economic base of many Māori tribesFootnote 12. ‘Financial literacy is particularly important to ensure “financial wealth isn't short-lived. Māori need to have the capability to manage borrowing and debt and to have the funds to be able to make important choices in life, for oneself, for one's whānauFootnote 13 and for one's iwi”’ (Sharples, 2010).
Two other possible explanations are specific to Ngāi Tahu. First, there is evidence that their rate of tertiary education completion is higher than it is among Māori people as a whole. Second, this tribal grouping, the fourth largest in New Zealand, has been remarkably forward-looking in its investments of the proceeds of the negotiated settlement of its own claim against the Crown. An apology, the return of lands taken by the Crown, and financial compensation offered by the Crown was accepted by Ngāi Tahu in September 1998.
The tribe's governing body (Te Rūnanga o Ngāi Tahu) has sought to ensure that the benefits of the settlement are enjoyed by all members, now and in the future. Through a charitable trust, the governing body holds assets in equities and property as well as seafood and tourism businesses. It has established a subsidised long-term savings scheme (Whai Rawa) for members and is the first tribe in New Zealand to have done this.
Another initiative undertaken in 2007–09 was the Ngāi Tahu Financial Independence Programme. This included the setting up of a series of wealth creation seminars, offering access to a financial support team to help families set goals, and prepare and implement financial plans. A feasibility study investigated how Te Rūnanga o Ngāi Tahu could support greater homeownership. A separate series of goal setting and budgeting skills seminars for members of Ngāi Tahu were held around the country in late 2009. These initiatives could have boosted the financial knowledge of this tribe.
3.5 Does financial literacy matter?
In order to explore whether financial literacy is associated with effective financial planning for retirement, we first need to select an indicator of retirement planning from among the set of questions that were asked in the financial knowledge surveys. Three questions were identified as possible measures of planning:
A. Do you have financial goals? Yes/no.
B. A financial plan is a written approach of the steps you plan to take to achieve your financial goals. Do you have a financial plan that is written down? Yes/no.
C. To what extent have you thought about your financial planning for your retirement – a lot, a fair amount, a little, not at all?Footnote 14
Measures A and B are oriented towards some planning activity but are not specifically focused on long-term retirement saving behaviour, since financial goals and plans may be short or medium termFootnote 15. Measure C is the only one focused specifically on financial planning for retirement, but it does not test whether any action has been taken.
None of these three questions provide the perfect measure of active financial planning for retirement that is sought for cross-country comparison purposes. Therefore, rather than selecting just one of these measures to test the relationship between retirement planning and financial literacy, we provide modelling results using each of the three measures.
For the analysis reported in this section, the population of interest is confined to people in the 25–64 age group who are not retired.
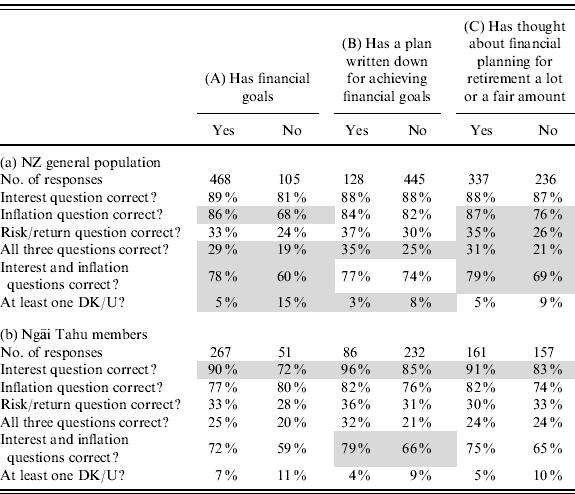
We start by reporting the distribution of responses to the financial literacy questions based on each of our three indicators of financial planning for retirement: whether respondents had financial goals, had a plan written down, or had thought about financial planning for retirement (Table 4(a)). Results from the financial knowledge survey of Ngāi Tahu members are shown in Table 4(b) for comparison.
Three alternative indicators of retirement planning: (a) NZ general population and (b) Ngāi Tahu members
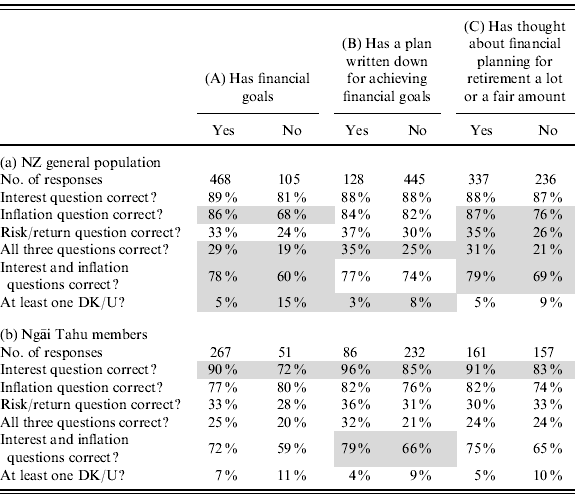
Note: Significant differences in the proportion who correctly answer the financial literacy questions are shaded.
The data in Table 4(a) suggest that those who have taken steps towards financial planning for their retirement (as indicated by positive responses under our three indicators, A, B or C) are consistently more likely than those who have not to answer financial literacy questions correctly, although the difference is statistically significant for only some of the questions. A similar pattern is apparent among members of Ngāi Tahu.
These associations between financial planning and financial literacy do not, of course, establish causation, let alone the direction of any causation. In the regression results reported below, we see that when controls are included, financial literacy is not a particularly strong factor in explaining differences in financial planning.
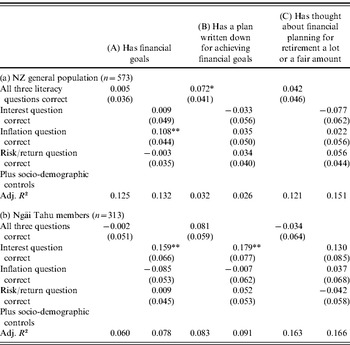
In Table 5(a) and (b), we report the results of a series of Ordinary Least Squares regression model estimations to test the effect of financial literacy, along with a number of demographic and other relevant controls, on each of our three financial planning indicators. In each case the dependent variable takes the value 1 if a respondent meets the indicator test, and 0 otherwise.
Three alternative indicators of retirement planning: (a) NZ general population (N=573) and (b) Ngāi Tahu members (N=313)

Standard errors in parentheses:
*** P<0.01, **P<0.05, *P<0.1.
Two model specifications for financial literacy were tested because of the doubts discussed earlier regarding the validity of the risk/return question. The first uses ‘all 3 financial literacy questions correct’ as an explanatory variable. A second specification replaces this single measure with three dummies each representing the correct response to one of the three questions.
A number of socio-demographic control variables were included in the models. These were age group (four categories)Footnote 16, gender, educational achievement level (three categories), household income level (five categories), whether the respondent was the financial decision maker for the household, homeownership, self-employment, non-employment statusFootnote 17, and whether the respondent was married/partnered.
The models were estimated separately for the 2009 general population sample (including a control variable for people of Māori ethnicity) and for the 2010 sample of members of Ngāi Tahu.
We find that answering all three financial literacy questions correctly is not a predictor of retirement planning. Only in the case of indicator B, those who have a plan written down for achieving their financial goals (not necessarily goals relating to retirement savings), is the estimated coefficient significant at a 10% level of confidence.
Under the alternative specification, a correct answer to the interest, inflation, and/or risk/return question is generally of little or no explanatory value either. In the general population survey, a correct answer to the inflation question is associated with having a financial goal (indicator A), but this association may relate to shorter-term consumer goals rather than to a retirement saving goal.
In the case of the Ngāi Tahu survey, a correct answer to the interest question appears to be most consistently associated with financial planning (particularly for indicators A and B), and this is a result that is not seen in the general population, and the reason for this result is not obvious. One possible explanation might relate to the financial education initiatives undertaken by the Ngāi Tahu tribe. Those who have benefited from these initiatives may have been motivated to set financial goals and also to acquire a better understanding of interest compounding. We have, however, no direct evidence to confirm this hypothesis.
Among the control variables included in the results reported in Table 5(a), gender and self-employment were both statistically insignificant variables. The effect of the other controls varied noticeably across the three indicators. For example, being in an older age group and having a higher level of education were highly significant only in the case of indicator C, thinking about financial planning for retirement. This is to be expected when retirement and its financing are more likely to be considered the closer one gets to retirement age.
On the other hand, in the case of indicator A, but not B or C, being the financial decision maker was a significant (positive) factor and not being married/partnered was a significant (negative) factor for financial planning. These differences in estimates tend to confirm that each indicator is measuring quite different aspects of financial planning.
To test whether these results may be sensitive to the estimation method used, the same basic specifications were estimated using a logistic regression model. The results were broadly similar.
4 Discussion and conclusions
There has been an encouraging rise in New Zealanders’ levels of financial knowledge, with a statistically significant increase between 2006 and 2009 in the proportion of people placed in the ‘High financial knowledge’ category. Among those with lower financial literacy scores, females, young people, those of Māori ethnicity and those with lower educational attainment are over-represented. This pattern is also seen when we examine responses to our three specific questions on interest, inflation, and risk (Table 2).
Generally in contrast to the pattern of lower financial literacy levels among Māori, results of the survey of members of the Ngāi Tahu tribe indicate that this group has a level of financial literacy similar to that of the general population. This is thought to be at least partially the result of the tribe's general educational attainment, their focus on investing communal assets for the future benefit of its membersFootnote 18, and the savings and financial education initiatives that have recently been undertaken. The tribe's governing body has established a long-term savings scheme for their members and are providing financial education seminars for young adults.
The overall improvement in financial knowledge levels has occurred at a time when nearly one-third of all New Zealanders have used the free, independent, and impartial information and resources available under the Retirement Commission's personal financial education programme designed to help with management of personal financial resources throughout lifeFootnote 19. At the same time, economic recession and the collapse of a number of financial companies have caused a loss of public confidence and trust in some parts of the financial sector and in some financial advice services and has led to a recovery in household saving rates, debt reduction, and a retreat to the security of bank deposits. There has been higher than expected growth in KiwiSaver membership since its introduction.
All these developments are expected to have had a positive effect on the financial literacy levels of New Zealanders, and it has not been possible to identify their distinct contributions. However, we expect that momentum has been generated and that we will see a continuing improvement in financial literacy levels in coming years.
We have found little evidence that the three indicators of financial literacy (understanding of interest, inflation, and risk/return) we have looked at have an effect on financial goal setting or planning, specifically on thinking about financial planning for retirement (Tables 5(a) and (b)).
This could be a reflection of the fact that New Zealand's public pension system currently provides a considerable degree of retirement income security, thus reducing people's need to make investment decisions or manage their own pension plans. This could change in the future as people increasingly recognise their ability to contribute to their personal retirement income through the new voluntary KiwiSaver scheme.
In the meantime, for young people, who have to budget daily expenses, manage consumer debt, and save for a home down payment, the need to acquire financial information, skills, and competency is much more pressing. It is in these areas and among this demographic group that we believe the benefits of financial information and financial literacy initiatives, including those of Ngāi Tahu, are beginning to be seen.