Introduction
Rice (Oryza sativa L.) is a staple food of more than 3 billion people, mainly in Asia. Ranking first in the area, India is the second largest rice producing economy in the world after China. Rice varieties with higher yield potential must be developed to enhance the average farm yields of irrigated rice ecosystem. Predominantly, indica cultivars are grown in India, China, Southeast Asia and South Asia occupying approximately 70% of the rice-producing area in the world, whereas japonica cultivars are grown mainly in East Asia (Huang et al., Reference Huang, Kurata, Wei, Wang, Wang, Zhao, Zhao, Liu, Lu, Li, Guo, Lu, Zhou, Fan, Weng, Zhu, Huang, Zhang, Wang, Feng, Furuumi, Kubo, Miyabayashi, Yuan, Xu, Dong, Zhan, Li, Fujiyama, Toyoda, Lu, Feng, Qian, Li and Han2012). Breeding for new plant type (NPT) with traits introgressed from japonica in the background of indica was initiated in 1989 (Peng et al., Reference Peng, Khush, Virk, Tang and Zou2008). However, the first generation NPT cultivars yielded less than modern indica cultivars, mainly because of low grain fertility and low panicle number (PN) (Peng et al., Reference Peng, Cassman, Virmani, Sheehy and Khush1999, Reference Peng, Khush, Virk, Tang and Zou2008). To overcome the drawbacks in first generation NPT lines, the concept was refined in terms of increased PN/m2 and increase in the above ground total biomass (BM). Since its inception and transition from the first generation to second generation NPT, the anticipated increase in yield levels has not been achieved so far. Re-designing indica plant type with tropical japonica traits viz., high grain number (GN), few unproductive tillers, strong culm etc and at the same time retaining the indica grain quality is a tremendous challenge.
Developing a core collection is an efficient approach for exploring, characterizing and capturing the genetic diversity of large populations (Frankel and Brown, Reference Frankel, Brown, Holden and Williams1984; Zhang et al., Reference Zhang, Zhang, Wang, Sun, Qi, Li, Wei, Han, Qiu, Tang and Li2011a, Reference Zhang, Li, Li, Liu, Zhao and Lub). Core collections facilitate the efficient exploration of novel genes in germplasm resources. A large set of 650 germplasm of varying maturity duration encompassing indica and tropical japonica sub species have been surveyed upon for NPT traits viz., high GN, strong culm, few unproductive tillers, high BM and NPT leaf angle of 5°, 10° and 20°. Here, we develop a core set of rice genotypes with a combination of one or more NPT traits for selection of the most appropriate parental genotypes to be used in NPT breeding programs for improved rice productivity. It would also serve as a reference to classify elite breeding lines into different maturity groups and facilitate in knowing the adaptation mechanism of rice genotypes in extreme environments.
Materials and methods
The rice germplasm consisted of 650 genetically diverse accessions, cultivars and breeding lines from the collection of the ICAR-Indian Institute of Rice Research (ICAR-IIRR) which includes 312 tropical japonica (TJP) accessions originally sourced from International Rice Research Institute, 200 elite indica cultivars grown in different ecosystems of the country and 140 landraces (LRs) from north eastern part of the country. The experiment was conducted during Kharif (wet season between June and November) 2016 at ICAR-IIRR experimental farm located in ICRISAT campus, Patancheru, Hyderabad. The seed was sown on 22 June 2016 in raised dry nursery beds and were transplanted to the main experimental plots on 18 July 2016. Each entry was planted in two rows with 20 plants per row following the spacing of 20 cm between rows and 15 cm between plants. The experiment was laid in augmented block design in six blocks. Six popular local cultivars viz., BPT 5204, RP Bio 226, MTU 1010, Swarna, IR 64 and Jaya were used as checks. Checks were replicated block-wise and test entries were randomized in all blocks. As a basal dressing, 30 kg/ha each of N, P and K were applied the day before transplanting, and 30 kg/ha of N was applied twice as a topdressing at 2 and 4 weeks after transplanting. Plant protection measures were followed from time to time throughout the crop growth period.
Evaluation of morphological traits
A total of 10 quantitative traits i.e. days to 50% flowering (DFF), plant height (PH), panicle length (PL), tiller number (TN), PN, GN, 1000 grain weight (TW), BM, yield per plant (Y) and culm strength (M) were evaluated as follows: DFF was evaluated as the number of days from sowing to 50% panicle emergence. For other traits, the average of data collected on five plants was taken. PH was measured as the length between the plant base and the panicle tip. TN as total number of tillers, PN as number of panicle bearing tillers, PL as length in ‘cm’ from base to the tip of the panicle, GN as the total number of filled grains in a panicle, TW as weight of thousand grain count in ‘g’, BM as weight of total dry matter in ‘g’ and Y as grain yield of single plant in ‘g’. In addition, leaf angles of the flag, first and second leaves, flag leaf width (FLW) and flag leaf length (FLL) were also evaluated. Leaf angles measured as the angle between main culm and leaf at the point of origin of the leaf. FLL and FLW were measured on the flag leaf of the mother tiller.
Measurements of culm strength: The prostrate tester (DIK-7400, Daiki Rika Kogyo Co. Ltd., Tokyo, Japan) was used to measure the bending stress of the culm as described by Hai et al. (Reference Hai, Guo, Xiao, Jiang, Zhang, Yan, Xin and Jia2005). Ten main culms were sampled from each plot to determine the culm thickness and diameter as described by Ookawa et al. (Reference Ookawa, Inoue, Matsuoka, Ebitani, Takarada, Yamamoto, Ueda, Yokoyama, Sugiyama, Nakaba, Funada, Kato, Kanekatsu, Toyota, Motobayashi, Vazirzanjani, Tojo and Hirasawa2014). The physical parameters were calculated as follows:
M = Section modulus × Bending stress
where, M is the bending moment of the basal internode at breaking (gf);
Bending stress (BS) = (Tester Reading÷40) × (1000÷Tiller number);
Section modulus (SM) = π/32 × (a13b1–a23b2)/a1;
where a1 is the outer diameter of the minor axis in an oval cross-section, b1 is the outer diameter of the major axis in an oval cross-section, a2 is the inner diameter of the minor axis in an oval cross-section, and b2 is the inner diameter of the major axis in an oval cross-section.
Data analysis and genetic parameter estimation
Analysis of variance was performed on 13 quantitative traits to assess the extent of morphological variability for the traits in the total collection. Mean phenotypic data on days to 50% flowering of 650 genotypes was deployed to construct dendrogram through neighbour-joining with 1000 bootstrap values from continuous Euclidean dissimilarity index using DARwin ver 6.0 software (Perrier and Jacquemoud-Collet, Reference Perrier and Jacquemoud-Collet2006). Group-wise cluster analysis was done to calculate the genetic distances among the genotypes within each duration group.
Development of a core collection for ideal NPT traits
Initially, genotypes with a combination of one or more NPT traits were selected across the duration groups. Secondly, genotypes were grouped by hierarchical cluster analysis based on genetic distance and core collection for ideal NPT traits was then selected from different groups of clusters, and the sampling proportion of the core collection was retained at 10–20% of a population. In another strategy, a core collection was developed using Power Core software developed by Kim et al. (Reference Kim, Chung, Cho, Ma, Chandrabalan, Gwag, Kim, Cho and Park2007): a program applying the advanced M-strategy with a heuristic search for establishing a core set. Both for hierarchical cluster analysis and analysis by Powercore, 10 morphological parameters viz., DFF, PH, PL, TN, PN, GN, TW, BM, Y and M were used to estimate the representativeness of the core collections.
Results
Genetic diversity in morphological traits
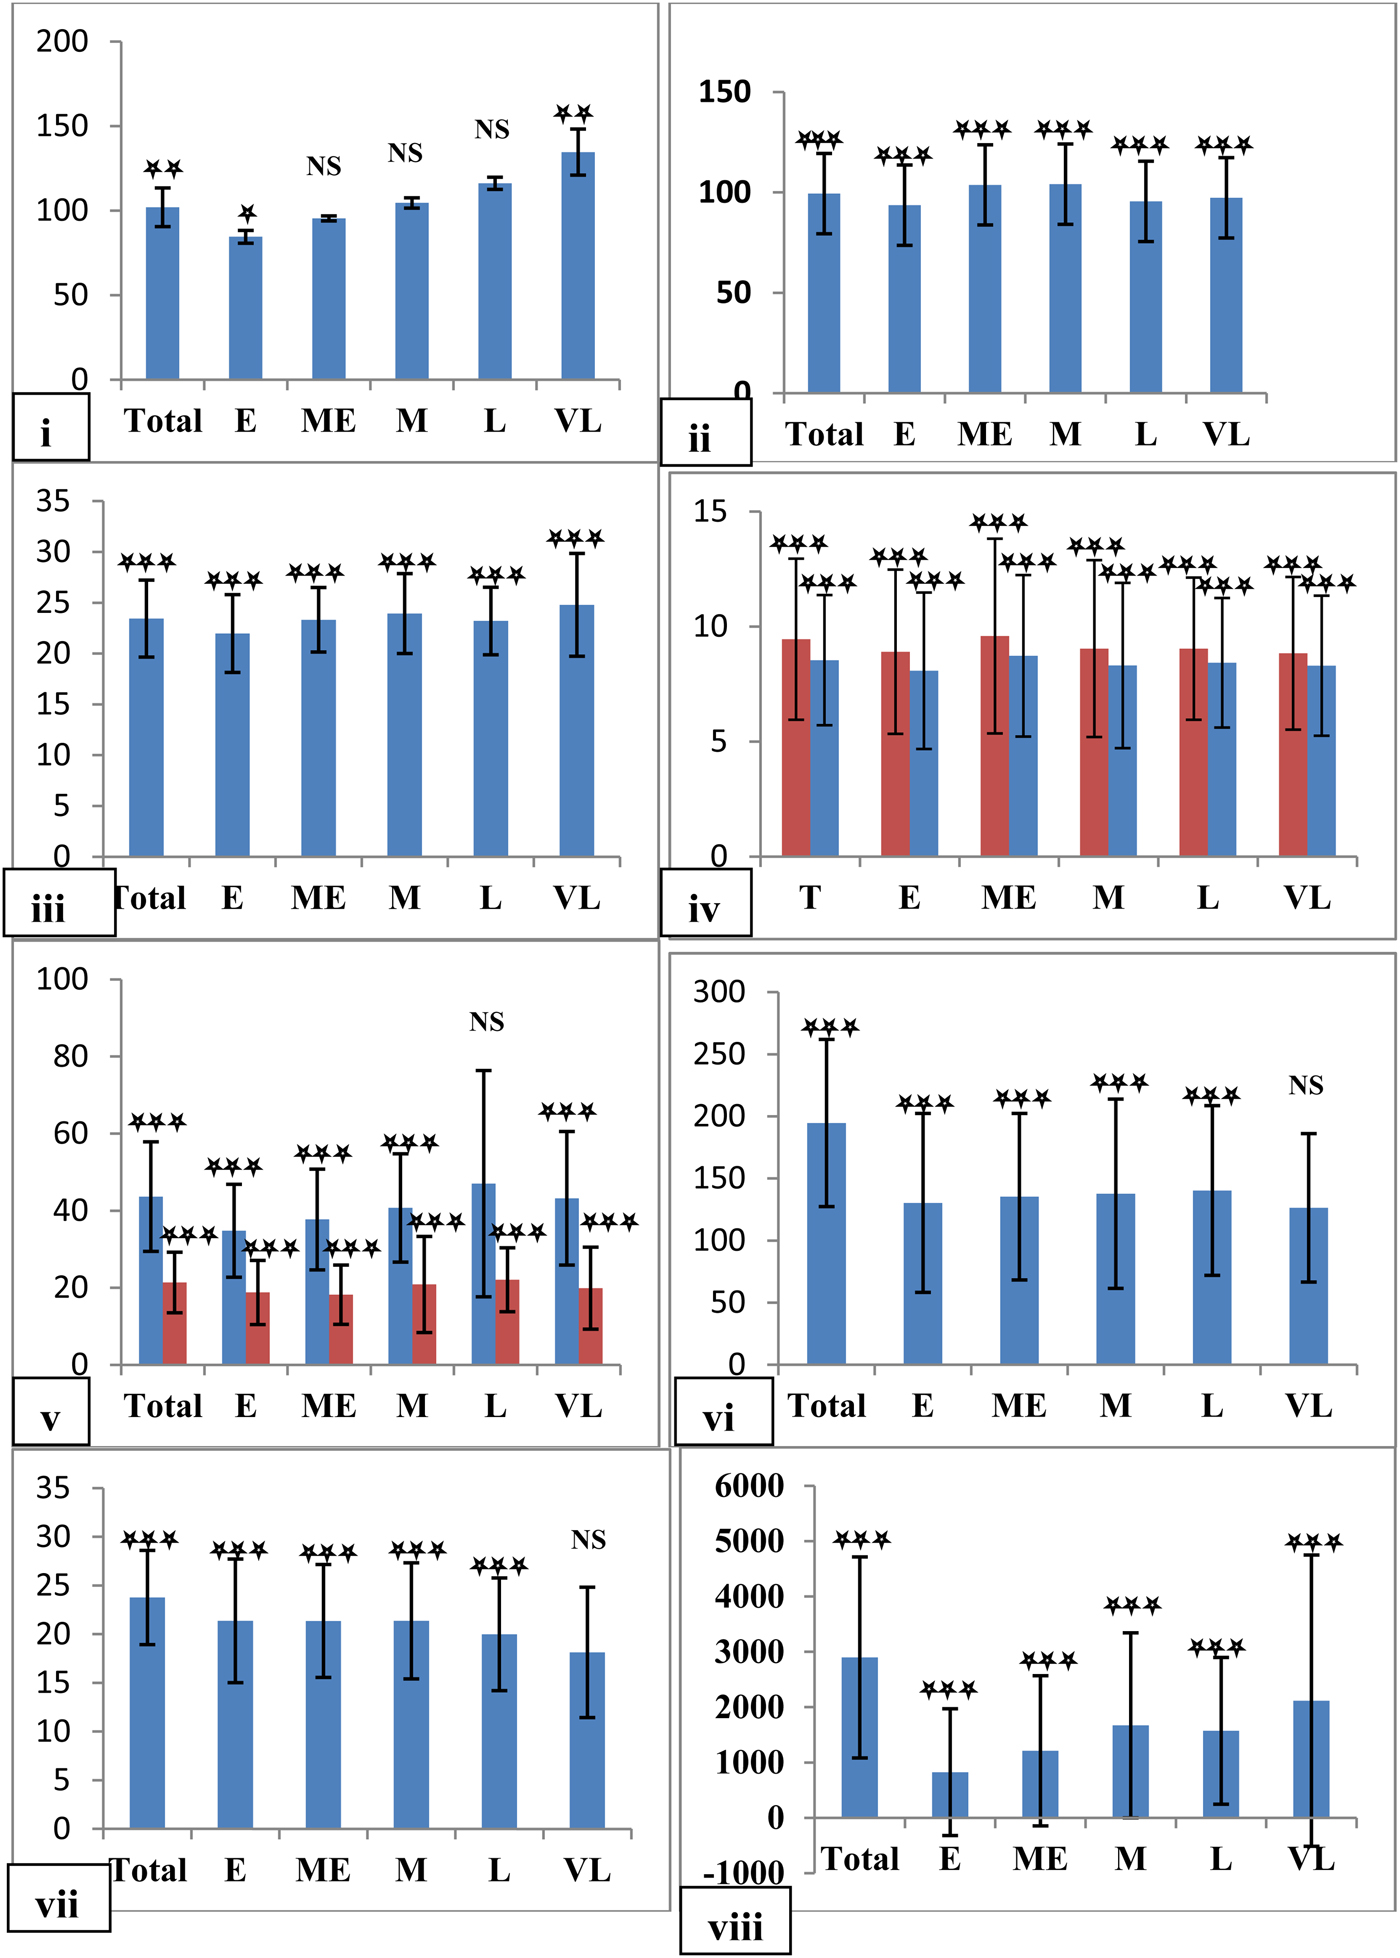
Analysis of variance using SAS 9.2 (2013) revealed highly significant differences among the genotypes for all the traits assessed except flag length and width and leaf angles. Wide variation was observed for the trait, days to 50% flowering among the 650 genotypes, ranging from 70 to 171 days after sowing (Fig. 1i). They were grouped into five maturity duration groups based on DFF (Table 1). Maximum genotypes (263) were found with medium duration of 101–110 DFF, followed by mid-early (150), late (123) and early duration (75). Least number was with very late duration (39).
Phenotypic distribution of 10 quantitative traits across the duration groups: Mean phenotypic values of (i) days to 50% flowering (ii) plant height in cm (iii) panicle length in cm (iv) tiller number and panicle number (v) biomass in g and yield in g (vi) grain number (vii) test weight (viii) culm strength in terms of bending moment at breaking strength in gf. along the Y-axis. Duration groups E-early, ME-mid early, M-medium, L-late and VL-very late duration along the X-axis. Mean values with whiskers showing SD. Significant at ***0.1 %; **1%; *5%; NS., not significant.

Analysis of variance

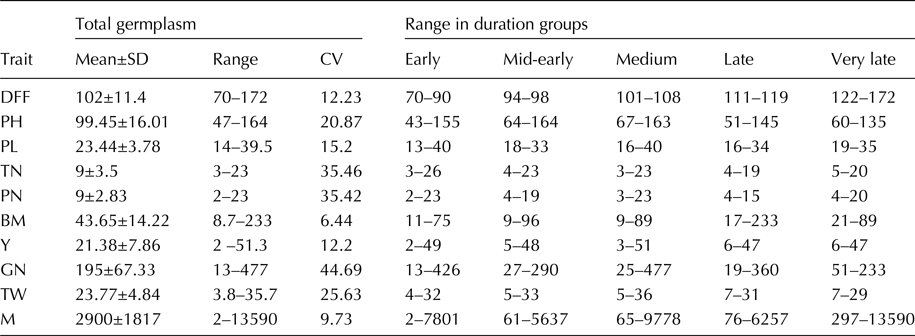
DFF, days to 50% flowering; PH, plant height in cm; PL, panicle length in cm; TN, number of tillers per plant; PN, number of panicle bearing tillers per plant; BM, plant total dry weight in g; Y, single plant yield in g; GN, number of grains per panicle; TW, thousand grain weight in g; M, culm strength measured as bending moment at breaking stress in gf.
PH varied from as low as 47 cm for a genotype in early group to as high as 164 cm in mid-early group (Fig. 1ii). Very tall genotypes were found in early to medium duration while in very late category, PH did not exceed more than 135 cm. PL varied from a minimum of 14 cm to a maximum of 39.5 cm across the genotypes and more or less similar trend was observed within maturity duration groups (Fig. 1iii). Long panicles with a PL of more than 35 cm were found in nine TJP accessions viz., IRGC8269, IRGC9147, IRGC14694, IRGC19642, IRGC27435, IRGC39111, IRGC31051, IRGC26011 and IRGC25892. The TN ranged from 3 to 23 with a mean of 9 on overall basis and a similar pattern was observed in all the duration groups (Fig. 1iv). However, highly significant differences were observed among the genotypes across the duration groups. A similar trend was observed for PN trait, indicating no effect of duration on TN and PN (Fig. 1iv). The value for the BM ranged from 9 g to 233 g among the total genotypes with a mean of 43.65 g (Fig. 1v). Highly significant differences were observed among the genotypes as a whole and also in all duration groups except late group. Low mean values were observed in the early group with a gradual increase in mean value up to the late group and again decrease in the very late group. Yield varied from as low as 2 g to a maximum of 51 g among the total genotypes with a mean value of 21.38 g. The mean value is more or less the same in all the groups, but there were no genotypes in the early group that exceeded more than 35 g (Fig. 1v). GN ranged from a minimum of 13 to a maximum of 477 among the genotypes. For this trait, differences among the genotypes were highly significant across the duration groups except in very late group (Fig. 1vi). In a very late group, no significant differences were observed among the genotypes for the trait grain number. Very high grain number of more than 350 was observed in two TJP accessions IRGC53089, IRGC31063 and one LR ‘Azhoghi’. Thousand grain weight varied from a minimum of 3.8 g to a maximum of 35.7 g among the genotypes with a mean of 23.77 g and a similar trend was observed across the duration groups (Fig. 1vii). Bending moment at breaking stress ranged from as low as 2 gf for a genotype in early duration group to 13590 gf for a genotype in the very late group. Highly significant differences were observed among genotypes for this trait across the duration groups (Fig. 1viii). Fourteen genotypes viz., IRGC33130, IRGC29772, IRGC5097, IRGC37015, IRGC43741, IRGC50448, IRGC53089, IRGC39111, IRGC18021, IRGC44069 and IRGC8269 of TJP group, Haorei Machang, Pumpha mah and Thangmoi of LR group were identified as possessing strong culm. Ideal leaf angle of NPT genotypes of 5°, 10° and 20° of flag leaf, 1st and 2nd leaves was not found in any genotype but with a combination of 5°, 10° and 10° was observed in IRGC63102 and IRGC66644. NPT flag leaf length and width of 50 and 2 cm, respectively, was seen in a landrace ‘Kemenya Kepeu’ and a tropical japonica accession ‘IRGC29772’. The coefficient of variation (CV) is a useful statistic for comparing the variability of a morphological trait among populations. High CV was observed for all the traits indicating the wide range of variability for all the morphological traits.
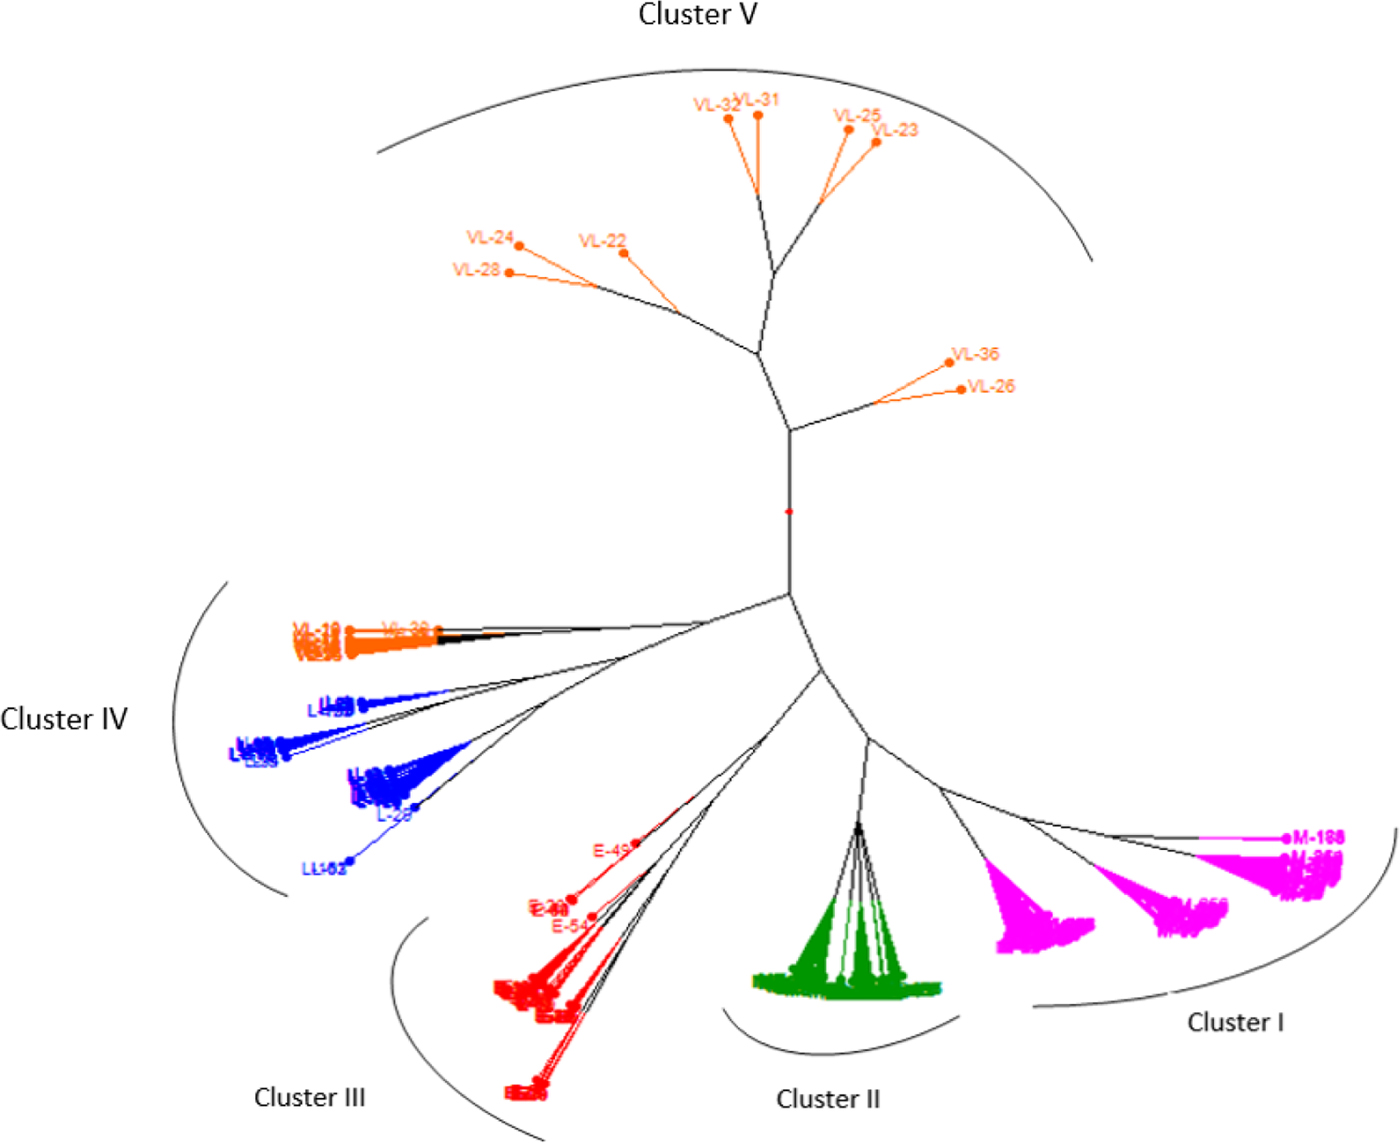
The dendrogram classified all the genotypes under study into five major clusters (Fig. 2). The analysis showed wide genetic variability with clusters showing moderate to high boot support. Cluster I comprised all medium duration genotypes and this cluster showed three different sub clusters. Cluster II included exclusively all mid-early accessions with very close similarity coefficient within the cluster. All early lines came under cluster III with three minor sub clusters. In cluster IV, interestingly all the late lines and 32 of very late lines grouped together even though they were clearly delineated under different sub clusters. Nine of the very late lines formed the cluster V with clear divergence among each line indicating the genetic dissimilarity among each other.
Clustering of the 650 genotypes into five major maturity duration groups. Medium duration genotypes (pink) grouped into cluster I, mid-early (green) into cluster II, early (red) into cluster III, late (blue) into cluster IV and very late (orange) in two clusters IV and V.

Development of core set for NPT traits
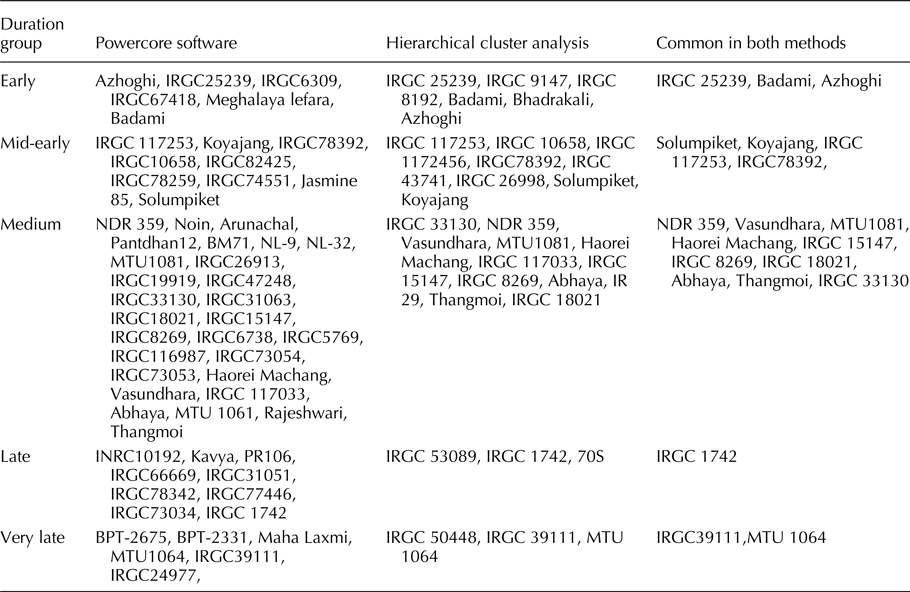
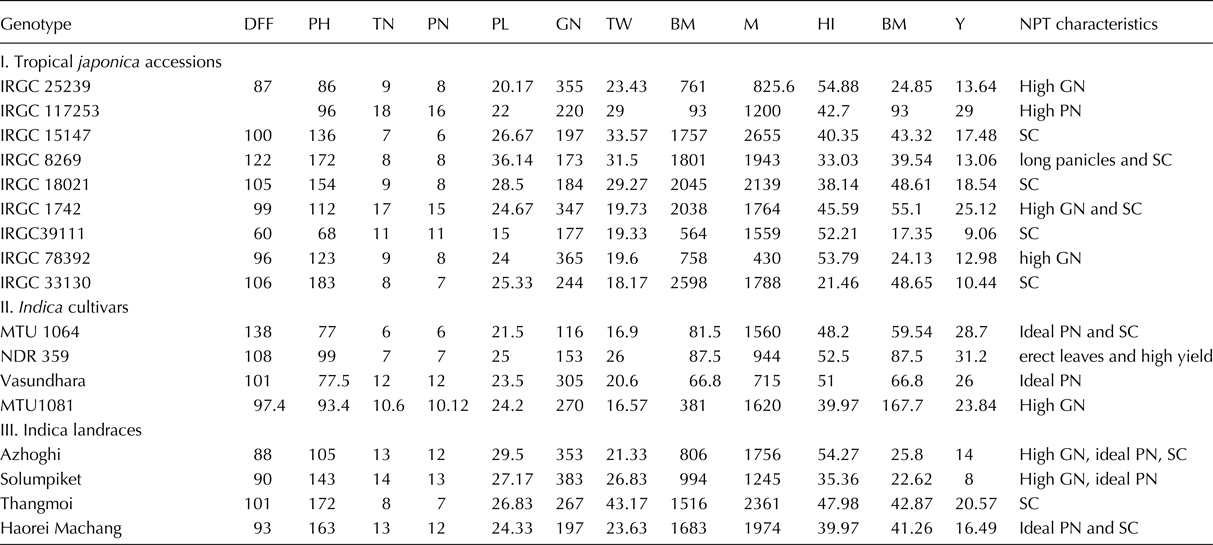
Dendrograms were constructed based on morphological data in different maturity duration groups. To validate that the accessions were representative of the entire population, clusters were made by hierarchical cluster analysis at a genetic distance of 0.75. Number of clusters varied from three to five in duration groups. In early group, there were four clusters (online Supplementary Fig. S1), in mid-early five clusters (online Supplementary Fig. S2), medium it was four (online Supplementary Fig. S3), late five (online Supplementary Fig. S4) and very late only three clusters (online Supplementary Fig. S5) when clusters were separated at a genetic distance of 0.75 by hierarchical cluster analysis. Seventy-two genotypes were found to possess a combination of one or more ideal plant type traits of which, 32 genotypes were genetically diverse based on genetic distances in the clusters of dendrograms in different duration groups. The NPT core set of 32 genotypes comprised six in early duration group, eight in mid early, 12 in medium, three in each late and very late groups (Table 2) with 18 tropical japonica accessions, eight indica cultivars, five indica LRs and one elite indica breeding line.
Development of core set using Powercore software and hierarchical cluster analysis for ideal plant type traits

A genetically diverse core set of 58 genotypes was developed by employing Power Core software with 31 tropical japonica accessions, 15 indica cultivars, nine indica LRs and three indica breeding lines. It consisted of six genotypes from early duration group, nine from mid-early, 28 from medium, nine from late and six from very late maturity duration groups. When NPT core set based on cluster analysis and core set based on software were compared, 20 genotypes were found common in both the methods (Table 3).
Morphological characteristics of core set

DFF, days to 50% flowering; PH, plant height in cm; PL, panicle length in cm; TN, number of tillers per plant; PN, number of panicle bearing tillers per plant; BM, plant total dry weight in g; Y, single plant yield in g; GN, number of grains per panicle; TW, thousand grain weight in g; M, culm strength measured as bending moment at breaking stress in gf. SC, strong culm.
Discussion
Genetic diversity in morphological traits
The rice germplasm collection with 650 genotypes including tropical japonica accessions, elite indica cultivars, indica LRs and elite indica breeding lines representing the maximum genetic diversity in rice, is an ideal choice to characterize and develop a core set for NPT traits. Quantitative traits viz., DFF, PH, PL, TN, PN, GN, TW, BM, M, Y which have a large impact on rice yield and significantly affect the genetic diversity of the germplasm, were used to evaluate the genetic diversity. High CV observed for all the traits indicates the wide range of variability for all the morphological traits evaluated in the present study. Wide variation was observed for the trait days to 50% flowering among the 650 genotypes and they were distributed into five maturity duration groups both in indica and japonica sub species groups. Maximum genotypes with medium and mid-early duration both in naturally evolved germplasm and elite breeding lines indicate an adaptation of rice to different ecologies as well as the concentrated breeding efforts towards developing medium duration genotypes due to relative high yield levels.
No influence of growth period was observed on the traits, PL, TN, PN, TW and bending moment at breaking stress. Varying PHs were found among the genotypes in all the duration groups except in very late group, wherein PH did not exceed more than 135 cm. For the trait BM, low mean values were observed in the early group with a gradual increase in mean value up to late group and again decrease in very late group. The mean value for yield is more or less the same in all the groups, but high yield levels not observed in the early group indicates less time for photosynthate accumulation (Xie et al., Reference Xie, Shen, Li, Zhao, Li and Xu2011; Long et al., Reference Long, Marshall-Colon and Zhu2015). In case of GN, in the very late group, no significant differences were observed among the genotypes. This study clearly reveals that the traits PL, TN, PN, TW and bending moment at breaking stress are independent of growth duration while the other component yield traits viz., PH, BM, GN and yield dependent on growth duration. Six-hundred and fifty genotypes of Oryza sativa accessions were quite clearly resolved into five sub-groups mainly based on their duration except lines of late and very late duration which are having similar agronomic traits. Very late lines in the last cluster were distinct from the rest of the genotypes and showed very low similarity coefficient among each other.
Development of core set
An ideal core collection encompasses the maximum genetic diversity of the entire germplasm with minimum repetitiveness. Generally, three methods are used to develop core collections (Liu et al., Reference Liu, Shahid, Bai, Lu, Chen, Jiang, Diao, Liu and Lu2015). When software is employed, validation is not required if an appropriate sampling proportion of 5–30% is attained, however, genotypes possessing desirable agronomic traits could easily be overlooked if software alone is employed (Li et al., Reference Li, Li and Lu2007). The most effective method for selecting core collections which allows for the flexible use of genetic resources involves the development of a hierarchical core collection system and it retains the main types of alleles present in a population but is technically challenging and time-consuming (Zhang et al., Reference Zhang, Zhang, Wang, Sun, Qi, Li, Wei, Han, Qiu, Tang and Li2011a, Reference Zhang, Li, Li, Liu, Zhao and Lub). In the third method, the un-weighted pair group method of arithmetic average (UPGMA), genetic relevance and genetic distance are the major parameters used to develop core collections. Using this approach, accessions with excellent traits and high genetic distance were selected as core collections directly (Oliveira et al., Reference Oliveira, Nelson, Geraldi, Cruz and Toledoa2010; Wang et al., Reference Wang, Zhang, Sun, Ning and Yang2011; Bhattacharjee et al., Reference Bhattacharjee, Dumet, Ilona, Folarin and Franco2012). For instance, a mini-core collection consisting of 189 rice varieties was developed in China (Zhang et al., Reference Zhang, Zhang, Wang, Sun, Qi, Li, Wei, Han, Qiu, Tang and Li2011a, Reference Zhang, Li, Li, Liu, Zhao and Lub) and a core set of 701 accessions was developed accounting to 10% of accessions from total North-Eastern India, representing 99.9% of the allelic diversity (Choudary et al., Reference Choudary, Singh, Singh, Kumar, Srinivasan, Tyagi, Ahmad, Singh and Singh2014). To ensure the genetic diversity of the core collection, Liu et al. (Reference Liu, Shahid, Bai, Lu, Chen, Jiang, Diao, Liu and Lu2015) used the UPGMA and genetic distance and validated the percentage of alleles retained the genetic diversity and the principal component analysis between the core and entire collection.
In this study, representatives of the established core collection were identified by observing phenotypic descriptors. Further, cluster analysis was performed to develop an efficient core collection by selecting accessions with a range of genetic distances. This strategy maintained the genetic diversity of the entire population. We grouped the genotypes based on duration, employed hierarchical cluster analysis group wise, selected the genotypes possessing one or more of NPT traits from different clusters. Clustering helped in the precise selection of diverse genotypes for NPT core set. Core set developed using software comprised genetically diverse genotypes, however, all were not with desirable plant traits. Some genotypes having ideal plant type traits, such as those exhibited by Solumpiket, Azhoghi, IRGC 53089 etc were not selected when using the software alone. Comparing core sets from both the strategies helped in narrowing the list to a genetically diverse and distinct NPT core set.
The sampling proportion of a core collection is important for selecting a suitable sampling percentage to obtain the maximum genetic diversity and the maximum range of geographical types. Usually, 5–30% of the sampling percentage is selected from the entire germplasm (Wang et al., Reference Wang, Hu, Zhang and Zhang2007). In this study, we selected 32 accessions as the core collection and the average ratio of selected core accessions to the total germplasm was 5%.
The tropical japonica genotypes are characterized by robust bold grains, high/low amylose content in the grain, stickiness after cooking and watery appearance of the cooked grains. Indica grain type characterized by intermediate amylose content of 20–24%, tenderness after cooking, well-separated grains after cooking are the preferred grain quality traits by Indian consumers. Re-designing indica plant type with tropical japonica traits viz., high grain number, few unproductive tillers, strong culm etc and at the same time retaining the indica grain quality is a tremendous challenge. The present study demonstrates the availability of very few improved indica cultivars with high grain number, strong culm, heavy and drooping panicle traits in different combinations which are typical characteristic features of tropical japonica germplasm. However, NPT core set is largely represented by tropical japonica accessions and broadening the genetic base of indica lines while retaining indica grain quality with introgression of ideal NPT traits from tropical japonica germplasm is essential in view of the narrowing genetic diversity and stagnant yield levels of indica cultivars. Further studies will focus on redesigning indica plant type with tropical japonica traits while retaining the indica grain quality. The core collection developed under this study provides an effective mechanism for the proper exploitation of rice germplasm resources for the genetic improvement in NPT development.
Supplementary material
The supplementary material for this article can be found at https://doi.org/10.1017/S1479262118000084