Introduction
In general, the structure of ecological communities is determined by important processes, such as individual restrictions to dispersion, limitations imposed by the environment where the organisms live, and by the peculiar intrinsic dynamics of communities (Belyea & Lancaster, Reference Belyea and Lancaster1999; Reichenbach et al., Reference Reichenbach, Mobilia and Erwin2007; Ivanov & Keiper, Reference Ivanov and Keiper2010). These combined processes are expected to affect the patterns of species composition and species richness amongst communities (Kirkman et al., Reference Kirkman, Mitchell, Helton and Drew2001). Therefore, the similarity in species composition may vary considerably over a geographic gradient, for example, through latitudinal clines, which is strictly dependent on the distance between paired communities. Greater similarity in species composition is usually expected among nearby communities than those farther apart, generating inverse correlations between similarity in species composition and geographic distance (Steinbauer et al., Reference Steinbauer, Dolos, Reineking and Beierkuhnlein2012).
The number of individuals of a given species also varies markedly among localities (i.e. relative abundance), where great changes in abundance occur at large geographic ranges between communities (Crist, Reference Crist1998; Wagner, Reference Wagner2003). Because environmental variables are commonly correlated spatially, patterns of species abundance are frequently associated with particular environmental conditions (Crist et al., Reference Crist, Pradhan-Devare and Summervile2006). However, other spatially autocorrelated ecological processes, such as intraspecific and interspecific interactions, are also relevant, influencing the spatial arrangement of species, promoting spatial structure in ecological communities, regardless of environmental variables (Wagner, Reference Wagner2003; Borcard et al., Reference Borcard, Legendre, Avois-Jaquet and Tuomisto2004).
Most of the world's biodiversity is represented by parasitoids, their hosts, as well as the plants from which the hosts feed (Godfray, Reference Godfray1994; Hawkins, Reference Hawkins2005). It has been estimated that the organisms that are directly involved in these interactions represent more than half of every known species (Price, Reference Price1980; Strong et al., Reference Strong, Lawton and Southwood1984). Moreover, parasitoids can be found in almost all terrestrial ecosystems and constitute outstanding models for comparative studies and for testing ecological and evolutionary hypotheses, especially because they present a great variety of life-history strategies and may be involved in complex trophic webs (Holyoak, Reference Holyoak, Hochberg and Ives2000). Host–parasitoid dynamics are also important for environmental applications because parasitoids are widely used in biological control programmes worldwide (Wajnberg et al., Reference Wajnberg, Bernstein and van Alphen2008). Despite the relevance of parasitoids for a better understanding of how insect communities are structured (Hawkins, Reference Hawkins2005), many species remain unknown. This means that very little is known about the abundance, geographic distribution and spatial structure of parasitoids (Mitsui et al., Reference Mitsui, Achterberg, Nordlander and Kimura2007; Patrock et al., Reference Patrock, Porter, Gilbert and Folgarait2009; Rull et al., Reference Rull, Wharton, Feder, Guillén, Sivinski, Forbes and Aluja2009; Klapwijk & Lewis, Reference Klapwijk and Lewis2011).
Bruchine beetles (Coleoptera: Chrysomelidae: Bruchinae) are exclusively seed feeders during the larval stage; they are highly host specific and more than 80% of the known species feed on legumes (Farrell & Sequeira, Reference Farrell and Sequeira2004; Ribeiro-Costa & Almeida, Reference Ribeiro-Costa, Almeida, Panizzi and Parra2012; Rodrigues et al., Reference Rodrigues, Viana, Ribeiro-Costa and Rossi2012). Some parasitoid families are quite representative in attacking bruchine beetles. However, the current knowledge of parasitoid species that parasitize bruchines is scarce, and most studies have been conducted only at local scales (Sari et al., Reference Sari, Ribeiro-Costa and Medeiros2002; Nakai et al., Reference Nakai, Kondo and Akimoto2011). Although some bruchines are specialist seed-feeders, they are also widely distributed, following the distribution of their host plant (Tuda et al., Reference Tuda, Wu, Tateishi, Niyomdham, Buranapanichpan, Morimoto, Wu, Wang, Chen, Zhu, Zhang, Murugan, Chou and Johnson2009). Therefore, some of the bruchines’ parasitoids may be able to disperse tens or even hundreds of kilometres annually through host distribution, when environmental conditions are favourable (e.g. frequent winds). Meanwhile other bruchine parasitoids, for reasons that are poorly understood, may have an intrinsically limited distribution (for more details of local and global parasitoid dispersion, see Hassell (Reference Hassell2000) and Harrison (Reference Harrison, Hochberg and Ives2000)). As a result, the collection of data at large spatial scales is vital for a better understanding of the diversity of the bruchines’ parasitoids, their geographic distribution and spatial structure.
The aims of this study were to: (1) determine the species richness and evenness of parasitoids attacking the bruchine beetle Acanthoscelides macrophthalmus in Brazil, (2) examine their geographic distribution and (3) characterize the large-scale spatial structure in parasitoid species composition.
Study system
Leucaena leucocephala (Fabaceae: Mimosoideae) is a leguminous plant native to Central America, which is used for forage, firewood, coal and cellulose production (Lima & Evangelista, Reference Lima and Evangelista2006). Widely dispersed throughout tropical regions (Scherer et al., Reference Scherer, Zucareli, Zucareli and Fortes2005), L. leucocephala is also considered an invasive plant due to its allelopathic potential (Medina-Rosa et al., Reference Medina-Rosa, Fortes, Mauli, Palma, Marques, Corsato and Leszczynski2007; Williams & Hoagland, Reference Williams and Hoagland2007; Tuda et al., Reference Tuda, Wu, Tateishi, Niyomdham, Buranapanichpan, Morimoto, Wu, Wang, Chen, Zhu, Zhang, Murugan, Chou and Johnson2009). Moreover, this plant can easily establish populations in disturbed areas (Lima & Evangelista, Reference Lima and Evangelista2006), probably affecting plant community structure and ecosystem functioning. Therefore, L. leucocephala can be used for several purposes and, in some cases, is considered a ‘conflict-plant’ due to its tendency to spread rapidly and act as an invasive species (Neser, Reference Neser1994). This plant has two to four fructification cycles per year (Raghu et al., Reference Raghu, Wiltshire and Dhileepan2005), producing about 20 seeds per fruit (Stone, Reference Stone1970; Tuda et al., Reference Tuda, Wu, Tateishi, Niyomdham, Buranapanichpan, Morimoto, Wu, Wang, Chen, Zhu, Zhang, Murugan, Chou and Johnson2009), although considerable variation can be seen among populations in terms of fruit and seed sizes.
The bruchine A. macrophthalmus lays its eggs on L. leucocephala pods as well as directly on its seeds. After emerging from its egg, the developing larva perforates the seed, consuming the endosperm and, in most cases, the embryo (Effowe et al., Reference Effowe, Amevoin, Nuto, Mondedji and Glitho2010). A. macrophthalmus has four larval instars (Wu et al., Reference Wu, Wang and Wu2012), and Effowe et al. (Reference Effowe, Amevoin, Nuto, Mondedji and Glitho2010) observed that the duration of egg development was 4.52 days, on average. When beetles were reared directly on seeds, the development time of the larval–pupa period and the generation time were, on average, 33.39 and 34.59 days, respectively; adult females lived from 1 to 2 weeks and laid, on average, 43.1 eggs (Effowe et al., Reference Effowe, Amevoin, Nuto, Mondedji and Glitho2010). This beetle is considered a pre- and post-disperser seed predator and it has been suggested that A. macrophthalmus is an important biocontrol agent, since it has the potential of reducing the invasion rate of L. leucocephala trees by restricting their dispersion (Raghu et al., Reference Raghu, Wiltshire and Dhileepan2005).
Materials and methods
Collection and identification of parasitoids
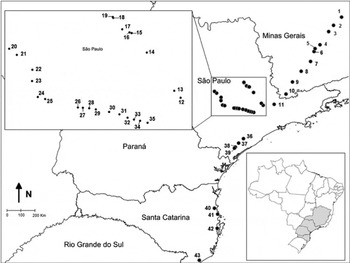
L. leucocephala fruits were collected in Brazil, considering a wide geographical gradient. From July to August 2013, and on May 2014, fruits were collected from 27 plant populations located on the edge of the Fernão Dias (BR-381), Régis Bittencourt (BR-116) and Governador Mário Covas (BR-101) highways, following a north–south route, from the city of Belo Horizonte (19°54′31″S; 44°1′34″W), in the state of Minas Gerais, to the city of Porto Alegre (30°1′14″S; 51°12′2″W), state of Rio Grande do Sul. In the state of São Paulo, fruits were also collected following two different routes into the northwest, from the city of São Paulo (23°32′17″S; 46°39′15″W) to the city of Bauru (22°18′53″S; 49°3′42″W) and from the city of São Paulo to the city of São Carlos (22°01′04″S; 47°53′27″W). In this case, fruits were collected from 30 plant populations located throughout the edges of the Presidente Castelo Branco (SP 280), Marechal Cândido Rondon (SP 300), Anhanguera (SP 330), Washington Luiz (SP 310) and Bandeirantes (SP 348) highways, from May to June of 2013 and in January of 2014. During fruit collection, each population had its location (geographical coordinates) recorded by GPS (GPSMAP 76CSx – Garmin). Overall, fruits were collected from a total of 57 plant populations, distributed over 11° of latitudinal range. However, because parasitoids did not emerge from 14 of the 57 plant populations, we considered only those 43 plant populations from which we recorded the parasitoids, resulting in 9° of latitudinal range (fig. 1). For the purpose of standardization, approximately 100 fruits (≅20 seeds per fruit) were randomly collected per L. leucocephala population, and we considered a population to be a group of five or more trees.
The small map, below and right, represents Brazil where the grey highlighted area shows the states where fruits of L. leucocephala were collected (exception to Paraná). The larger map (left) shows the distribution of L. leucocephala populations in the region where parasitoids were collected (numbered dots). Numbers refer to collection populations described in table 1. Numbers from 1 to 11, and from 36 to 43, refer to Fernão Dias (BR-381), Régis Bittencourt (BR-116) and Governador Mário Covas (BR-101) highways. Numbers from 12 to 19 refer to Anhanguera (SP 330), Washington Luiz (SP 310) and Bandeirantes (SP 348) highways; numbers from 20 to 35 refer to Presidente Castelo Branco (SP 280) and Marechal Cândido Rondon (SP 300) highways.

In the field, the collected fruits were put in labelled paper bags for transportation. In the laboratory (under conditions of 25 ± 1°C, 12 h light, 65 ± 5% relative humidity), fruits were dissected and seeds removed. Seeds with an irregular shape, those that were cracked, or dark brown in colour, were discarded. Over a 3-month period until the emergence of the parasitoids, the seeds from each population were kept in labelled transparent plastic containers (500 ml) partially covered with voile. After that, the parasitoids were sorted using a stereomicroscope (Leica M205C), quantified and transferred to small flasks containing 70% ethanol. The sample flasks were then labelled with the population of origin and sent to specialists for the purpose of identification to the lowest possible taxonomic level.
We did not have difficulties in collecting parasitoids because they emerged earlier than A. macrophthalmus and with a suitable synchrony in time, which allowed us to remove the parasitoids quickly from the recipients. However, a particular trait of A. macrophthalmus is that they also infest seeds after dispersion (post-dispersion seed predation). The emergence of adult bruchines was not too synchronized as it was to parasitoids, and some eggs had already been laid while we removed the bruchines from the containers. Hence, the abundance of A. macrophthalmus could not be precisely recorded because re-infestation within the containers was possible. We are confident that it is highly probable that the emerging wasps were, in fact, parasitoids of A. macrophthalmus (i.e. they were neither phytophagous nor parasitoids of other insects) because all seeds used were intact, or had the characteristic perforation hole left by the larvae of bruchines. Our position is further supported by the fact that except for wasps, only A. macrophthalmus adults emerged from the seeds during the whole study period.
Data analysis
Firstly, the relative abundance of parasitoid species was determined by dividing the number of individuals of each species by the total number of individuals collected. Using these data, a rank-abundance diagram was created to describe the evenness of species abundances (Magurran, Reference Magurran2004). To assess the viability of the sampling effort, a sample-based rarefaction curve was generated considering the observed number of species against the number of samples (i.e. populations). Another three sample-based curves were generated for the species richness estimators Chao1, Jackknife1 (nonparametric) and Michaelis–Menten (parametric), which provide information about the expected number of species (Magurran, Reference Magurran2004). We used three estimators because each one has its peculiarities, providing more accurate predictions about the number of species when combined. The Chao1 is based on the number of rare species in the assemblage (singletons divided by doubletons), while the Jackknife1 is an estimator that takes into account, specifically, the number of species observed in a single sample. On the other hand, the Michaelis–Menten estimator predicts the increase in species richness for additional sampling efforts (for more detailed descriptions of the species richness estimators, see Magurran (Reference Magurran2004)). In this way, observed and expected species numbers were compared.
After the above analysis, the Bray–Curtis index was used to determine similarity levels in parasitoid species composition between all pairs of plant populations. Values for the Bray–Curtis index ranged from 0 to 1 (similar to Sørensen's quantitative index), with a value of 0 representing totally dissimilar communities, while a value of 1 indicates communities that are entirely similar (Magurran, Reference Magurran2004). All curves (rarefaction and species richness estimators) and the Bray–Curtis similarity matrix were constructed using the EstimateS 9.1 software (Colwell, Reference Colwell2013), with the curves based on 999 randomizations plus the observed statistic. Using the PASSaGE (Pattern analysis, Spatial Statistics and Geographic Exegesis) software, version 2.0 (Rosenberg & Anderson, Reference Rosenberg and Anderson2011), a Euclidean distance matrix was constructed based on the geographical distances between all pairs of sampling sites (i.e. plant populations spatially referenced considering their geographical coordinates). In order to assess whether there was a correlation between species composition and geographic distances, the Mantel test (Mantel, Reference Mantel1967) was applied with 9999 randomizations plus the observed statistic (Fortin & Dale, Reference Fortin and Dale2005). The standardized Mantel statistic (r M) was run between the distance matrix and the Bray–Curtis similarity matrix.
Finally, a Mantel correlogram was generated (9999 randomizations plus the observed statistic) to determine the spatial structure of the parasitoid species composition. The Mantel statistic (r M) was then plotted against geographical distance classes (Fortin & Dale, Reference Fortin and Dale2005). The distance classes were established by using Sturge's rule: D + 1 + 3.3 log [n(n−1)/2]; where D is the number of classes and n is the sample size (Legendre & Legendre, Reference Legendre and Legendre1998). Each distance class had approximately the same number of pairs, and this method is known as the ‘equal frequency approach’, which provides a good estimation of spatial autocorrelation (Fortin & Dale, Reference Fortin and Dale2005). The correlogram significance was tested using the progressive (sequential) Bonferroni's correction: α’(D) = α/D, where α = 0.05 and D represents the distance class of interest. Correlograms are considered globally significant when at least one value is significant (Legendre & Legendre, Reference Legendre and Legendre1998; Fortin & Dale, Reference Fortin and Dale2005). It is important to emphasize, however, that Mantel correlograms usually show a decreasing trend, from positive (left) to negative (right) values. Therefore, to avoid confusion in interpretation, we inverted the Bray–Curtis similarity index during correlogram construction: values from 0 to 1 represented totally similar or dissimilar communities, respectively (i.e. large positive values of the Mantel's r M in shorter distance classes meant more similar communities than those farther apart, with smaller r M values).
Results
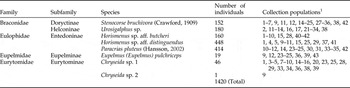
A total of 1420 parasitoids (all Hymenoptera) belonging to four families, five subfamilies and eight species were collected (table 1). The most representative families were Eulophidae and Braconidae with 1022 and 332 individuals collected, respectively (table 1). Horismenus sp. aff. distinguendus and Paracrias pluteus were the most abundant species, with respective numbers of 448 and 414 individuals collected (table 1). Urosigalphus sp., Horismenus sp. aff. butcheri and Stenocorse bruchivora showed intermediary abundances, with 180, 160 and 152 individuals collected for each respective species (table 1). On the other hand, Chryseida sp. 1 (Eurytomidae), Eupelmus (Eupelmus) pulchriceps (Eupelmidae) and Chryseida sp. 2 (Eurytomidae) were the least abundant species with 46, 19 and 1 individuals collected, respectively (table 1). Two individuals of Perilampus sp. were collected; however, because this species could be a secondary parasitoid, it was not included in our analyses.
Parasitoid species and their respective families, subfamilies, number of individuals collected and collection plant populations.

1 Numbers refer to L. leucocephala populations shown in fig. 1, where parasitoids were collected; the symbol ‘–’ represents a sequence of numbered plant populations (e.g. 9–11 means populations 9, 10 and 11).
In terms of the geographic distribution, most species were widely spread. For example, S. bruchivora, Urosigalphus sp., both Horismenus species and P. pluteus were observed in populations ranging from north to south, including several populations located in the state of São Paulo (table 1; fig. 1). Urosigalphus sp., on the other hand, was not collected in the southern plant populations (in the state of Santa Catarina); its distribution was very restricted to the state of São Paulo, with only one individual collected from a population located in the state of Minas Gerais (table 1; fig. 1). Similarly, despite the wide geographic distribution of P. pluteus, 389 of the 414 individuals collected were found in populations located in the state of São Paulo (table 1; fig. 1). Although S. bruchivora was less abundant than Urosigalphus sp., this braconid species was more widely distributed, occurring in all states (table 1; fig. 1). Horismenus sp. aff. butcheri also showed a wide geographic distribution, but individuals were collected from only two populations in the state of São Paulo, despite the large number of populations located in this state (table 1; fig. 1). It is interesting to note that even Chryseida sp. 1 and Eupelmus were widely distributed (although Chryseida sp. 1 specimens were not collected in the state of Santa Catarina) (table 1; fig. 1). The only individual of Chryseida sp. 2 was collected in the state of Minas Gerais (population 9; fig. 1).
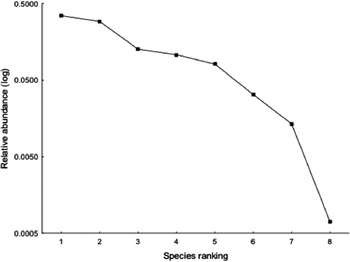
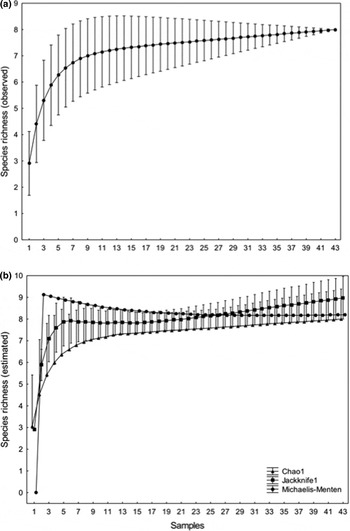
The rank-abundance diagram revealed high evenness in species abundance because few rare species were observed (fig. 2; table 1). Although the rarefaction curve did not indicate stabilization (there was no asymptote), the curve was very flat to the right, showing that the sampling effort was quite satisfactory considering the sample size (i.e. number of plant populations) (fig. 3a). Trends from the species richness estimators Chao1 and Michaelis–Menten were close to stabilization, reaching final average species richness values of 8.0 and 8.2, respectively (fig. 3b). The prediction from the Jackknife1 estimator did not stabilize, but its final value was 8.98, very similar to the other estimators (fig. 3b). Additionally, as the bars representing the confidence intervals from the estimators Chao1 and Jackknife1 overlapped (fig. 3b), there is a high probability that the two estimators did not differ qualitatively. Therefore, the observed species richness represented 100, 97.6 and 89.1% relative to those values expected from the Chao1, Michaelis–Menten and Jackknife1 estimators, respectively.
Rank-abundance diagram for the eight parasitoid species collected.

(a) Rarefaction curve (±95% CI) showing the cumulative number of parasitoid species richness (observed); (b) cumulative number of parasitoid species (±95% CI) based on the species richness estimators Chao1, Jackknife1 and Michaelis–Menten.

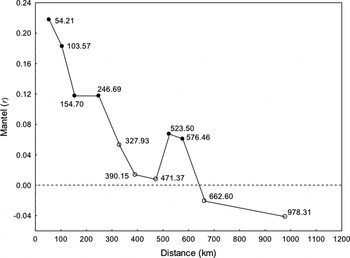
The Mantel statistic revealed spatial autocorrelation between similarity in species composition and geographical distance (r M = −0.216; P < 0.001; one-tailed – the negative sign in the Mantel statistics means that populations at shorter distances had similarity indices closest to 1.0). The Mantel correlogram showed significant statistics in six distance classes, four of which corresponded to the smallest distance classes situated, respectively, at approximately 54, 103, 154 and 246 km (fig. 4). Although significant values were also found in two distance classes representing paired populations located at intermediate distances (distances of 523.50 and 576.46 km), the Mantel statistics were smaller than those of paired populations situated at the four smallest distances (fig. 4). Hence, greater similarity in species composition was observed in populations near to each other than in those which were farther apart.
Mantel correlogram based on the Bray–Curtis similarity index. The standardized Mantel statistic (r M) is plotted against the geographical distance (km). The six distance classes with filled symbols identify significant values after progressive Bonferroni's correction (α = 0.05), which indicates that the correlogram is significant. The data label for each distance class is shown (the first class had 81 pairs, and the sixth and 11th classes had 83 pairs each; the other classes had 82 pairs compared).

Discussion
In this study, we found that Eulophidae and Braconidae were the most representative parasitoid families, with Horismenus (Eulophidae) being the most abundant genus. Parasitoids from these families have been found attacking bruchines, and some species have relevant implications for biological control programmes (Schmale et al., Reference Schmale, Wackers, Cardona and Dorn2001, Reference Schmale, Wackers, Cardona and Dorn2002; Ribeiro-Costa & Almeida, Reference Ribeiro-Costa, Almeida, Panizzi and Parra2012). The Horismenus genus is predominant in the New World, where 412 known species can be found in the Americas and only one species in Europe (Hansson, Reference Hansson2009) and one in Asia (Narendran et al., Reference Narendran, Girish Kumar and Kazmi2011); species from this genus are usually found parasitizing a wide range of hosts (i.e. immature stages of Coleoptera, Diptera and Lepidoptera orders), including bruchines (Ribeiro-Costa, Reference Ribeiro-Costa1998), particularly those from the Acanthoscelides genus (Schmale et al., Reference Schmale, Wackers, Cardona and Dorn2002; Silva et al., Reference Silva, Maimoni-Rodella and Rossi2007; Hansson, Reference Hansson2009).
Another Eulophidae species, P. pluteus, was also noteworthy as a parasitoid of A. macrophthalmus, since it was the second most abundant species. Paracrias species are exclusive to the New World, with great diversity in the tropics (Hansson, Reference Hansson2002). In Brazil, this species was first reported only recently (Pikart et al., Reference Pikart, Souza, Costa, Hansson and Zanuncio2011), with previous reports occurring in Costa Rica (Hansson, Reference Hansson2002). Although the literature confirms that little is currently known about this species, our results show that it is an abundant parasitoid of A. macrophthalmus, which is a new and important finding. The braconid Urosigalphus sp. was the third most abundant species in our study, even though it has only been scarcely reported for attacking bruchines (Steffan, Reference Steffan and Labeyrie1981; Traveset, Reference Traveset1991; Lopez-Martinez et al., Reference Lopez-Martinez, Figueroa-De la Rosa, Romero, Sanchez and Anaya2004). Noteworthy is the fact that we found five previously undescribed species (both Horismenus and Chryseida species, as well as Perilampus), indicating the extent to which taxonomic studies are still needed with parasitoids of bruchines.
The A. macrophthalmus parasitoids collected from populations closer to each other were more similar in species composition than those farther apart, which was representative of a spatial structure in species composition. Although we could present several processes that may have contributed to the spatial structure which we observed (Koenig, Reference Koenig1999), we will discuss the three which are likely to be most relevant. The first process is associated with the similarity in environmental conditions that populations in closest proximity are likely to experience (Moran, Reference Moran1953; Bjørnstad et al., Reference Bjørnstad, Ims and Lambin1999; Delava et al., Reference Delava, Allemand, Léger, Fleury and Gibert2014). If density-independent factors such as weather are stronger than density dependence (i.e. species interactions), then environmental conditions are the key driving force in the process of structuring populations and communities spatially. Density-dependent processes, however, can also play a very important role, and for parasitoids, these processes are complex and difficult to examine in field conditions (Tenow et al., Reference Tenow, Nilssen, Bylund, Petterssen, Battisti, Bohn, Caroulle, Ciornei, Csóka, Delb, De Prins, Glavendekić, Gninenko, Hrašovec, Matošević, Meshkova, Moraal, Netoiu, Pajares, Rubtsov, Tomescu and Utkina2013). One example is the top-down effect, where parasitoid predators (such as secondary parasitoids) may limit parasitoid abundances and distribution, when the predators’ attack rates are high. The intensity of attack rates imposed by parasitoids on their hosts may also affect their own distribution due to variation in host availability (bottom-up effect). A third process is the inherent dispersion ability of individuals among nearby populations (Bjørnstad et al., Reference Bjørnstad, Ims and Lambin1999; Reichenbach et al., Reference Reichenbach, Mobilia and Erwin2007; Berthier et al., Reference Berthier, Piry, Cosson, Giraudoux, Foltête, Defaut, Truchetet and Lambin2014).
Although we have suggested some processes to explain the spatial structure of parasitoids, we unfortunately could not record precisely the abundance of A. macrophthalmus (as mentioned earlier), which was a limitation of our study. Recording the host abundance would have allowed us to calculate the percentage of parasitism imposed by each parasitoid species, for example. Besides, some critical ecological processes from host–parasitoid interactions, especially bottom-up processes, could not be investigated. Such unrevealed processes certainly would help to explain the observed patterns of parasitoid abundance and evenness. Despite this caveat, for the A. macrophthalmus-parasitoids web, dispersion among nearby host populations seems to be the main process explaining the spatial structure of parasitoid assemblages. The similarity in species composition was clearly observed over a distance of approximately 250 km, which can be considered a large-scale structure. It is important to remember that the L. leucocephala populations were located on the edge of important highways. Thus, it is possible that the intense traffic (vehicles and people) might contribute significantly to the dispersion of L. leucocephala fruits and seeds infested with A. macrophthalmus (mainly immature stages), many of them containing developing parasitoids. This assumption is reinforced by the fact that the A. macrophthalmus parasitoids have short generation times and small body sizes, traits that favour dispersion at short distances; therefore, additional mechanisms of dispersion are needed to explain their spread over the large area observed in our study. Moreover, L. leucocephala is a widely distributed plant, usually colonizing disturbed areas (Scherer et al., Reference Scherer, Zucareli, Zucareli and Fortes2005). This life-history trait shows that L. leucocephala populations are rapidly established after seed dispersion. In short, we suggest that the great efficiency of L. leucocephala in dispersing seeds and its high ability at establishing new populations may significantly contribute to the dispersion of both, individuals of the host species A. macrophthalmus and its parasitoids.
Perilampidae individuals have previously been reported acting as primary and secondary parasitoids (Heraty & Darling, Reference Heraty and Darling1984; Roque & Trivinho-Strixino, Reference Roque and Trivinho-Strixino2006). Therefore, while it is possible that Perilampus sp. acted as a secondary parasitoid in our study, only two individuals were collected in total, and both were found in the same sample, suggesting that they emerged from the same host. Whether or not this species parasitizes bruchines cannot be confirmed, and requires further investigation on a taxonomic and ecological level. Despite the large number of parasitoids collected (1420), the parasitism rate was low, as judged based on the high emergence of the host A. macrophthalmus (A. Wood & E.B. Haga, personal communications, 2015). Based on these assumptions, bottom-up (host availability) and top-down (mortality imposed by natural enemies) effects are unlikely processes to explain the spatial structure we found. It is possible that the spatial structure was affected by the geographic variation in environmental conditions (i.e. weather/climate). For instance, Eurytomidae species (Chryseida) and Urosigalphus sp. were not found in the south, where mean temperatures are lower during the winter. Although we cannot disregard local environmental effects, the lack of Eurytomidae species in the south has to be interpreted with caution, since only four populations were located in this region (state of Santa Catarina), and most species exhibited a wide geographic distribution and a high level of evenness in terms of abundance; hence, facilitated dispersion appears to be the most likely process to explain the large-scale spatial structure in parasitoid species composition.
Our results also revealed a slight significant increase in the similarity of species composition at large distances (523.50–576.46 km), producing a wavelike pattern. Oscillations through space have been shown to exist in populations. It is common for nearby populations to show higher synchrony in abundance than those farther apart (Bjørnstad et al., Reference Bjørnstad, Ims and Lambin1999). In some cases, however, after a certain distance, the synchrony stops decreasing and a new increase begins, producing travelling waves, a poorly understood ecological phenomenon (Bjørnstad et al., Reference Bjørnstad, Ims and Lambin1999; Moss et al., Reference Moss, Elston and Watson2000; Johnson et al., Reference Johnson, Bjørnstad and Liebhold2004). Recent findings have suggested that landscape obstacles can create limits to dispersion, separating a large population into groups where individuals move more locally (i.e. at short distances), shaping travelling waves into space (Berthier et al., Reference Berthier, Piry, Cosson, Giraudoux, Foltête, Defaut, Truchetet and Lambin2014). Although numerous ecological patterns detected at the level of populations may be hierarchically transferred into communities, as far as we know, travelling waves have not yet been explicitly described considering a pool of species. Whether the oscillating pattern in species composition we found was governed by a particular landscape configuration is unknown, but certainly it deserves further investigation.
In this study, we found eight parasitoid species using A. macrophthalmus as a host, distributed throughout a large geographic area. Based on the results of the species richness estimators, our data fitted very well to the predictions. Most species showed a wide spatial distribution, describing high evenness. We characterized the large-scale spatial structure in parasitoid species composition, where greatest similarity was mostly observed in nearby populations. Despite the beneficial properties of L. leucocephala, this plant is usually treated as invasive (Lowe et al., Reference Lowe, Browne, Boudjelas and De Poorter2000). Hence, it has been suggested that A. macrophthalmus can be an important biological control agent of this plant, even though the percentage of seeds damaged is usually small (Egli & Olckers, Reference Egli and Olckers2012; Sharratt & Olckers, Reference Sharratt and Olckers2012; English & Olckers, Reference English and Olckers2014). Therefore, the knowledge of the parasitoid species that attack A. macrophthalmus as well as their distribution is undoubtedly relevant, and can indirectly affect the efficiency of this seed-feeding beetle as a biocontrol agent.
Acknowledgements
We thank Daniela H. Maggio for providing valuable help during the editing of Fig. 1 (map). E. B. Haga, M. N. Rossi and V. A. Costa are grateful, respectively, to the Coordenação de Aperfeiçoamento de Pessoal de Nível Superior (CAPES), Fundação de Amparo à Pesquisa do Estado de São Paulo (Fapesp; n° 12/11612-4) and Instituto Nacional de Ciência e Tecnologia dos Hymenoptera Parasitoides da Região Sudeste Brasileira (INCT/HYMPAR), for financial support. We also thank the researchers Dr Zuleide Alves Ramiro, Matheus Alves de Siqueira, Christer Hansson, Gary A. P. Gibson, D. Christopher Darling and Nelson W. Perioto for their help in the identification of parasitoids.