I
There is an abundant literature on sovereign debt finance and the measures insisted upon by foreign creditors and institutions to allow defaulting countries to re-enter international capital markets, both for contemporary and historical time periods (see e.g. Esteves and Tunçer Reference Esteves and Tunçer2016; Mitchener and Weidenmier Reference Mitchener and Weidenmier2010). But to what extent might such controls be of importance for emerging countries seeking to enjoy cheaper access to international credit markets? Although the existing historical literature suggests they often play a role, the present work nuances this through the case of Romania in the years before World War I.
We place Romania in the context of three other southeast European countries, specifically Bulgaria, Greece and Serbia. Our inspiration for this comes partly from the seminal work on the economic history of the Balkans by John R. Lampe (Reference Lampe1975, Reference Lampe1982). Importantly, he argues that there are ‘common points of reference’ (Lampe Reference Lampe1975, p. 56). These include first, centuries of Ottoman domination; second, the presence of ‘almost virgin territory for nineteenth-century expansion’ (Lampe Reference Lampe1975, p. 57); third, complete or near complete independence in 1878;Footnote 1 fourth, no border changes from 1886 to 1912, and a lack of war over the same period, except for the brief Greek war with the Ottoman Empire in 1897; and finally, the fact that the currencies of the four nations were formally or informally tied to a common nominal unit under the rules of the Latin Monetary Union (Lampe Reference Lampe1975, pp. 57–9). Given this, Lampe asks ‘Why did pre-1914 Romania achieve totals of gross industrial output per capita that were well over twice those of Serbia and Bulgaria and probably Greece?’ (Lampe Reference Lampe1975, p. 60). We ask a different but related question: why was Romania able to borrow so much more successfully than its neighbours in this period? We argue that this was partly due to institutions, as we discuss more below, including a relatively independent central bank, and credible commitment to the gold standard. However, we also demonstrate that Romania differed in terms of its abundant natural resources and thus ability to export. Since creditor nations would sometimes administer income streams of defaulters, this export revenue as ‘potential collateral’ could be seen as a guarantee that, if the Romanian state failed to meet its payments, repayment might anyway be ensured.
The present work is the first to analyse the four Balkan countries together, and we are the first to explore in depth the interesting exception of Romania, which borrowed successfully despite never conceding any form of international financial control in contrast to its three neighbours. Of these, the case of Greece is perhaps the most famous; see for example Mitchener and Weidenmier (Reference Mitchener and Weidenmier2010) on the so-called ‘supersanctions’ imposed. Similarly, Tunçer (Reference Tunçer2015) considers Egypt, the Ottoman Empire,Footnote 2 Serbia and Greece and finds that international financial control played an important role, although a variety of other factors also had importance for each country (see also Tunçer Reference Tunçer, Barreyre and Delalande2020). Beyond Europe, we complement recent work on Latin America by Flores Zendejas (Reference Flores Zendejas, Barreyre and Delalande2020) and offer a more nuanced story compared to those which consider loss of sovereignty to be a precondition for the ability of emerging economies to borrow on international markets.
We present a new dataset based on the Berlin stock exchange, which we have collected from a contemporary German newspaper – the Berliner Börsen-Zeitung (BBZ) – as well as existing data from the well-known Investor's Monthly Manual (IMM) for the London market. This is of more general interest for the analysis of sovereign bond finance issues during the first era of globalization. Then, applying this new data, we investigate the case of the four emerging markets in the Balkans from 1878 until the end of the classical gold standard period. By calculating yields and constructing sovereign bond spreads for each country, we are able to track the relative creditworthiness of the countries. We complement this with a panel data analysis, including the standard determinants of spreads. Our results demonstrate that the Romanian exception owes much to that country's abundant natural resources and desirable exports.
Our work relates more generally to the substantial literature on the determinants of creditworthiness, much of which we reference below: for example, Flandreau and Zumer (Reference Flandreau and Zumer2004) on the importance of economic ‘fundamentals’; Flandreau et al. (Reference Flandreau, Le Cacheux and Zumer1998) on the impact of war; Clemens and Williamson (Reference Clemens and Williamson2004) on the role of supply and demand for capital; Dincecco (Reference Dincecco2009) on the role of politics; Collet (Reference Collet2012) on the importance of underwriters; and Stasavage (Reference Stasavage2016) on the importance of distributive politics.Footnote 3 It also relates to various studies on the impact of loss of sovereignty on the cost of borrowing: see, for example, Bordo and Rockoff (Reference Bordo and Rockoff1996) on the role of the gold standard as a ‘good housekeeping seal of approval’. Under the classical gold standard before 1914, a period of highly integrated capital markets, foreign creditors or creditors’ governments punished defaulting sovereigns by imposing severe sanctions, which affected their national sovereignty.Footnote 4 Thus, Mitchener and Weidenmier (Reference Mitchener and Weidenmier2005) find that the threat by the United States to intervene in the affairs of Central American and Caribbean countries that did not pay their debts (ultimately using gunboat diplomacy) led to considerable increases in their bond prices, and enabled debt settlements to be reached. Turning to a larger panel of countries, Mitchener and Weidenmier (Reference Mitchener and Weidenmier2010) have also demonstrated the importance of what they term ‘supersanctions’, defined as episodes where the defaulting country either lost fiscal sovereignty, or faced actual or threatened military intervention. They document twelve cases of such extreme measures under the classical gold standard, and find that fiscal discipline improved and bond traders lowered their assessment of the default risk in countries subject to them. Importantly in this context, Gardner (Reference Gardner2017, Reference Gardner, Barreyre and Delalande2020) considers three British West African colonies and contrasts their experience with that of independent Liberia, finding that ‘supersanctions’ were not a complete substitute for colonial rule.
The remainder of this article proceeds as follows. Section II describes our data, documents the debt issued and illustrates the spreads. In Section III, we consider the Romanian case in comparison with its Balkan neighbours and in Section IV we provide a formal analysis of the determinants of bond spreads. Section V concludes.
II
Previous studies of sovereign debt have tended to focus on the London market, using data from the Economist's Investor's Monthly Manual.Footnote 5 In part, this is because the data are easily available thanks to the efforts of the Yale School of Management and the London Stock Exchange Project. More importantly, this was certainly the largest and most liquid market before World War I, but after 1870, Western Europe was either less in need of British capital, or was considered untrustworthy. There was an ever-greater bias towards bonds from the British Empire, and in general towards markets outside Europe (Bersch and Kaminsky Reference Bersch and Kaminsky2008). For an assessment of the creditworthiness of certain European nations, we are thus forced to look elsewhere: as Daudin et al. (Reference Daudin, Morys, O'Rourke, Broadberry and O'Rourke2010) note, the ‘French and the German cases appear somewhat different and await further investigation.’ Paris was the second most important bond market outside London, but France was weakened politically by its defeat by Prussia in 1871 (Feis Reference Feis1930). Thus, the present work makes use of data collected from the Berlin market. Bersch and Kaminsky (Reference Bersch and Kaminsky2008) provide a detailed description of the structure of the German market at this time. Germany became an important financial centre with the unification of the country in 1871, and political unification led to harmonization of economic life, for example, the introduction of the gold standard in 1873 and the establishment of the central bank, the Reichsbank, in 1875. Berlin rapidly replaced Frankfurt as the financial centre of the country, although the Berlin stock exchange itself could trace its origins to a decree from 1796. Syndicates, often international, were usually responsible for underwriting and issuing foreign securities, with sub-participants often also involved in order to reduce liabilities. The leader of the syndicate would usually sell the securities on the stock exchange or trust another company or bank to do so.
The Berlin market also allows us to add the Romanian bonds, which were not traded in London apart from three early bonds before 1880. German investment stood in sharp contrast to that from Britain: it mostly went to European countries, and little went to areas of recent settlement. The new sovereign nations of southeastern Europe turned increasingly to Berlin, and in the beginning, at least, German investors were happy to invest. In fact, German foreign investment was focused on nearby states, particularly those to the east. The governments of these countries were seeking friendly alliance with Germany, or were worried about the international power the country demonstrated during the war with France. Moreover, they needed German capital to exploit their resources, and Germany, for its part, was looking for raw materials, and to sell manufactures (Feis Reference Feis1930, p. 73). German foreign investment was principally in fixed interest-bearing securities, especially the bonds of foreign governments (Feis Reference Feis1930, p. 78; Bersch and Kaminsky Reference Bersch and Kaminsky2008, p. 14), and by 1914 over half of German foreign investment (totalling approximately 13.5 billion marks) went to Europe, of which approximately 1.7 billion went to the Balkan countries. Although Fishlow (Reference Fishlow1985) argues that while British capital largely financed export-related industries and infrastructure projects, French and German lending was mostly aimed at balancing government accounts. The Romanian case is, however, interesting from this perspective, since it attracted German capital for exporting industries.
Our data are collected from the newspaper Berliner Börsen-Zeitung,Footnote 6 and consist of monthly prices of government bonds quoted and traded on the Berlin stock exchange.Footnote 7 To build a comprehensive set of bonds for each country we also rely on additional quotations of bonds traded on the London market, from the Investor's Monthly Manual. The sample period runs from January 1880 until December 1913, and the dataset includes 5 bond series for Bulgaria, 11 bond price series for Greece, 15 for Romania and 4 Serbian bonds. Table A.1 in the online Appendix lists all the bonds in our dataset and specifies where each bond was traded: whether in Berlin, London, or on both capital markets.Footnote 8 Furthermore, the table gives an overview of the sources of the quotations used, i.e. Berliner Börsen-Zeitung or the Investor's Monthly Manual.Footnote 9 During the period we look at, the Romanian bonds are not traded at all in London, and almost all of the Serbian securities are quoted only in Berlin. Therefore, for these countries we rely on Berliner Börsen-Zeitung. Almost half of the Greek bonds are traded in both markets, whereas in the case of Bulgaria, only one bond is traded on both exchanges, with the rest of its securities being quoted in London only.
In order to capture creditworthiness, we calculated bond spreads as the difference between the Bulgarian, Greek, Romanian or Serbian yields and those on British consols. The latter are commonly used in the literature as the benchmark for ‘riskless bonds’, and make our series comparable to previous work. Thus
 $$s = i-\;i^\ast $$
where i is the yield to maturity on the bondsFootnote 10 of the Balkan government, and i* is the yield on British consols.Footnote 11 In other words, the return on a risky bond equals the risk-free rate of return plus a risk premium, i.e. the spread, which investors demand in order to be compensated for the risk they face. This risk can be separated into three components: default risk, currency risk and liquidity risk.
The first, the default risk, is the probability that a government stops honouring its debt obligations by ceasing repayment on the principal or interest. This is the main interpretation of the spread that we have in the present work, since the other two factors are unlikely to be of importance for the bonds we are looking at. Regarding currency risk, this only becomes an issue if a bond is issued in a currency other than that of the investor, and arises due to the possibility of exchange rate fluctuations. To some extent we avoid the exchange rate risk problem because in our sample the bonds are not denominated in national currencies, but in pounds, francs or marks which were fixed against one another through gold, which is typical for the nineteenth century. Moreover, from 1880 to 1914 the principal currencies, all on the gold standard, fluctuated little against each other (Bordo and Rockoff Reference Bordo and Rockoff1996). Consequently, the currency risk is mainly an issue for the government issuing the debt, where a drop in the value of the national currency implies that the repayment of the debt would become more expensive. This would translate into an increased risk of default. Finally, regarding the liquidity risk, which comes from the risk that fewer liquid assets are sold during poor market conditions, this would only be an issue for bonds which are issued in small volumes and are facing a weak demand. Alquist (Reference Alquist2010) has demonstrated that liquidity risk was priced in the sovereign bonds of the nineteenth century and is comparable in magnitude to modern-day estimates. It is therefore not evident that liquidity risk can be ignored when estimating sovereign borrowing costs. It is difficult to see how to deal with this with the available data; nevertheless, a reflection of the liquidity of the Berlin market is that we found it was extremely rare for a price not to be quoted on the last day of the month (unless it was Sunday or a public holiday).
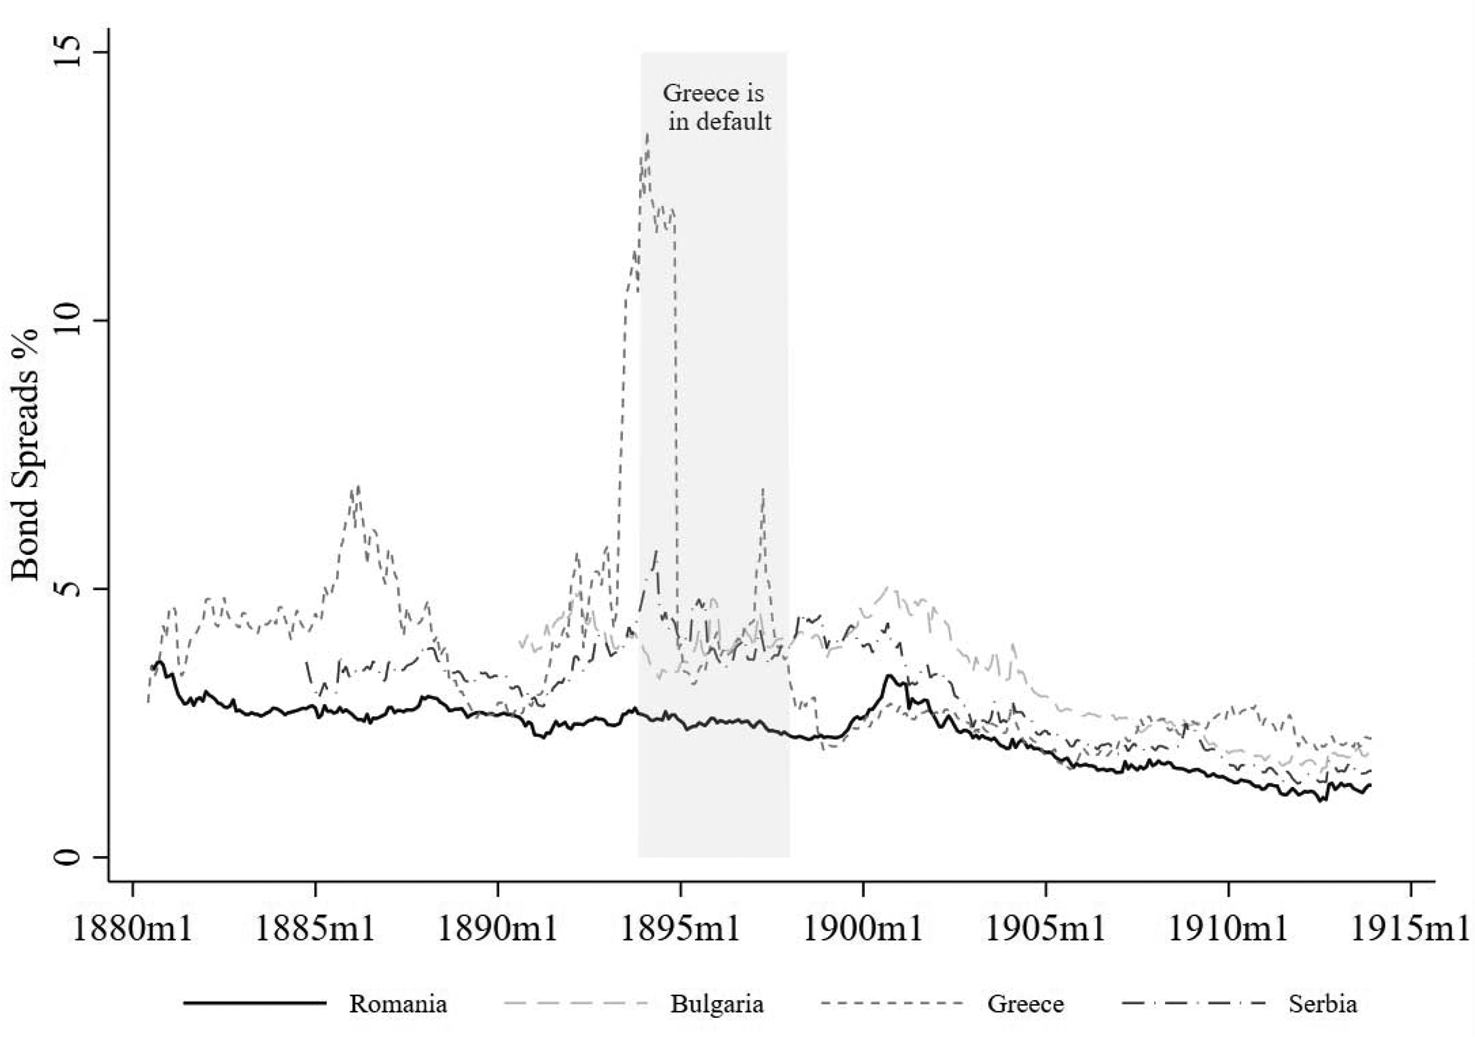
Figure A.1 in the online Appendix illustrates the risk premiums by country for all the bonds in our dataset. Within a country, some bonds are riskier than others. Therefore, we next compute country risk by aggregating all the bonds within a country by weighting the yield to maturity of each bond according to the bond's nominal value.Footnote 12 Figure 1 compares the sovereign risks of the four Balkan countries.
Balkan country spreads over London consols, 1880–1913
Source: Berliner Börsen-Zeitung and the Investor's Monthly Manual.

We can already note at this stage that Greece experienced very high costs of borrowing before the turn of the century, after which point it was at times able to borrow more cheaply than any of the others. Otherwise, Romania generally experienced relatively favourable costs of borrowing throughout the period. In interpreting the figure, it should be noted that we have included bonds of different characteristics. In particular, most of the Romanian bonds were issued without collateral, while in the other three cases most of the bonds were issued with collateral. Therefore, the observed differences in the bond spreads between the Romanian bonds and those of the other countries are most likely an underestimate of the true differences. Also note the general decline in spreads towards the end of the period.
Capital flows to the four Balkan countries began or intensified after 1878. A complete description of all the bonds issued by these countries is given in Tables A.2–5 in the online Appendix. The issuance of the first bonds can in all four cases be explained by a combination of push and pull factors. The countries experienced high expenditures but limited capacity for collecting revenues (Morys Reference Morys2017). Furthermore, the borrowers looked forward to economic development, and they tried to align themselves with the more developed nations (Lampe Reference Lampe1982). Thus, many contracted loans in order to finance the construction of railways, which were key to the integration of markets. They also required foreign capital for other purposes such as the development of state and local institutions, fortifications, bridges, education, military organization, armaments, wars, the buying back of state monopolies, and budget deficit financing (Lampe Reference Lampe1982). More specifically, the first Greek loan was a war loan to support the revolution and in the case of Serbia and Bulgaria the first loan was aimed at the construction of a rail link which was part of an international obligation (Morys Reference Morys2017). By contrast to the other Balkan countries, the first Romanian loan was contracted based on economic motivations, namely the construction of railways to transport wheat (Lampe and Jackson Reference Lampe and Jackson1982).
The process of accessing capital markets was similar across the countries, since all resorted to bank intermediation in order to float their loans (see the information in Tables A.3–6). Thus, as noted above, usually a bank or a syndicate of banks undertook the government loan by buying in advance the sovereign bonds, and subsequently placing them on the capital markets. Often, bonds were also issued with collateral, the necessity or otherwise of which gives some indication of the creditworthiness of the issuers.
In the finance literature it is well known that borrowers can reduce their risks and borrowing costs through the use of collateral. During the classical gold standard period, sovereigns in need would often make use of this. These secured bonds would serve the interest of creditors, since they safeguarded the interest and capital payments, while the issuing governments could benefit from reduced interest rates or otherwise improved conditions for their bond issues. Such collateral could take different forms. One possibility was to use the real estate of sovereigns as a way of guaranteeing the payment, as in the case of Egypt from 1870 to 1877 (Esteves and Tunçer Reference Esteves and Tunçer2016). However, the most common arrangement from the 1880s onwards was to assign particular state revenue streams as a pledge for securing the loan. These revenues could, for example, be from state monopolies, customs or railway revenues. Tobacco, stamp, salt and railway revenues were those most frequently used by the Balkan countries.
We have documented the collateral used for the Balkan bonds in Appendix A (available online). From this is it apparent that there is much variation within the group. On the one hand is Serbia, which contracted all its loans using collateral (Table A.5), while on the other is Romania, which managed to discharge itself of this practice early on (Table A.4). In fact, Romania only offered collateral for its first two loans, which were contracted in 1880. In other words, only 10 per cent of its loans from foreign governments had collateral attached. Bulgaria and Greece resemble more Serbia in this respect since they used revenue ‘mortgaging’ quite extensively (Tables A.2 and A.3). In Bulgaria, the government had to offer collateral for all its foreign borrowing, with the exception of the last bond, issued in 1909.
Thus already the picture which emerges is that the creditworthiness of all the Balkan governments, bar Romania, was doubtful. Foreign banks found the southeast European borrowers risky, and as a result they demanded guarantees. Thus Bulgaria, Greece and Serbia went from using collateral as a contractual feature to granting creditors direct access to the revenues pledged for servicing the debt. Again, Romania was an exception because the revenues pledged as guaranties for the loans remained under Romanian control and were collected in the ordinary way, although export revenue streams might clearly have been seen as potential collateral, if the situation deteriorated. We did not find any direct evidence of discussions of this in the pages of BBZ, but investors in that newspaper, as well as other outlets, could read regular reports about trade and industry, so they would certainly have been informed of this when choosing where to invest. We provide an empirical investigation of the importance of the trade channel below.
III
With the exception of a few years, particularly in the first years of the twentieth century, Romania enjoyed lower costs of borrowing than the other Balkan countries. Moreover, it never seems to have been in danger of international financial control. Although it was a large and frequent borrower – by 1900, 40 per cent of government revenue went on paying back loans – it was considered to be more creditworthy. This is apparent from the low spreads, but also from the fact that, except at the very beginning, it did not need to pledge government revenues when issuing debt.
After 1900 Romanian loans were mostly mediated by Diskonto-Gesellschaft, Bleichroder and Rothchild and Sons, and between 1900 and 1914, Romania secured six loans on the German market, for a sum total of about 43.5 million pounds sterling, conditioned on the purchase of rolling stock and armaments from German companies (Mureşan and Văsioiu Reference Mureşan and Văsioiu2008, p. 73). Due to favourable agricultural conditions and increasing exports, Romania was able to pay off an important part of its external debt before World War I (Mureşan and Văsioiu Reference Mureşan and Văsioiu2008, p. 73). Until 1913, most borrowing went on ‘productive purposes’ (especially infrastructure and agricultural credit), and the debt was serviced according to schedule. In 1914, 52 per cent of Romanian debt of around 67.3 million pounds sterling was held in Germany,Footnote 13 and Berlin had previously been an even more important source of capital, until Romania's increasingly close ties with Russia led to German investors disposing of their securities from around 1912 (Feis Reference Feis1930, pp. 268–9).
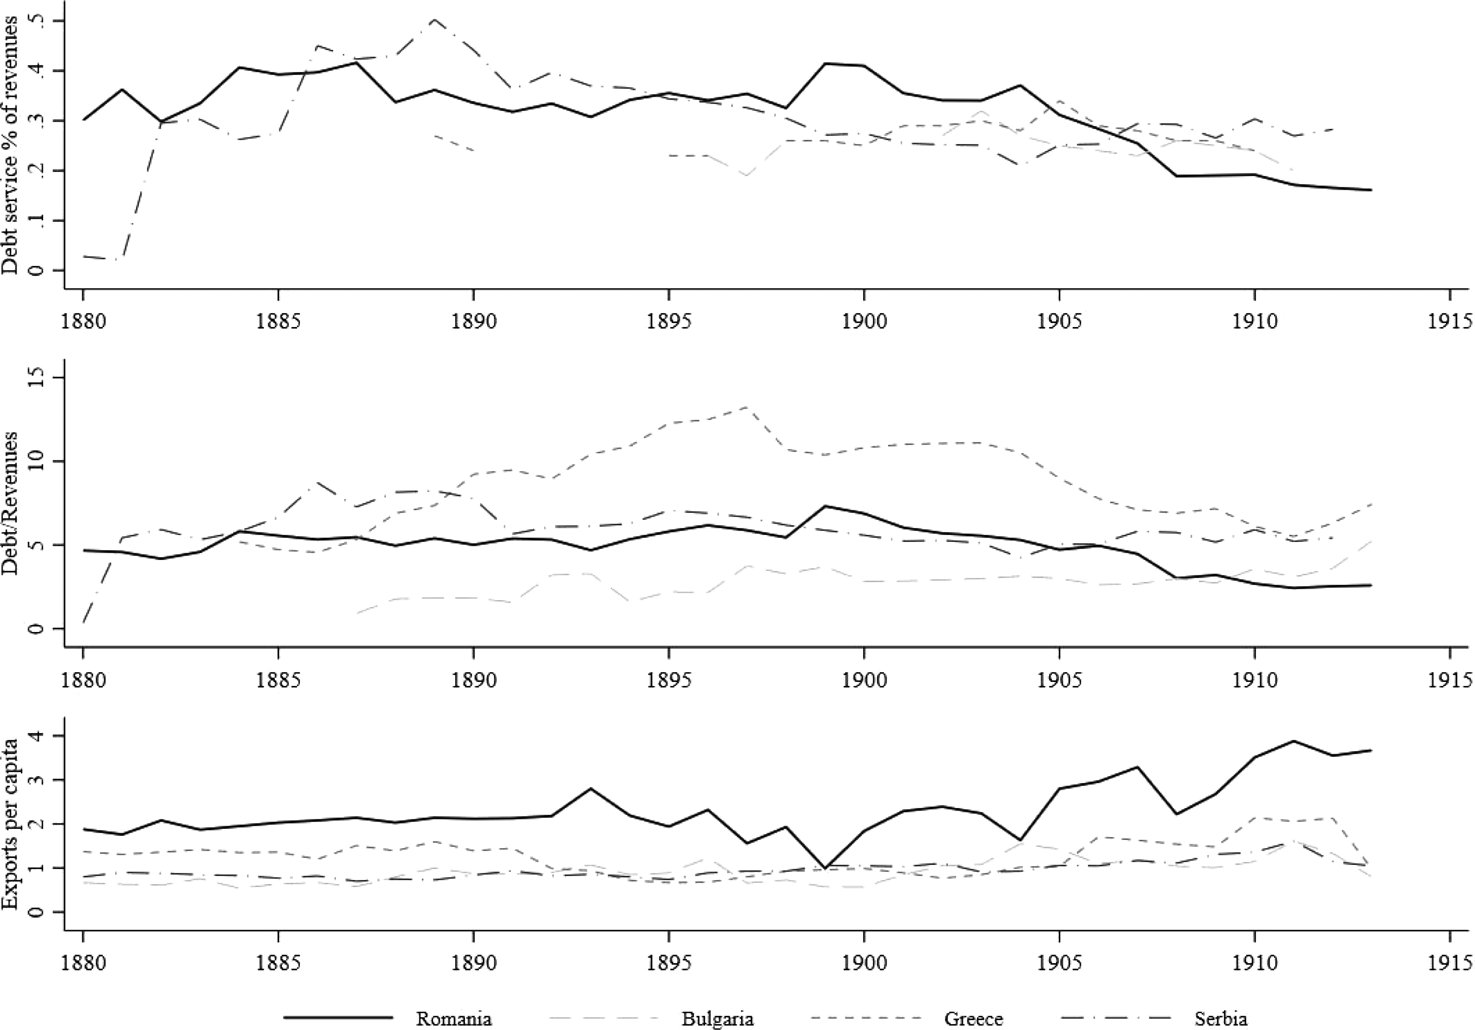
Why was Romania different? For this period, creditworthiness was usually judged by international investors through levels of debt, and the cost of servicing it (Mauro et al. Reference Mauro, Sussman and Yafeh2006). A country with higher levels of debt might be considered to be more risky, and would endure higher borrowing costs. Indeed, as Flandreau and Zumer (Reference Flandreau and Zumer2004) demonstrated, in the late nineteenth century, borrowers whose ‘governance’ was suspect had to face extremely high interest charges and discount rates. To avoid this, they had to demonstrate that their financial ‘fundamentals’ were sound. Another focus of investor attention was trade. Ferguson and Schularick (Reference Ferguson and Schularick2006) note that, in the absence of GDP per capita statistics to get an idea of the degree of institutional and economic development of a country, exports per capita were used as an alternative measure to proxy for the risk-reducing factors associated with economic development. Thus, countries with a current account surplus were generally regarded as having a greater ability to service their foreign debts. Figure 2 shows total debt service of revenues,Footnote 14 debt to revenue ratio and exports per capita of the four Balkan countries.
Macroeconomic fundamentals 1880–1913
Source: Banu (Reference Banu2012), Ferguson and Schularick (Reference Ferguson and Schularick2006), Gnjatovic (Reference Gnjatović2009).

As Figure 2 reveals, although Greece stands out as a profligate borrower, there is no indication that Romania was exceptional in terms of financial fundamentals, since both debt service and debt to revenues appear similar to that of the other countries. However, turning to trade, Romania clearly was a more successful exporter, given its greater exports per capita. This was partly because Romania's agriculture, although traditional, grew rapidly (Constantinescu Reference Constantinescu1994, p. 179). Agricultural yields were much higher in Romania than in the other Balkan countries, and by 1910 the Romanian wheat export value had overtaken that of the US to be fourth in the world (Lampe Reference Lampe1975, p. 63).
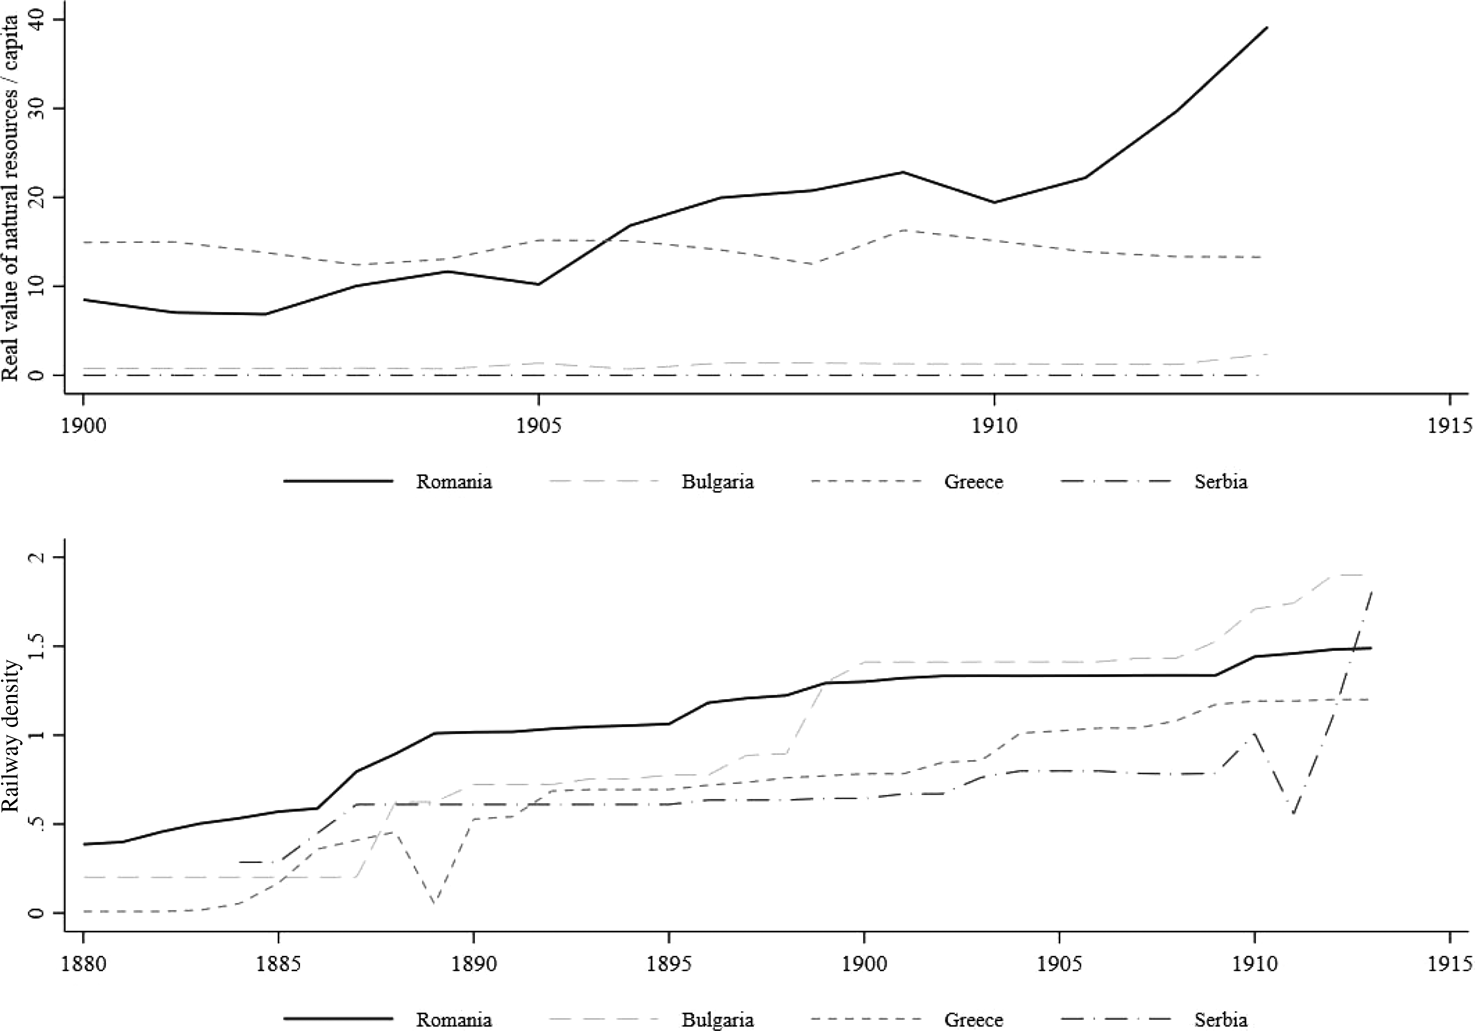
Furthermore, as Figure 3 also suggests, Romania had plentiful access to raw materials, which creditors are likely to have seen as a potential source of reimbursement in the case of default. Indeed, the first oil production anywhere was officially recorded in 1857 in Romania and by 1900 it was the third largest oil producer in the world, with an annual production of 1.9 million barrels (Dicea and Enachescu Reference Dicea and Enachescu2000). Clemens and Williamson (Reference Clemens and Williamson2004) stressed the role of supply and demand for capital for British lending patterns, and demonstrate that British capital exports went to countries with abundant natural resources, as well as a supply of labour and human capital to exploit them, that is areas with plenty of immigrants, and young, educated urban populations.Footnote 15 For this to happen, they needed railways to make them accessible, land needed to be improved, etc., and British capital made this possible. Similar factors might have played a role in Romania's success.
Natural resources and railways, 1880–1913
Source: Haber and Menaldo (Reference HABER and MENALDO2011) and Mitchell (Reference Mitchell1998).
Note: Real value of total natural resources produced per capita. Total resources include petroleum, coal, natural gas and metals. Railway density is computed as total length of active railways in km per square kilometre of land.

Figure 3 demonstrates clearly how the value of natural resources in Romania increased over time, while it remained low in the other three countries. In addition, regarding railway density, Romania expanded early on. Around the turn of the twentieth century, the expansion of the Romanian railway system entered a phase of stagnation while Bulgaria experienced a large increase. Overall, railway density in Romania is greater for a longer period and remained higher than that of Greece and Serbia.
Nevertheless, many studies have demonstrated that spreads could deviate considerably from fundamentals: some countries were able to borrow much more cheaply than others, despite otherwise similar macroeconomic conditions. One reason is that history matters: having a history of financial crises negatively affects the ability of a country to borrow, in a way which is not related to macroeconomic fundamentals. This is what Reinhart et al. (Reference Reinhart, C. and and SAVASTANO2003) have termed ‘debt intolerance’: some countries with low debt ratios end up defaulting, while others manage despite very large debt ratios. For example, Greece, which was in default from 1826 to 1880 on loans secured with its movement towards autonomy prior to formal independence (Mitchener and Weidenmier Reference Mitchener and Weidenmier2010), often suffered from punitive borrowing costs.Footnote 16
Large panel data studies have predictably found war and peace to be important determinants of spreads (see Flandreau et al. Reference Flandreau, Le Cacheux and Zumer1998; Obstfeld and Taylor Reference Obstfeld and Taylor2003; Ferguson and Schularick Reference Ferguson and Schularick2006; Mauro et al. Reference Mauro, Sussman and Yafeh2006), and country studies have reached similar conclusions. For example, Sussman and Yafeh (Reference Sussman and Yafeh2000), in their analysis of Japanese government bonds traded in London between 1870 and 1914, find an exceptional role for Japan's victory against Russia in 1905. Romania was the only one of the Balkan countries not to be involved in war until the Second Balkan War in 1913.
Dincecco (Reference Dincecco2009) argues for the importance of the political regime: centralized democracies could be expected to spend more wisely, thus reducing their sovereign credit risk. Here, however, there is little to suggest that Romania was a shining example. Although Serbia only transitioned to democracy after the ‘May Overthrow’ in 1903, Greece adopted a democratic constitution in 1864, and Bulgaria adopted the democratic ‘Tarnovo’ constitution soon after independence in 1879. Romania introduced democracy in 1866, but parliament was in reality dominated by landed interests, with little influence given to the vast majority of agricultural peasantry (Seymour and Frary Reference Seymour and Frary1918). Likewise, although the role of the underwriter has been stressed by Collet (Reference Collet2012) for the case of Belgium after independence, emerging markets were in practice always underwritten by an investment banker or a European banking syndicate (Esteves Reference Esteves2013), so there was also little to differentiate the Balkan countries in this respect (see Tables A.1–4).
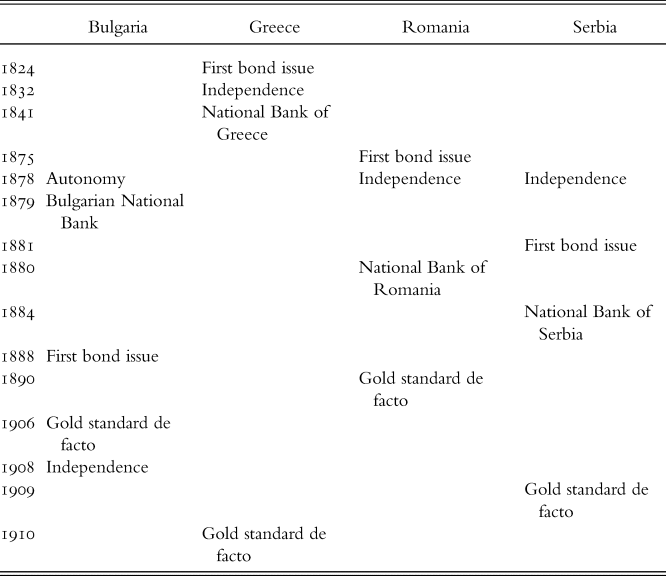
Another factor which might explain the relative performance of the countries was their institutional setup. Recent work has highlighted the importance of the quality of institutions for growth and development through asset prices; see Alquist et al. (Reference Alquist, Chabot and Yamarthy2020). As previously stated, three of the four countries were effectively independent states with the Treaty of Berlin in 1878,Footnote 17 and they continued a process of nation building that started prior to independence. In Table 1, we concentrate on two policies which might be considered relevant as determinants of the bond spread: the establishment of a central bank and membership of the gold standard. Bordo and Rockoff (Reference Bordo and Rockoff1996)Footnote 18 argued that membership of the gold standard marked a ‘good housekeeping seal of approval’. Although the gold standard necessarily limited domestic policy through the sacrifice of monetary independence, countries which were able and willing to commit must have enjoyed a certain set of institutions, and a commitment to global markets, that signalled to investors that their bonds were relatively safe. In other work, however, Alquist and Chabot (Reference Alquist and Chabot2011), dispute the link between the gold standard and cheap capital, finding no evidence in a large database of 55,000 monthly sovereign bond returns. Moreover, Mitchener and Weidenmier (Reference Mitchener and Weidenmier2009) and Ferguson and Schularick (Reference Ferguson and Schularick2012) point out that for developing countries risk premiums did not fall after the adoption of the gold standard.
Timing of economic, political and institutional changes

Source: Morys (Reference Morys2017).
Although, apart from Greece, not formally members, the Balkan countries introduced monetary laws intending to comply with the Latin Monetary Union (LMU) in the late 1860s, and in 1880 for Bulgaria (Einaudi Reference Einaudi2007). Since this initially implied a bimetallic standard, they were frequently contending with the problem of agio, or fluctuations in the market price of silver relative to gold. The most effective solution to this was to adopt the gold standard, which Austria–Hungary did in 1890, leading to a bandwagon effect. First, Romania joined in 1892 after contending for some years with serious agio problems. Bulgaria attempted to join the gold standard in 1897, but was frustrated by a financial crisis, which caused the convertibility of banknotes to be suspended. It then promised to introduce the gold standard as part of the package agreed which introduced the financial controls in 1902, although de facto membership only came in 1906 with the successful circulation of new gold-backed banknotes (Avramov Reference Avramov2006; Dimitrova et al. Reference Dimitrova, Fantacci and Tunçer2010). Similarly, joining the gold standard was a requirement under debt restructuring in 1898 for Greece, but parity was only achieved in 1910. Serbia only joined the gold standard late, although it did enjoy success in eliminating the agio. Dimitrova et al. (2010, p. 28) argue that Serbia did not join earlier because Austria–Hungary was the main net exporting destination for Serbian products, and they enjoyed favourable terms of trade under the existing exchange rate between the Serbian silver dinar and the Austrian gold forint.
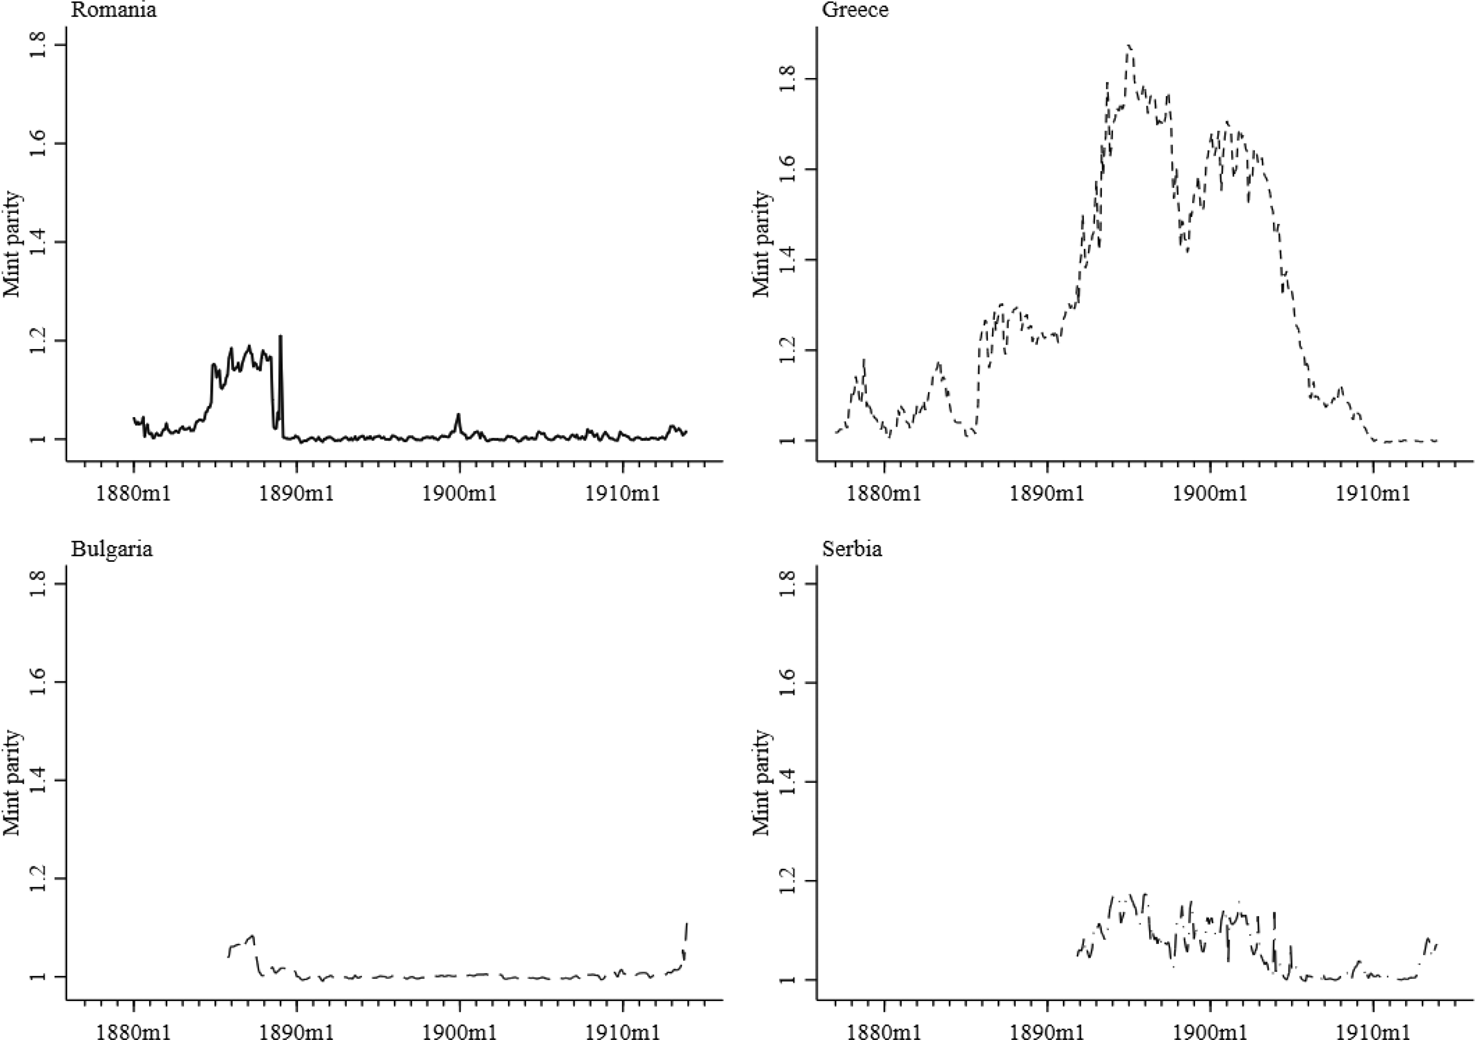
Similar to other recent work, we see little evidence for an independent impact of the gold standard on country risk. Greece was unable to maintain it for long. Romania was, and joined in 1890, but its costs of borrowing were relatively low even before this date. For Serbia and Bulgaria membership in 1909 and 1906 respectively was ultimately a demand of creditors in relation to debt restructuring, but we see no convergence of yields with Romania from this point. However, Figure 4 suggests that joining had an impact on exchange rates. The monthly deviation from mint parity of the four countries was quite stable over the entire period, except for Greece, and variations are somewhat smaller once the country joined the gold standard.
Deviations from mint parity January 1877 to December 1913 (1.00 = mint parity)
Source: Own calculations based on exchange rate data from SEEMHN 2014.
Note: Using agio for Bulgaria and Romania until 1890 and thereafter the exchange rate to pound sterling, using the exchange rate to the franc for Greece and the price of the 20 dinar gold coin for Serbia.

Turning to the central banks, the National Bank of Greece (NBG) was founded in 1841 as a commercial bank with the right to issue notes. The National Bank of Serbia (NBS) was established in 1884 and was given the exclusive privilege to issue banknotes, but they were not trusted by the population and were immediately converted into gold. The monetary system remained bimetallic until the end of World War I (Sojic and Djurdjevic Reference Sojic and Djurdjevic2006; Dimitrova et al. Reference Dimitrova, Fantacci and Tunçer2010). The Bulgarian National Bank (BNB) was established immediately upon independence in 1879, but was only granted the privilege of issuing banknotes in 1885. Also, regular attempts to privatize it were thwarted, in contrast to Serbia and Romania (Avramov Reference Avramov2006; Dimitrova et al. Reference Dimitrova, Fantacci and Tunçer2010).
The National Bank of Romania (NBR) was established in 1880 as part of a rapid and ambitious institutional modernization after independence (Constantinescu Reference Constantinescu1994, p. 168). The NBR was founded as a joint public/private venture with one-third of stock held by the state, but became entirely private in 1901 (Constantinescu Reference Constantinescu1994, p. 208). The NBR was very successful at maintaining exchange rate stability until World War I (Morys Reference Morys2017, p. 401), and this is often cited as a reason for the relative success and stability of the Romanian economy (Dimitrova et al. Reference Dimitrova, Fantacci and Tunçer2010; Stoenescu et al. Reference Stoenescu, Blejan and Costache2008, Reference Stoenescu, Blejan and Costache2011). In fact, contemporaries attributed Romania's success to the quality of its institutions, in particular the National Bank of Romania. For example, the section on Romania in the four-volume History of Banking in all the Leading Nations (Sumner et al. Reference Sumner1896) gives a great deal of credit to Romania's independent central bank, which did not purchase government debt:
Although the National Bank of Roumania is the credit establishment of a country less rich and economically advanced than other Latin nations, it is a remarkably well managed institution. Its business is conducted sensibly and sagaciously. … The Roumanian Government deserves praise for the intelligent discretion which it has practised toward the Bank. It exercises all rights of control which are the proper domain of the State wherever banks of issue are concerned; but it has exacted no loans from the Bank. Such demands would have prejudiced the run of affairs and shaken the confidence of the public in the paper circulation. The Government and the country have reaped the benefit of this wise action. Exchange has remained favorable in propitious contrast to the unfortunate conditions of exchange in Servia [Serbia] and Greece. (p. 344)
In line with the above, Morys (Reference Morys2017) suggests that the NBR managed to become independent not only formally but also according to economic criteria. According to Morys (Reference Morys2017), the four national banks differed largely in terms of structure of ownership and appointment of board members, with the NBG and NBS appearing formally more autonomous. However, a more autonomous formal structure does not necessarily imply less political influence. When applying economic criteria, one can assess the level of influence by looking at the government debt held by the central bank. In this regard both the NBG and the NBS had large shares of government debt while the BNB and NBR only held modest amounts of government debt. Indeed, even though the NBR started as a government banker it managed to free itself in 1900, thus appearing more independent than the other three banks.
IV
The above discussion is of course merely suggestive, but it reveals several channels through which Romania might stand out from the other Balkan countries. While Romania managed to borrow most without collateral, a channel through which Bulgaria, Greece and Serbia managed to increase their creditworthiness was foreign intervention. Another and more direct channel was when financial committees were given the authority to collect revenues and make the debt repayments themselves, which also improved creditworthiness.
In the literature, the importance of international financial controls on bond spreads has been analysed in different ways. One way is to conduct a break test with unknown break dates, to compare the breaks with the timing of financial controls. For example, Tunçer (Reference Tunçer2015) finds that in Serbia and Greece the timing of the imposition of international financial controls coincides with structural breaks in each country's bond spreads. Since our aim is to understand why Romania managed to borrow more cheaply than the other Balkan countries, we follow instead the methodology used by, e.g., Flandreau and Zumer (Reference Flandreau and Zumer2004), Ferguson and Schularick (Reference Ferguson and Schularick2006, Reference Ferguson and Schularick2012) and Mitchener and Weidenmier (Reference Mitchener and Weidenmier2010). They use a panel dataset containing different variables considered by the literature to have an effect on creditworthiness. Following this approach, we are able to identify multiple determinants of country spreads and, combined with the discussion from Section III, we can then suggest what made Romania different.
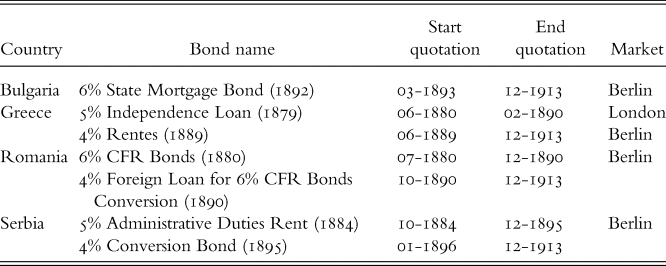
First, we construct a series of spreads for each country using the bonds listed in Table 2. The securities are chosen to be representative for their countries and as such differ from the average bonds illustrated in Figure 1. We have done so partly to make our results comparable with previous work, and because we wish to avoid changes in the spreads caused by new bonds entering the sample. Nevertheless, our results are robust to using the average bonds.Footnote 19
The bonds selected for our analysis

Source: See online Appendix A, Tables A.1–A.5.
Note: Start and end quotations are based on own calculations.
For Bulgaria the bond selected had the longest time span. For Greece we use two bonds: the 5 per cent Independence Loan (1879) starts the earliest in the sample of bonds,Footnote 20 whereas the second bond, 4 per cent Rentes (1889), is a very big loan compared to the other outstanding loans (£6,200,000). In the case of Romania, two bonds are employed as well. These securities allow us to build a long time series of spreads. The first bond converted into the second one, thus motivating our choice (6 per cent CFR Bonds (1880) and 4 per cent Foreign Loan for 6 per cent CFR Bonds Conversion (1890)). Lastly, for Serbia we chose the only available bonds that allowed us to construct such a long spread series.Footnote 21
For the panel dataset we have annual data for a number of economic variables for each country and we combine these with the yealy averages of our bond spreads. The idea is to employ different variables which were used and readily available to the investors at the time and use these to assess the financial risk as measured by the bond spreads. We follow Ferguson and Schularick (Reference Ferguson and Schularick2006) closely and employ the following economic measures: debt/revenues, budget deficit/revenues, tradebalance/exports and exports/capita. As explained in Ferguson and Schularick (Reference Ferguson and Schularick2006), trade was important in the assessment of creditworthiness firstly because a country needed to earn foreign exchange to pay its external debt and secondly because export capacity was seen as a measure of wealth. Finally, we also include a measure of the government's involvement in the state administration to account for the quality of political institutions.Footnote 22 As noted above, from the historical sources we have looked at we cannot directly observe the causal relationship between the economic variables we consider here and bond spreads. But it can certainly be argued that a well-informed investor would have been aware of these factors, and would have used them to judge creditworthiness. The empirical results presented here go some way to providing evidence for this.
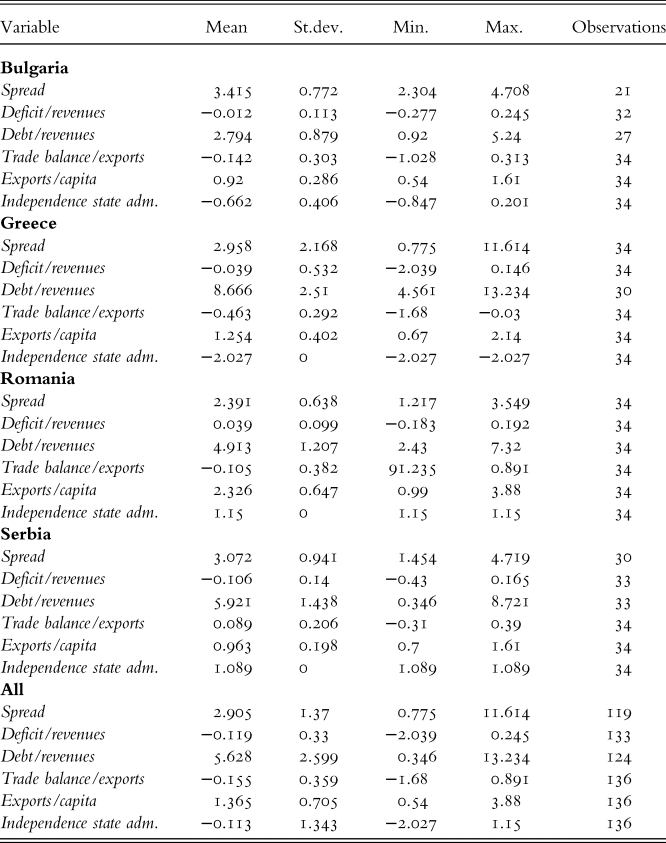
Summary statistics for the variables included together with the yearly bond spreads can be seen in Table 3. Apart from the abovementioned measures, we also include dummies for being on the gold standard, for war, for being in default and for financial controls.
Summary statistics for yearly data, 1880–1913

Sources: Own calculations based on IMM and BBZ, Accominotti et al. (Reference Accominotti, Flandreau and Rezzik2011), Banu (Reference Banu2012), Ferguson and Schularick (Reference Ferguson and Schularick2006), Gnjatovic (Reference Gnjatović2009) and Pemstein et al. (2022, V-Dem project).
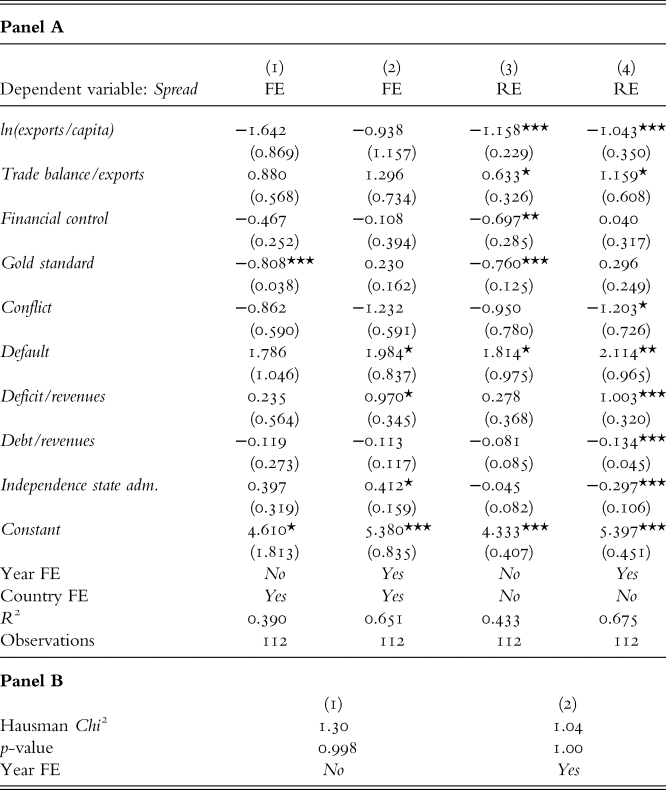
To gain insight as to the effect of our economic variables on the country spreads we employ two different panel data methods: Fixed Effects (FE) and Random Effects (RE), both estimated with robust standard errors clustered at the country level. The advantage of pooling data into a panel is that we are able to control for time fixed effects, i.e. exogenous events affecting all countries at one point in time such as international shocks to the interest rates. The FE model furthermore also controls for country fixed effects. One of the explanatory variables included is the financial controls, which in our sample, in contrast to the much larger sample used in Mitchener and Weidenmier (Reference Mitchener and Weidenmier2010), do not vary much for each country across the years. Indeed, for Serbia, financial controls were present in all years apart from one, and for Greece for more than half the period. We would therefore expect the estimate of this variable not to be significant and furthermore in part included in the fixed effects. We therefore also perform RE and using a Hausman specification test to compare the results with the FE model, we can conclude that the country-level effects are also adequately modelled in the RE model. Furthermore, the magnitudes of the estimates do not change much between the two specifications.
The estimation results can be seen in Table 4. Columns 1 and 2 present the results for the Fixed Effects model with and without time fixed effects.
Panel regression results

Note: Robust standard errors in parentheses. *p < 0.10; ** p < 0.05; *** p < 0.01.
These have mostly been included as a comparison of magnitudes since most of the estimates are not significantly different from zero. In columns 3 and 4 we present the estimates of an RE using the same variables as in Ferguson and Schularick (Reference Ferguson and Schularick2006), with column 4 being our preferred specification.Footnote 23 As expected, the estimate on the dummy indicating financial controls is not significantly different from zero, confirming our expectations about too little variation in this variable. In column 4 exports/capita is highly significant indicating that a 1 per cent increase in exports reduces the country spread by 1.043 percentage point. Column 4 also shows that trade balance, conflict, debt/revenues, deficit/revenues and default all have significant estimates all with the expected signs. Finally, we also find that better institutions, measured by the variable independence state adm., reduce the country spread significantly.
In sum, our results are in line with Flandreau and Zumer (Reference Flandreau and Zumer2004), who find that public finances were important for the borrowing costs. They also help explain why Romania was able to borrow without financial controls since the Romanian exports per capita were well above those of Bulgaria, Greece and Serbia. Furthermore, the measure of an independent state administration can also help to explain the higher creditworthiness of Romania, since, on average, this measure is higher in Romania than in the other three countries.
V
We contribute to the literature on the determinants of bond spreads with the example of Romania, which was more or less consistently able to borrow more cheaply than its Balkan neighbours before World War I. We argue that this was primarily due to investors’ recognition of its natural resources, exports and good institutions, something we provide econometric evidence for. In fact, Romania's success on the international credit markets was matched by its overall economic performance: by 1914, Romania enjoyed gross industrial output per capita well over twice that of the other Balkan states (Lampe Reference Lampe1975, p. 6), GDP per capita also in excess of its neighbours, and growth rates twice as high between 1870 and 1913, approaching levels enjoyed by the Scandinavian countries during their famously rapid catch-up (Lains Reference Lains2002).Footnote 24