Dairy proteins represent one of the most promising sources of bioactive peptides exhibiting diverse physiological functions, including antioxidant activity that may attenuate oxidative stress associated with ageing and chronic diseases (Chi et al., Reference Chi, Wang, Wang, Zhang and Deng2015; Korhonen and Pihlanto, Reference Korhonen and Pihlanto2006; Liu et al., Reference Liu, Yang, Zhao and Yang2020). These peptides remain in a latent form within the native protein sequence and are released upon enzymatic hydrolysis, microbial fermentation or gastrointestinal digestion.
Camel milk has emerged as a highly attractive functional dairy matrix owing to its distinctive biochemical composition and potential health benefits. Beyond its nutritional value, it is increasingly recognised as a sustainable, climate-resilient dairy resource in arid and semi-arid regions. Relative to bovine milk, camel milk presents a unique casein profile, lower allergenicity and enhanced thermal stability, factors that may modulate protein digestibility and the gastrointestinal bioaccessibility of derived peptides. Caseins comprise 60–80% of camel milk protein and serve as a major source of bioactive peptide precursors (Khaskheli et al., Reference Khaskheli, Arain, Chaudhry, Soomro and Qureshi2005; Roy et al., Reference Roy, Ye, Moughan and Singh2020). β-casein, the predominant fraction, is an intrinsically disordered, amphiphilic protein whose flexible, open structure markedly increases its susceptibility to proteolytic cleavage (Cheng et al., Reference Cheng, Dong, Wusigale and Liang2020; Kappeler et al., Reference Kappeler, Farah and Puhan1998). Specifically, camel β-casein is a 217-residue phosphoprotein of ∼25 kDa with an isoelectric point of approximately 5.7; its flexible conformation facilitates enzymatic hydrolysis and subsequent release of bioactive peptides (Lajnaf et al., Reference Lajnaf, Gharsallah, Attia and Ayadi2021). Although antioxidant and other bioactivities of casein-derived peptides from various milk sources are well documented (Ahmed et al., Reference Ahmed, El-bassiony, Elmalt and Ibrahim2015; Liu et al., Reference Liu, Yang, Zhao and Yang2020; Salami et al., Reference Salami, Moosavi-Movahedi, Moosavi-movahedi, Ehsani, Yousefi, Farhadi, Niasari-naslaji, Saboury, Chobert and Haertlé2011; Tonolo et al., Reference Tonolo, Moretto, Ferro, Folda, Scalcon, Sandre, Fiorese, Marin, Bindoli and Rigobello2019;), most studies have employed crude camel casein mixtures. Consequently, systematic data on the susceptibility of camel β-casein to key gastrointestinal proteases, namely pepsin, trypsin and chymotrypsin, and on the relationship between cleavage specificity, degree of hydrolysis (DH), peptide profile and resultant antioxidant activity remain scarce.
To address this gap, the present study was designed to purify β-casein from camel milk and to systematically compare its enzyme-specific hydrolysis by pepsin, trypsin and chymotrypsin tested individually under their respective optimal conditions. The hydrolysis pattern was monitored by determining the DH and by reversed-phase high-performance liquid chromatography (RP-HPLC) peptide profiling, and the antioxidant properties of the generated hydrolysates were evaluated using complementary in vitro assays. This approach enables direct correlation between protease specificity and bioactivity, providing a rational basis for the targeted release of antioxidant peptides from camel β-casein.
Materials and methods
Samples
Fresh camel milk (Camelus dromedarius) was collected in March 2022 from healthy lactating camels at a local farm in El-Oued, southern Algeria. Approximately 10 l of morning milk was obtained, transferred to sterile glass bottles, transported on ice cold and stored at 4°C until use.
Isolation of camel caseins
Whole casein was isolated from skimmed camel milk by isoelectric precipitation according to Wangoh et al. (Reference Wangoh, Farah and Puhan1998), with slight modifications. Briefly, milk was defatted by centrifugation at 3,500 × g for 20 min at 4°C to obtain skimmed milk. The fat layer was discarded. The pH of the skimmed milk was adjusted to 4.3 using 4 N HCl under gentle stirring at 20°C. The mixture was centrifuged at 3,500 × g for 30 min at 20°C to separate casein from whey proteins. The casein pellet was washed three times with distilled water, re-suspended in distilled water and neutralised to pH 7.0 with 1 M NaOH, dialysed against distilled water for 48 h at 4°C using a dialysis membrane with a molecular weight cut-off 10–14 kDa, lyophilised and stored at −20°C until further use.
Isolation of β-casein
Camel β-casein was purified by batch anion-exchange chromatography on diethylaminoethyl cellulose (DEAE-cellulose) resin. DEAE-cellulose (10 g) was pre-equilibrated in 20 mM sodium acetate buffer (pH 6.6) containing 4 M urea, 35 mM EDTA and 10 mM 2-mercaptoethanol. Briefly, lyophilised casein (2 g) was dissolved in 40 ml of the same buffer, stirred for 1 h at 4°C and centrifuged at 16,000 × g for 45 min at 4°C to remove insoluble material. The supernatant was incubated with the equilibrated DEAE-cellulose for 30 min at 20°C with gentle stirring, then transferred to a sintered glass funnel for batch elution under vacuum. Unbound proteins were removed with equilibration buffer. Bound proteins were eluted stepwise with equilibration buffer containing 0, 0.2, 1.0 and 2.0 M NaCl. The β-casein-enriched fraction was collected. Fractions were dialysed against distilled water (48 h, 4°C), lyophilised and analysed by urea–polyacrylamide gel electrophoresis (urea-PAGE) to assess β-casein purity and calculate purification yield.
Urea-PAGE
Urea-PAGE was performed according to Andrews (Reference Andrews1983). The resolving gel contained 13% acrylamide and 6 M urea in 0.375 M Tris-HCl buffer (pH 8.9), and the stacking gel contained 4% acrylamide and 6 M urea in 0.125 M Tris-HCl buffer (pH 6.8). Electrophoresis was carried out in Tris-glycine running buffer (25 mM Tris, 192 mM glycine, pH 8.4) at a constant voltage of 200 V (approximately 40 mA) for 90 min. Samples (2 mg/ml) were loaded onto the gel. After electrophoresis, gels were fixed in 12% trichloroacetic acid for 1 h, stained with 0.2% Coomassie Brilliant Blue G-250 for 3–4 h, and destained in ethanol/acetic acid/water (4:1:5) until clear bands were obtained.
SDS-PAGE
Sodium dodecyl sulphate–polyacrylamide gel electrophoresis (SDS-PAGE) was performed using a vertical mini-gel system according to Laemmli (Reference Laemmli1970). The resolving and stacking gels contained 15% and 4% acrylamide, respectively. Samples were mixed with loading buffer (0.5 M Tris-HCl, pH 6.8, containing 2% SDS, 10% glycerol, 5% 2-mercaptoethanol, 0.01% bromophenol blue), heated at 95°C for 5 min and loaded. A pre-stained molecular weight marker was used. Electrophoresis was carried out at 120 V for 90 min in Tris-glycine running buffer (25 mM Tris, 192 mM glycine, 0.1% SDS, pH 8.3). Gels were stained with 0.1% Coomassie Brilliant Blue G-250 for 1 h and destained with a solution containing 10% acetic acid, 40% ethanol and 50% water until the background became clear.
Enzymatic hydrolysis
Hydrolysis of β-casein was performed using pepsin, trypsin and chymotrypsin according to Parmar et al. (Reference Parmar, Jaiswal, Rinku, Bajai and Bimlesh2015), with slight modifications. Freeze-dried β-casein was dissolved at 1% in the appropriate buffer. Hydrolysis with pepsin (EC 3.4.23.1; porcine gastric mucosa, 3,000–4,500 U/mg) was carried out in 0.1 N HCl at pH 2.0, while hydrolysis with trypsin (EC 3.4.21.4; bovine pancreas, type I, 10,000 U/mg) and α-chymotrypsin (EC 3.4.21.1; bovine pancreas, ≥40 U/mg protein) were performed in 0.2 M Tris-HCl buffer at pH 8.0. Each enzyme was used individually under its optimal pH and temperature to ensure maximal activity and to allow unbiased comparison of enzyme specificity.
All reactions were conducted at an enzyme-to-substrate ratio of 1:100 at 37°C for 4 h with continuous stirring. Aliquots were withdrawn at 5, 15, 30 min and at 4 h. Reactions were terminated by heating at 95°C for 15 min followed by rapid cooling on ice to ensure irreversible inactivation of the enzymes. Under these conditions (highly purified protein without reducing sugars, 96°C, 15 min), non-enzymatic peptide bond cleavage and Maillard reactions are negligible, as chemical hydrolysis of peptide bonds requires much harsher conditions (e.g., 6 HCl, 110°C, 24 h). Hydrolysates were cooled, centrifuged at 10,000 × g for 10 min at 4°C, and the supernatants were stored at −20°C until analysis. A non-hydrolysed β-casein control incubated under identical conditions without enzyme was included.
The kinetics of hydrolysis were followed by SDS-PAGE and by the evolution of antioxidant activities 2,2-diphenyl-1-picrylhydrazyl (DPPH), 2,2-azino-bis-3-ethylbenzothiazoline-6-sulphonic acid (ABTS) and ferric reducing antioxidant power (FRAP) measured at 5, 16, 30 min and 4 h. the DH and RP-HPLC profiles were determined only a the final hydrolysis time 4 h as final quality control parameters to compare the hydrolysis extent and peptide diversity between proteases.
Determination of degree of hydrolysis
The DH was determined by the trinitrobenzenesulphonic acid (TNBS) method of Adler-nissen (Reference Adler-nissen1979) with slight modifications. Hydrolysates and l-leucine standards (0–2 mM) were prepared in 0.1 M sodium bicarbonate buffer (pH 8.5). Aliquots (125 µl) were mixed with 1 ml of 0.1% TNBS freshly prepared in the same buffer and incubated at 37°C for 2 h in the dark. The reaction was stopped by adding 1 ml of 1 N HCl. SDS (2 ml, 1%) was added to prevent precipitation and to stabilise the chromophore. Absorbance was measured at 420 nm against a reagent blank. All measurements were performed in triplicate. DH (%) was calculated as
 \begin{equation*}{\text{DH (% ) = [100 }} \times \left( {{\text{A}}{{\text{N}}_2} - {\text{A}}{{\text{N}}_1}} \right)/\;{\text{Npb}}\end{equation*}
where AN₁ and AN₂ are the amino nitrogen content before and after hydrolysis (mg/g), respectively, and Npb is the nitrogen content of the peptide bonds in the substrate (mg/g). AN was determined from the l-leucine standard curve, and Npb was calculated.
RP-HPLC analysis of β-casein hydrolysates
Peptide profiles of β-casein hydrolysates were analysed by RP-HPLC using a HPLC system equipped with a Lichrosorb C8 column (125 × 4.1 mm, 5 µm, 300 A). Separation was achieved with a linear gradient of 0–50% solvent B (0.1% trifluoroacetic acid, TFA, in ultrapure water) in solvent A (0.1% TFA in ultrapure water) over 50 min at a flow rate of 0.2 ml/min and a column temperature of 38°C. The injection volume was 20 µl, and samples were filtered through a 0.22 µm membrane prior to analysis. Eluting peptides were monitored by UV detection at 214 nm.
Antioxidant activity
DPPH radical scavenging activity
The antioxidant activity of β-casein hydrolysates was determined using the DPPH radical scavenging assay, based on the method of Brand-williams et al. (Reference Brand-williams, Cuvelier and Berset1995), with slight modifications. Briefly, 100 µl of sample at varying concentrations (0–1 mg/ml) was mixed with 2 ml of 0.1 mM DPPH in ethanolic solution. After vortexing, the reaction mixtures were incubated in the dark for 60 min at room temperature. Absorbance was measured at 517 nm against a solvent blank. Ascorbic acid was used as the positive control at the same concentrations. All assays were performed in triplicate. Radical scavenging activity was calculated using the following equation:
 \begin{equation*}{\text{Scavenging activity (% ) = [(}}{{\text{A}}_{\text{o}}} - {\text{ }}{{\text{A}}_1}{\text{) / }}{{\text{A}}_{\text{o}}}{\text{]}} \times \;{\text{100 }}\end{equation*}
where A₀ is the absorbance of the control (DPPH solution without sample), and A₁ is the absorbance of the sample.
ABTS radical scavenging activity
ABTS radical scavenging activity was determined according to Re et al. (Reference Re, Pellegrini, Proteggente, Pannala, Yang and Rice-evans1999), with slight modifications. The ABTS radical cation (ABTS•⁺) was generated by mixing a 7 mM ABTS solution with 2.45 mM potassium persulfate, followed by incubation in the dark at room temperature for 12–16 h. The resulting solution was diluted with phosphate-buffered saline (5 mM, pH 7.4) to obtain an absorbance of 0.70 ± 0.02 at 734 nm. Aliquots of 3 ml of diluted ABTS•⁺ solution were mixed with 100 µl of hydrolysate at varying concentrations (0–1 mg/ml). After incubation at room temperature for 6–10 min in the dark, absorbance was measured at 734 nm. Distilled water was used as the negative control, and ascorbic acid as the positive control at the same concentrations. All assays were performed in triplicate. ABTS radical scavenging activity was calculated as
 \begin{equation*}{\text{Scavenging activity (% ) = [(}}{{\text{A}}_{\text{o}}} - {\text{ }}{{\text{A}}_1}{\text{) / }}{{\text{A}}_{\text{o}}}{\text{]}} \times \;{\text{100 }}\end{equation*}
where A 0 is the absorbance of the ABTS•⁺ control, and A 1 is the absorbance of the sample.
Reducing power assay
The reducing power of camel β-casein hydrolysates was determined according to Oyaizu (Reference Oyaizu1986) with slight modifications. Sample solutions (0–1 mg/ml) were prepared in distilled water. An aliquot of each sample (1 ml) was mixed with 2.5 ml of phosphate buffer (0.2 M, pH 6.6) and 2.5 ml of 1% potassium ferricyanide solution. The mixture was incubated at 50°C for 20 min. After incubation, 2.5 ml of 10% trichloroacetic acid was added, and the mixture was centrifuged at 3,000 × g for 10 min. Then, 2.5 ml of supernatant was mixed with 2.5 ml of distilled water and 0.5 ml of 0.1% ferric chloride solution. Absorbance was measured at 700 nm against a reagent blank. All measurements were performed in triplicate. Higher absorbance values indicated stronger reducing power, reflecting the electron-donating capacity of the peptides.
Statistical analysis
All experiments were performed as three independent biological replicates (three separate hydrolysis reactions), and results are expressed as mean ± standard deviation (SD) (n = 3). Statistical significance was assessed using one-way analysis of variance followed by Tukey’s post hoc test for multiple comparisons, or Student’s t-test where appropriate. Differences were considered statistically significant at P < 0.05. Analyses were performed using GraphPad Prism 8.0 software (GraphPad Software, San Diego, CA, USA).
Results
Isolation and characterisation of β-casein
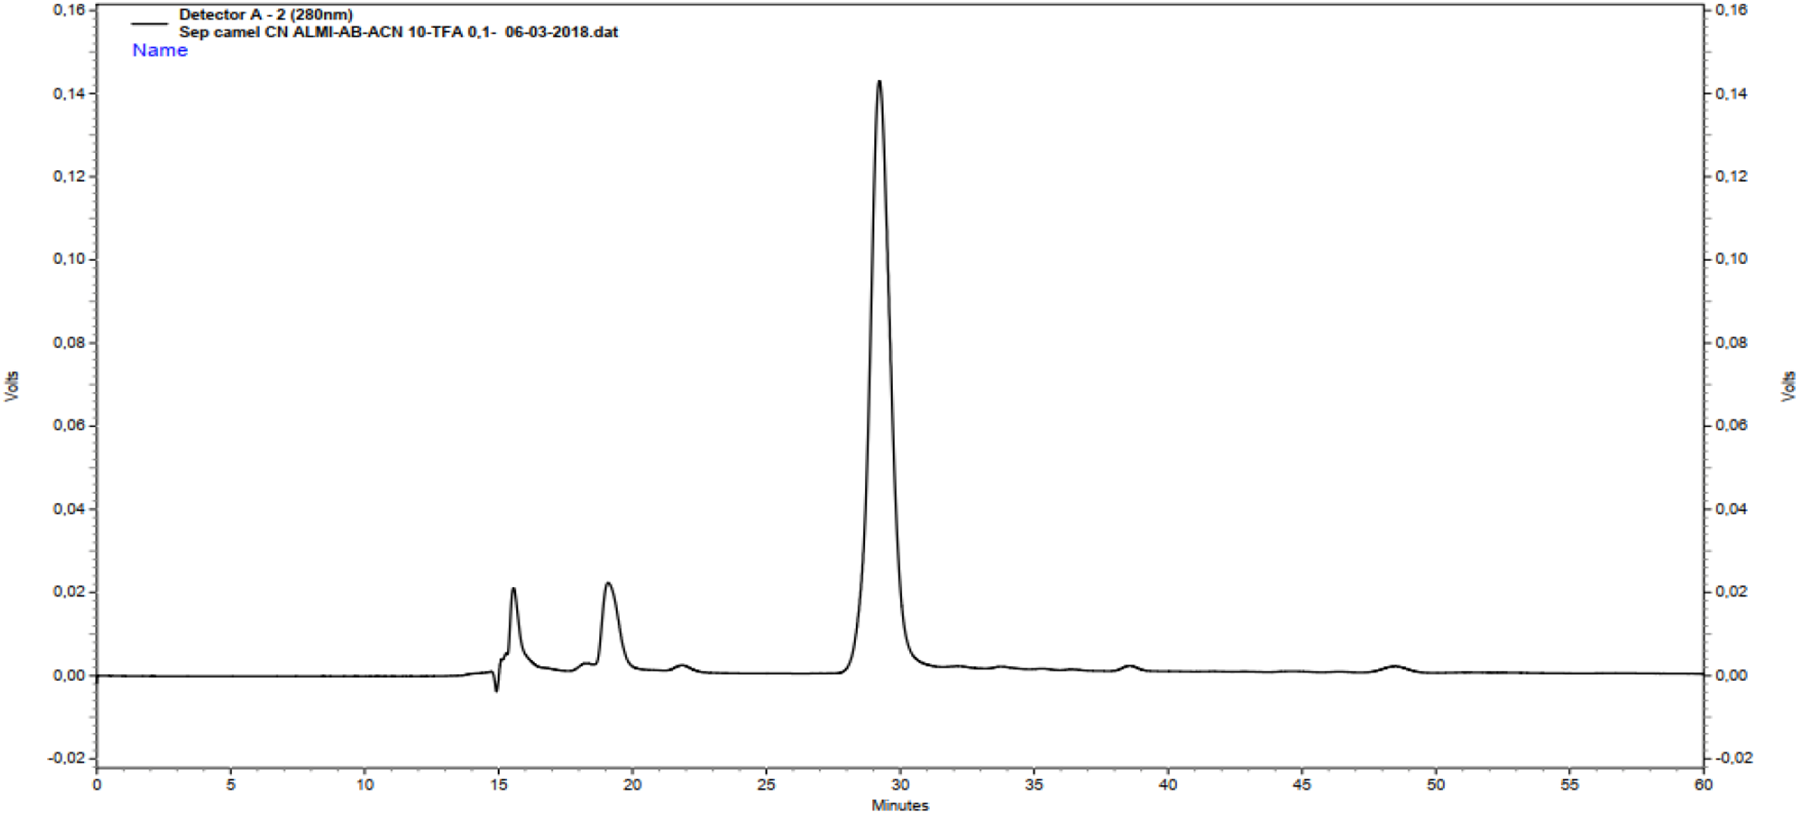
Camel β-casein was isolated from whole casein by acid precipitation followed by DEAE-cellulose anion-exchange chromatography, yielding 0.5 g of pure protein from 2.0 g of total casein (25 %). Urea-PAGE analysis of the chromatographic fractions (Figure 1A) demonstrated effective resolution of the major caseins into two fractions: β-casein eluted at 0.18 M NaCl, whereas αs-caseins were recovered at 1.0 M NaCl. The purity of the β-casein fraction was verified by SDS-PAGE (Figure 1B), which showed a single band with an apparent molecular mass of 31.04 kDa and no visible contaminants. Reversed-phase HPLC (RP-HPLC) further confirmed homogeneity, exhibiting a single major peak at 29.5 min (Figure 2).
Electrophoretic analysis of camel casein fractions. (A) Urea-PAGE of fractions obtained after DEAE-cellulose chromatography: CN, whole camel casein; F1, purified β-casein; F2, purified αs-casein. (B) SDS-PAGE: M, molecular weight markers (14, 18, 45, 67 kDa); β-CN, purified camel β-casein. The apparent molecular weight was estimated from a calibration curve of log10 (MW) vs. relative mobility (Rf) (R 2 = 0.98), yielding 31.04 kDa.

RP-HPLC profile of purified camel β-casein.

Enzymatic susceptibility of camel β-casein
The different pH conditions (pH 2.0 vs. 8.0) may affect β-casein conformation independently of enzyme specificity. However, camel β-casein belongs to the family of intrinsically disordered proteins, characterised by an open structure, highly flexible conformation with no compact tertiary structure. This structural feature makes it highly accessible to proteases and largely insensitive to pH-induced denaturation between pH 2.0 and 8.0.
After 4 h of hydrolysis, the DH differed significantly among proteases (P < 0.05). Pepsin showed the highest hydrolytic efficiency, with a DH of 39.0 ± 0.1%, followed by chymotrypsin (28.0 ± 0.3%) and trypsin (11.0 ± 0.5%). SDS-PAGE (Figure 3) revealed progressive degradation of native β-casein for all proteases, with complete loss of the intact band within 15 min for pepsin, whereas residual protein remained detectable after extended incubation with chymotrypsin and trypsin. RP-HPLC profiles (Figure 4) indicated that pepsin hydrolysates contained a greater number of chromatographic peaks than those obtained with chymotrypsin and trypsin, consistent with more extensive fragmentation and higher peptide diversity.
SDS-PAGE profiles of camel β-casein hydrolysed by gastrointestinal proteases. (A) pepsin, (B) chymotrypsin and (C) trypsin. Lane 1: intact β-casein; Lane 2: 5 min hydrolysate; Lane 3: 15 min hydrolysate; Lane 4: 30 min hydrolysate; and Lane 5: 4 h hydrolysate.

RP-HPLC profiles of camel β-casein hydrolysates produced by pepsin (P), chymotrypsin (C) and trypsin (T) after 4 h of digestion.

Figure 4 Long description
Three separate line graphs labeled C, P and T, each showing a chromatogram trace. Graph C. Text: Detector A, 1 214 nanometer. Hydrolysate C1 from chymotripsine Amino 47 05 18 dot dat. Relation Time. Name. Horizontal axis label: Minutes. Range: 0 to 50. Vertical axis label: Milli absorbance unit. Range: 0 to 3. Plotted line coordinate pairs: (10, 0.5), (11, 1.0), (12, 0.8), (13, 2.0), (14, 2.2), (15, 0.4), (20, 3.0), (25, 0.2), (27, 1.2), (30, 0.2), (50, 0.0). Major peaks and low points using the listed coordinates: peak at (20, 3.0); other higher points at (14, 2.2) and (13, 2.0); lower values at (25, 0.2), (30, 0.2) and (50, 0.0). Graph P. Text: Detector A, 1 214 nanometer. Hydrolysate P1 from pepsine Amino 47 61 18 dot dat. Relation Time. Name. Horizontal axis label: Minutes. Range: 0 to 50. Vertical axis label: Milli absorbance unit. Range: 0 to 3. Plotted line coordinate pairs: (10, 0.6), (11, 1.2), (12, 0.7), (13, 2.2), (14, 2.4), (15, 0.5), (20, 3.0), (25, 0.3), (27, 1.3), (30, 0.4), (35, 0.2), (50, 0.0). Major peaks and low points using the listed coordinates: peak at (20, 3.0); other higher points at (14, 2.4) and (13, 2.2); lower values at (35, 0.2) and (50, 0.0). Graph T. Text: Detector A, 1 214 nanometer. Hydrolysate T1 from trypsine Amino 47 05 18 dot dat. Relation Time. Name. Horizontal axis label: Minutes. Range: 0 to 50. Vertical axis label: Milli absorbance unit. Range: 0 to 3. Plotted line coordinate pairs: (9, 2.0), (10, 0.8), (11, 2.5), (12, 2.7), (13, 1.0), (15, 0.2), (20, 0.1), (50, 0.2). Major peaks and low points using the listed coordinates: peak at (12, 2.7); other higher points at (11, 2.5) and (9, 2.0); lower values at (20, 0.1) and (15, 0.2). Comparison across C, P and T using the listed coordinates: C and P share a highest listed peak at 20 minutes with 3.0 milli absorbance unit, while T has its highest listed peak earlier at 12 minutes with 2.7 milli absorbance unit and remains near 0.1 to 0.2 milli absorbance unit at 20 to 50 minutes. All three traces are drawn as single continuous lines.
In vitro antioxidant activity of β-casein hydrolysates
All hydrolysates displayed dose-dependent DPPH radical-scavenging activity (Figure 5). After 4 h of hydrolysis, pepsin-derived hydrolysates exhibited significantly higher activity (P < 0.05) than trypsin and chymotrypsin hydrolysates. Native β-casein exhibited relatively weak DPPH-scavenging activity, with a half-maximal inhibitory concentration (IC50) of approximately 4.0 mg/ml.
DPPH radical scavenging activity of camel β-casein hydrolysates. (A) Dose-response (0–1 mg/ml). (B) Activity at 0.5 mg/ml. Vitamin C was used as a positive control. Values are mean ± SD (n = 3). Error bars smaller than symbols were not visible. ***P < 0.001 vs. intact β-casein. Different letters (a–d) indicate significant differences among hydrolysates (Tukey’s test, P < 0.001).

Figure 5 Long description
A line graph with the vertical axis label, DPPH scavenging activity percent, ranging from 0 to 100 and the horizontal axis label, Concentration milligram per milliliter, ranging from 0.0 to 1.0. A legend lists Vitamin C positive control, Pepsin hydrolysate, Trypsin hydrolysate, Chymotrypsin hydrolysate and Intact beta casein. Five lines rise from near 0 at concentration 0.0. At concentration 0.2, the plotted points are approximately 45 for Vitamin C positive control, 25 for Pepsin hydrolysate, 20 for Trypsin hydrolysate, 15 for Chymotrypsin hydrolysate and 10 for Intact beta casein. At concentration 0.4, the plotted points are approximately 75 for Vitamin C positive control, 40 for Pepsin hydrolysate, 30 for Trypsin hydrolysate, 25 for Chymotrypsin hydrolysate and 20 for Intact beta casein. At concentration 0.6, the plotted points are approximately 85 for Vitamin C positive control, 60 for Pepsin hydrolysate, 50 for Trypsin hydrolysate, 40 for Chymotrypsin hydrolysate and 30 for Intact beta casein. At concentration 0.8, the plotted points are approximately 86 for Vitamin C positive control, 70 for Pepsin hydrolysate, 60 for Trypsin hydrolysate, 55 for Chymotrypsin hydrolysate and 40 for Intact beta casein. At concentration 1.0, the plotted points are approximately 88 for Vitamin C positive control, 75 for Pepsin hydrolysate, 65 for Trypsin hydrolysate, 60 for Chymotrypsin hydrolysate and 45 for Intact beta casein. The image B showing a bar graph with the vertical axis label, DPPH scavenging activity percent, ranging from 0 to 80. The horizontal axis lists Intact beta casein, Pepsin hydrolysate, Chymotrypsin hydrolysate and Trypsin hydrolysate. Bars are shown with small error bars. The bar heights are approximately 8 for Intact beta casein, 70 for Pepsin hydrolysate, 60 for Chymotrypsin hydrolysate and 50 for Trypsin hydrolysate. Letters above bars read d above Intact beta casein, a above Pepsin hydrolysate, b above Chymotrypsin hydrolysate and c above Trypsin hydrolysate. Three asterisks appear above the bars for Pepsin hydrolysate, Chymotrypsin hydrolysate and Trypsin hydrolysate.
Enzymatic hydrolysis significantly enhanced DPPH-scavenging capacity, reducing IC50 values to 0.51, 0.60 and 0.98 mg/ml for pepsin-, chymotrypsin- and trypsin-derived hydrolysates, respectively (P < 0.05). None of the hydrolysates were as potent as ascorbic acid (IC50 < 0.12 mg/ml). ABTS•+ scavenging activity followed the same rank order, pepsin > chymotrypsin > trypsin, with IC50 values of 0.64, 0.75 and 0.91 mg/ml compared with 1.49 mg/ml for unhydrolysed β-casein (Figure 6; P < 0.05). The ferric reducing power assay showed a concentration-dependent increase in reducing power for all samples (Figure 7). All hydrolysates exhibited greater ferric reducing capacity than native β-casein (P < 0.05), with pepsin hydrolysates displaying the highest activity.
ABTS radical scavenging activity of camel β-casein hydrolysates. (A) Dose-response (0–1 mg/ml). (B) Activity at 0.5 mg/ml. Vitamin C was used as a positive control. Values are mean ± SD (n = 3). Error bars smaller than symbols were not visible. ***P < 0.001 vs. intact β-casein. Different letters (a–d) indicate significant differences among hydrolysates (Tukey’s test, P < 0.001).

Figure 6 Long description
Line graph with the y axis labeled, ABTS scavenging activity percent, ranging from 0 to 100 and the x axis labeled, Concentration left parenthesis milligram slash milliliter right parenthesis, ranging from 0.0 to 1.0. A legend lists, Vitamin C positive control, Pepsin hydrolysate, Chymotrypsin hydrolysate, Trypsin hydrolysate and Intact beta casein. Five lines rise from near 0 at concentration 0.0. Vitamin C positive control increases to about 60 at 0.2, about 85 at 0.4, about 92 at 0.6, about 96 at 0.8 and about 98 at 1.0. Pepsin hydrolysate increases to about 55 at 0.2, about 75 at 0.4, about 76 at 0.6, about 78 at 0.8 and about 80 at 1.0. Chymotrypsin hydrolysate increases to about 35 at 0.2, about 50 at 0.4, about 58 at 0.6, about 65 at 0.8 and about 70 at 1.0. Trypsin hydrolysate increases to about 28 at 0.2, about 40 at 0.4, about 48 at 0.6, about 52 at 0.8 and about 55 at 1.0. Intact beta casein increases to about 18 at 0.2, about 25 at 0.4, about 28 at 0.6, about 30 at 0.8 and about 32 at 1.0. Bar graph with the y axis labeled, ABTS scavenging activity percent, ranging from 0 to 100. The x axis has four categories labeled, Intact beta casein, Trypsin hydrolysate, Pepsin hydrolysate and Chymotrypsin hydrolysate. Bar heights are approximately 35 for Intact beta casein, approximately 60 for Trypsin hydrolysate, approximately 80 for Pepsin hydrolysate and approximately 70 for Chymotrypsin hydrolysate. Letters above the bars read, d above Intact beta casein, c above Trypsin hydrolysate, a above Pepsin hydrolysate and b above Chymotrypsin hydrolysate. Error bars are shown above each bar.
Reducing power of camel β-casein hydrolysates. (A) Dose-response (0–1 mg/ml). (B) Activity at 0.5 mg/ml. Vitamin C was used as a positive control. Values are mean ± SD (n = 3). Error bars smaller than symbols were not visible. ***P < 0.001 vs. intact β-casein. Different letters indicate significant differences (P < 0.001).

Figure 7 Long description
Line graph A with the horizontal axis labeled, Concentration in milligram per milliliter, ranging from 0.0 to 1.0, with tick labels at 0.0, 0.2, 0.4, 0.6, 0.8 and 1.0. The vertical axis is labeled, Reducing power at 700 nanometer, ranging from 0.0 to 0.8, with tick labels at 0.0, 0.1, 0.2, 0.3, 0.4, 0.5, 0.6, 0.7 and 0.8. Five plotted lines with point markers are shown, with a legend listing, Intact beta casein, Pepsin hydrolysate, Chymotrypsin hydrolysate, Trypsin hydrolysate and Vitamin C. The plotted values are not numerically labeled at the markers. Bar chart B with the horizontal axis labeled, Samples, with four categories: Intact beta casein, Trypsin hydrolysate, Pepsin hydrolysate and Chymotrypsin hydrolysate. The vertical axis is labeled, Reducing power at 700 nanometer, ranging from 0 to 70, with tick labels at 0, 10, 20, 30, 40, 50, 60 and 70. The bar heights align approximately with 20 for Intact beta casein, 40 for Trypsin hydrolysate, 60 for Pepsin hydrolysate and 55 for Chymotrypsin hydrolysate. Each bar has an error bar. Letters above the bars read d above Intact beta casein, c above Trypsin hydrolysate, a above Pepsin hydrolysate and b above Chymotrypsin hydrolysate. Three asterisks appear above the bars for Trypsin hydrolysate, Pepsin hydrolysate and Chymotrypsin hydrolysate.
Discussion
The electrophoretic and chromatographic data confirm that the purification strategy yielded homogeneous camel β-casein with high purity. RP-HPLC revealed a single major peak with a retention time of 29.5 min, indicating a purity >95%, consistent with the profile reported by Lajnaf et al. (Reference Lajnaf, Gharsallah, Attia and Ayadi2021) for camel β-casein using a C18 Zorbax Eclipse Plus column (detection at 220 nm). Similarly, urea-PAGE and SDS-PAGE each showed a single band with an apparent molecular mass of ∼31.04 kDa. This apparent mass exceeds the theoretical mass of 24.65 kDa (217 residues, pI 5.7), a well-documented anomaly attributed to the highly hydrophobic nature and phosphorylation heterogeneity (4P/5P isoforms) of camel β-casein, which alters SDS binding and electrophoretic migration. Comparative values have been reported for Algerian dromedary isolates (Alim et al., Reference Alim, Fondrini, Bonizzi, Feligini and Enne2005; Lajnaf et al., Reference Lajnaf, Attia and Ayadi2024; Si Ahmed et al., Reference Si Ahmed, Almi, Senoussi, Boudjenah and Mati2013; Shuiep et al., Reference Shuiep, Jäger, Yousif and Erhardt2015). The pronounced hydrophobicity and intrinsically disordered conformation of camel β-casein not only facilitate its selective purification by cold extraction but also enhance protease accessibility (Chang et al., Reference Chang, Seol, Jeong, Oh, Park, Perrin and Ham2013; Giménez et al., Reference Giménez, Alemán, Montero and Gómez-guillén2009; Suetsuna, Reference Suetsuna2000), thereby explaining the high DH observed, particularly with pepsin.
The differential hydrolysis kinetics observed among proteases reflect the combined influence of enzyme specificity and substrate topology. Pepsin exhibited the highest DH and the most rapid degradation of native β-casein, consistent with its preference for cleaving peptide bonds adjacent to hydrophobic and aromatic residues that are abundant in camel β-casein and more exposed under acidic conditions. Based on in silico analysis using ExPASy PeptideCutter, the number of predicted cleavage sites in the β-casein sequence was approximately 45 for pepsin, 33 for chymotrypsin and 13 for trypsin, which further explains the greater diversity and extensive fragmentation obtained with pepsin.
Enzymatic hydrolysis markedly enhanced antioxidant activity relative to intact β-casein. The superior performance of pepsin hydrolysates in DPPH, ABTS and ferric reducing power assays correlates with the higher DH and the generation of low-molecular-weight peptides. This relationship indicates selective liberation of bioactive sequences rather than random fragmentation and supports the principle that the bioactivity of protein hydrolysates is governed by protein source, protease specificity and DH (Corrochano et al., Reference Corrochano, Sariçay, Arranz, Kelly, Buckin and Giblin2019; Zhang et al., Reference Zhang, Ma, Cao, Xiang, Hu, Zhu, Agyei, Wang and Shi2025). Mechanistically, proteolysis increases the exposure of hydrophobic residues such as alanine, valine, isoleucine and methionine, which improves interfacial reactivity towards hydrophobic radicals including DPPH (Ballatore et al., Reference Ballatore, Marina, Noelia, Carla, Yanina, Gabriela, Rosa, Lilia and Mariana2020). In parallel, the release of aromatic residues tyrosine, phenylalanine and tryptophan provides phenolic and indolic side chains that donate protons and electrons to stabilise electron-deficient radicals and terminate oxidative chain reactions (Nwachukwu and Aluko, Reference Nwachukwu and Aluko2019; Udenigwe and Aluko, Reference Udenigwe and Aluko2012). The contribution of aromatic residues, sulphur-containing amino acids (methionine and cysteine), histidine, and proline-rich and hydrophobic motifs to radical stabilisation is well documented (Chen et al., Reference Chen, Chi and Xu2012; Ahmed et al., Reference Ahmed, El-bassiony, Elmalt and Ibrahim2015; Ghribi et al., Reference Ghribi, Maklouf, Blecker, Danthine, Attia and Besbes2015; Liu et al., Reference Liu, Yang, Zhao and Yang2020; Zhang et al., Reference Zhang, Ma, Cao, Xiang, Hu, Zhu, Agyei, Wang and Shi2025). Pepsin appears to generate a higher proportion of peptides bearing these structural features, which accounts for the greater electron-donating capacity and radical-scavenging properties of its hydrolysates.
The present results agree with earlier studies reporting that camel β-casein possesses higher intrinsic antioxidant potential than bovine β-casein and that enzymatic hydrolysis further amplifies this activity through the release of bioactive peptides (Lajnaf et al., Reference Lajnaf, Gharsallah, Attia and Ayadi2021). Similar increases in ABTS•+ and DPPH radical-scavenging activity and in metal-chelating capacity after hydrolysis of camel caseins have been attributed to protein breakdown and exposure of hydrophobic and carboxyl-containing residues (Al-shamsi et al., Reference Al-shamsi, Mudgil, Hassan and Maqsood2018; Kumar et al., Reference Kumar, Chatli, Singh, Mehta and Kumar2016; Lajnaf et al., Reference Lajnaf, Gharsallah, Attia and Ayadi2021; Petrat-melin et al., Reference Petrat-melin, Andersen, Rasmussen, Poulsen, Larsen and Young2015; Salami et al., Reference Salami, Moosavi-Movahedi, Moosavi-movahedi, Ehsani, Yousefi, Farhadi, Niasari-naslaji, Saboury, Chobert and Haertlé2011).
The higher reducing activity observed for smaller peptides can be explained by increased charge density, higher charge-to-mass ratio and more exposed electron-rich side-chains that facilitate electron transfer to ferric ions. Milk protein hydrolysates are generally recognised as safe, and casein-derived peptides have a long history of consumption without reported adverse effects, supporting their potential as functional food ingredients for the management of oxidative stress.
This study should be regarded as a mechanistic screening tool to compare enzyme-specific release of antioxidant peptides from Algerian camel β-casein, rather than a direct proxy for human digestion. While individual hydrolysis under optimal pH provides an unbiased comparison of protease specificity, it does not fully recapitulate the sequential pH shifts and enzyme interactions of the gastrointestinal tract. Therefore, extrapolation to in vivo bioavailability requires validation using sequential digestion models such as the INFOGEST protocol.
Collectively, the data demonstrate that peptic hydrolysis of camel β-casein efficiently releases bioactive peptides whose antioxidant activity is mechanistically linked to increased exposure of hydrophobic and aromatic residues. These findings corroborate earlier work on milk protein hydrolysates (Khantaphant et al., Reference Khantaphant, Benjakul and Kishimura2011; Kumar et al., Reference Kumar, Chatli, Singh, Mehta and Kumar2016; Petrat-melin et al., Reference Petrat-melin, Andersen, Rasmussen, Poulsen, Larsen and Young2015) and underscore the potential of Algerian camel β-casein hydrolysates as natural antioxidant ingredients for functional food systems aimed at mitigating oxidative stress and extending shelf-life.
Conclusion
Camel β-casein constitutes a promising substrate for controlled enzymatic hydrolysis, yielding peptide fractions with substantial antioxidant potential. Among the enzymes evaluated, pepsin exhibited the greatest proteolytic efficiency, generating hydrolysates with superior DPPH• and ABTS•⁺ radical-scavenging activities, alongside enhanced ferric reducing power. The observed antioxidant capacity was strongly correlated with both the DH and the resultant peptide profile, underscoring the critical influence of enzyme specificity on bioactivity through the selective liberation of functional sequences. Nevertheless, further studies involving peptide identification by LC-MS/MS and in vivo validation are required to confirm the structure-activity relationships and bioavailability of these antioxidant peptides. Collectively, these findings position camel β-casein hydrolysates as viable natural sources of antioxidant peptides for incorporation into functional food and nutraceutical formulations.
Acknowledgements
The authors extend their gratitude to the General Directorate for Scientific Research and Technological Development, as well as the Ministry of Higher Education and Scientific Research, Algeria.
Author contributions
Dalila Almi: Conceptualization, Methodology, Writing - original draft. Hillal Sebbane, Lamia Bouadjela, Saliha Si Ahmed, Chahra Senoussi: Investigation, Data curation. Karim Houali: Supervision, Validation, Writing - review & editing.
Declaration of interest
The authors declare that they have no conflict of interest.
Ethics and approvals
This study did not require ethical approval.
Funding statement
This work was supported by the General Directorate for Scientific Research and Technological Development (DGRSDT) and the Ministry of Higher Education and Scientific Research, Algeria.