INTRODUCTION
Helminth infection typically involves non-linear systems that link, human populations intermediate hosts and multiple environmental factors contributing to efficient transmission in endemic areas. For policymakers, capturing the dynamics of this process has proven challenging in terms of developing predictive models that have quantitative accuracy. A traditional mathematical approach to modelling macro-parasite systems (Macdonald, Reference Macdonald1965) exploits a mean worm burden (MWB) formulation for human hosts and a suitable infection prevalence estimate for intermediate invertebrate hosts. However, worm distributions among host populations often exhibit an overdispersed pattern. In the standard modelling approach, overdispersion is either ignored or oversimplified using ad hoc assumptions about its distribution (e.g., the negative binomial distribution). Furthermore, the pattern of infectious burden is assumed to remain static (unchanged) over time. This approach cannot explain overdispersion or justify its ‘stationarity’, and thus leaves many uncertainties about its application to observed epidemiological data from the field and its predictions about the impact of control programmes.
We propose a new approach to modelling schistosomiasis transmission (or any vector-borne macroparasite), based on a Stratified-Worm-Burden (SWB) system as an alternative to the classical MWB approach. Several papers have studied such or similar systems for macro-parasites in the past (Pugliese, Reference Pugliese2000; Feng et al. Reference Feng, Curtis and Minchella2001; Rosa and Pugliese, Reference Rosa and Pugliese2002), but most of this work aimed at deriving reduced (MWB-type) equations, or their extended versions that couple MWB to higher moments (variance and/or aggregation) of SWB distribution. Among several examples are papers on (i) regulation and stability of host–parasite populations (Anderson and May, Reference Anderson and May1978a, Reference Anderson and Mayb); (ii) aggregation for single parasite species and multi-strain competition, coexistence, invasion (Dobson and Roberts, Reference Dobson and Roberts1994; Pugliese, Reference Pugliese2000; Rosa and Pugliese, Reference Rosa and Pugliese2002) and (iii) parasite strain diversity and evolution of drug resistance (Feng et al. Reference Feng, Curtis and Minchella2001).
In contrast, for the present study, we developed and implemented an extended SWB approach to model, as necessary, the complexity of schistosomiasis transmission for structured host populations in a geographically distributed environment with varying water contact patterns. We take advantage of the extended model systems to consider age-structured communities made of children and adult groups having suitable rates of birth, mortality, and ageing.
Our approach extends the standard Macdonald-type MWB and other prevalence-based models (e.g., Riley et al. Reference Riley, Carabin, Belisle, Joseph, Tallo, Balolong, Willingham, Fernandez, Gonzales, Olveda and Mcgarvey2008). We gain several advantages by combining both infection intensity and prevalence in the model. Primarily, we can naturally account for overdispersed worm burden in host populations (even for homogeneous behavioural risk subgroups) without ad hoc assumptions on distribution patterns commonly used in MWB-type approach such as the negative binomial (Anderson and May, Reference Anderson and May1991; Alexander et al. Reference Alexander, Moyeed and Stander2000). Inclusion of additional features reflecting the distribution of human infection (the prevalence of infected/non-infected, or lightly infected/heavily infected, and mean egg counts (as a measure of infection intensity)), proves particularly helpful for comparison of model outputs with the observed field data for calibration/validation purposes. In using the model, these variables can be derived from data or entered as dynamic variables. In addition, our model accommodates host demographics, so that one can study the effect of multiple factors (both stationary and variable) on transmission and long-term outcomes of infection. These changing variables can include population changes, environmental/behavioural modifications, snail variability, and intermittent control interventions.
Some earlier works (Chan et al. Reference Chan, Guyatt, Bundy and Medley1996; Medley and Bundy, Reference Medley and Bundy1996; Chan and Bundy, Reference Chan and Bundy1997) used age-structured MWB to assess infection-associated morbidity and the effects of drug treatment for idealized host populations. The MWB approach, however, severely limited our ability to project outcomes for promising control interventions that target both age and geographical risk factors together (see e.g., Gurarie and King, Reference Gurarie and King2005, Reference Gurarie and King2008; Gurarie and Seto, Reference Gurarie and Seto2009). The new SWB approach opens new possibilities for modelling the outcomes of control programmes that focus interventions by targeting high burden strata by age or location.
MATERIALS AND METHODS
We start with an outline of general SWB-scheme, its implications for burden/prevalence distribution, and the analysis of endemic equilibria. Then we proceed to develop a model calibration scheme that exploits typical demographical and epidemiological infection data to estimate the baseline human-to-snail and snail-to-human transmission rates. These models are built upon each other, starting with a model describing a single homogeneous population, adding an age-structured (adult–child) population, and finally a geographically distributed (human–snail) transmission environment.
Our choice of calibration scheme is partly motivated by the available data from the Msambweni region of eastern Kenya, which were collected in several multi-year studies (Sturrock et al. Reference Sturrock, Kinyanjui, Thiongo, Tosha, Ouma, King, Koech, Siongok and Mahmoud1990; Muchiri et al. Reference Muchiri, Ouma and King1996; Hamburger et al. Reference Hamburger, Hoffman, Kariuki, Muchiri, Ouma, Koech, Sturrock and King2004; Kariuki et al. Reference Kariuki, Clennon, Brady, Kitron, Sturrock, Ouma, Ndzovu, Mungai, Hoffman, Hamburger, Pellegrini, Muchiri and King2004; Clennon et al. Reference Clennon, Mungai, Muchiri, King and Kitron2006). In a sequel paper we will apply our methodology (SWB model and calibration scheme) to this specific environment, comprised of 10 villages, each one subdivided into adult and child subgroups with 5 shared snail sites. When calibrated and validated, this model will then allow us to make projections on the transmission of vector-borne disease, and to simulate the effects of hypothetical control interventions based on variously targeted, single or combined drug therapy- and vector control-based schemes.
Infection strata
The host population H is divided into burden strata {h i} based on the number of parasites they carry.

So each group h i viewed as a local subpopulation carries a parasite range w i<w<w i+1. The dividers {w i} can be chosen arbitrarily, the simplest (extreme) choice being ‘zero-nonzero’ (‘infected’ – ‘non infected’) strata with prevalences {h 0, h 1}. Such partition would result in the standard SIR-type prevalence model. The SIR methodology (h 0; h 1) however, is too crude for macro-parasite transmission, where force of infection depends primarily on the worm burden of the host population, rather than the infection frequency. On the opposite extreme is continuously distributed worm burden {h(w):0⩽w<∞}, which has limited practical applications outside mathematical analyses. Our stratified worm burden (SWB) models extends the SIR (prevalence-based) modelling to accommodate both the worm burden and infection frequency relevant to population dynamics of macroparasite infections using the Macdonald-type ‘mean burden’ formulation, as explained below.
In what follows, we shall use uniform strata w i=iΔw; (i=0, 1, 2, …) counted in steps Δw worms. The choice of Δw is related to infectivity threshold w T – the ‘effective’ number below which a population is considered free of infection. It is convenient to take w T a multiple of Δw; thus w T=Δw means h 0=‘uninfected strata’, w T=2Δw the first two strata (h 0+h 1)=‘uninfected’, etc. Indeed, host infectivity is proportional to the number of mated worm pairs, which in turn depends on their mating probability ϕ(w) (Nasell, Reference Nasell1978; see also Anderson-May, Reference Anderson and May1991). Derivation of such a probability function is based on ‘negative-binomial’ assumption, suggesting a somewhat low threshold value w T=5 (independent of aggregation). On the other hand, experimental/field data for primate infection (Wilson, 2006) predict a substantially higher threshold for egg detection (w T≈40). We assume infectivity threshold to lie somewhere in between 10⩽w T⩽20, and numerically explore 2 values: w T=10 and w T=20. Accordingly, we choose to convert the continuous values to discrete values at 10 worms per step (discretization step, Δw). While the choice of step Δw is not essential for calibration and analysis (as explained below), the choice of threshold w T has significant effect (see Fig. 6).
For higher burden levels (w>10) we assume that host infectivity, as measured by egg counts, is roughly proportional to w i. The choice of uniform strata is not essential from computational standpoint, but has some mathematical advantages. We used 15 strata (i.e. burden levels up to 150 worms/host) in our analysis, which, according to our data set, is sufficient to cover a broad range of human infection, even heavily infected populations.
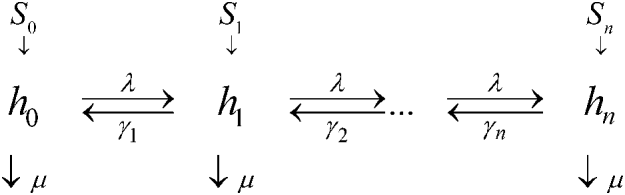
Fig. 1 shows the diagram of transitions among strata with ‘up-arrows’→designating the force of human infection λ (determined by infected snail/larval densities, water contact patterns, probability of worm establishment, etc.), and ‘down arrows’, ←indicating burden resolution γ i (due to worm mortality or other causes, including drug treatment). Different strata i have specific resolution rates γ i that increase with burden level. Additional source terms, S i, represent new recruits to the infection pool (newborns, migrants into the area, and transition from younger to older age groups). Loss rates, μ, combine host mortality as well as out-migration, aging, etc. In some papers μ's are considered to depend on level i to account for ‘burden-specific’ mortality. We ignore such disease-specific mortality as quite small, i.e., not having impact on population levels or community levels of schistosomiasis (even its more pathogenic S. japonicum species (van der Werf and de Vlas, Reference Van Der Werf and De Vlas2001)). So our μ are purely demographic and considered identical for homogeneous populations.
Infective strata and transitions of SWB model. Population strata (numbers or fractions of total) {h i} move ‘up’ or ‘down’ the scale at certain rates, due to worm acquisition (λ) and resolution (γ i). Each stratum has its source-term S i, and loss rate μ.

For age-structured populations (e.g., children and adult subgroupings) each group has its own infection strata, but their source terms differ. The children's source terms come primarily in the lowest (uninfected) strata S 0 (as newborns are free of infection). But the adult source, {S i}, will be distributed over all strata and depend on the burden distribution among children by the time they age into adulthood.
For a single (homogeneous) population H=∑0nh i, variables {h i(t)} obey a system of differential equations (SWB)

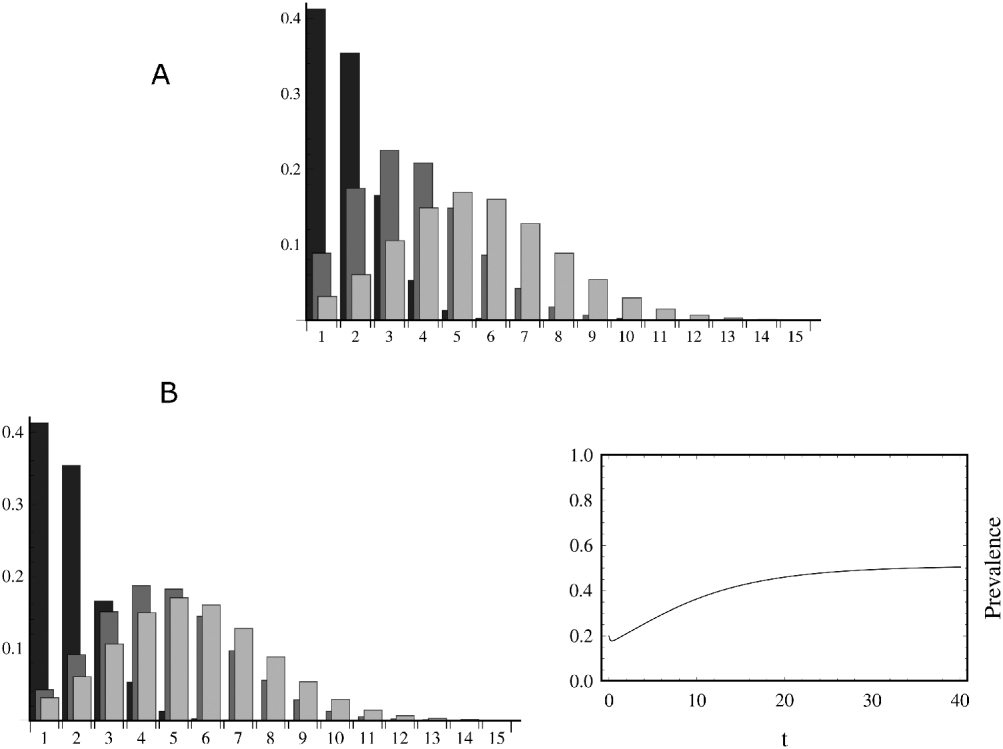
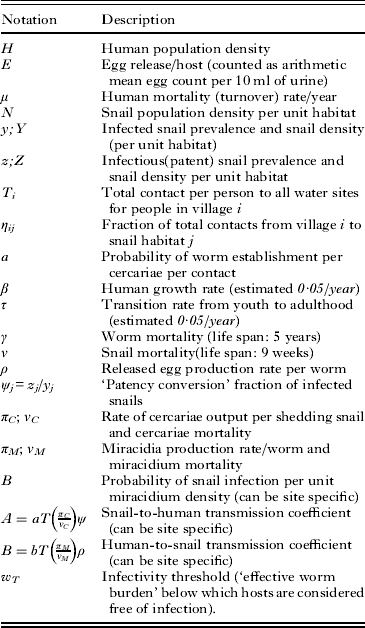
We used the following notations (i) transition rate λ is proportional to (per capita) force of infection:  , made of ‘transmission coefficient’/‘infected snail’ – A, infected snail density – z, and Δw – ‘burden increment’ in the definition of strata {h i} (see Appendix A and Table 1); (ii) resolution rates {γ i=γi} are proportional to burden levels {w i} of each strata (γ being natural worm mortality); (iii) host loss rate(s)=μ and new recruit sources={S i}. Here we assume identical force of infection and loss for all strata, i.e., a homogeneous community in terms of behaviour and environmental factors. This, however, does not preclude uneven (aggregated) burden distribution within system (1). Fig. 2A shows a few equilibrium distributions of human prevalence {h i(t)} (1) for several values λ contributed by a stationary source S 0 at the lowest (uninfected) stratum (a typical pattern for child group). Fig. 2B illustrates dynamic relaxation (to equilibrium) of the coupled SWB-system (1) and snail prevalence y(t) (see Appendix A). Here human force of infection λ=Ay and snail force Λ is proportional to the cumulative worm burden (2) of human population. For dynamic simulation Fig. 2B we initialized the coupled system at a low-level human infection (light bars) – a hypothetical effect of ‘drug clearing’, and let it relax to its natural equilibrium aggregated at higher burden levels (black bars).
(A) Equilibrium worm burden distribution for different values λ=0·2 (light grey), 0·6 (medium grey) and 1 (black), with identical human loss rate μ=0·02 and stationary source at the lowest strata. (B) Time relaxation of SWB-system coupled to infected snail prevalence. Left panel shows prevalence distributions of 15 human strata {h i(t)} at t=0 (light grey), t=20 (medium grey) and t=40 (black). For snail prevalence we show the dynamic relaxation pattern (right panel).

List of notations, variables and parameters

System (1) can be interpreted as cumulative outcome of a stochastic process of ‘worm acquisition-death’ on individual level. Indeed, the RHS of system (1) has a matrix made of ‘subdiagonal’ λ and ‘diagonal’ {γ j} that can be viewed as discretized Markov generator of such stochastic process. In this sense the standard Macdonald (Reference Macdonald1965) MWB gives the ‘statistical mean dynamics’ for such process (as function of time), whereas our SWB – its complete probability distribution function (PDF).
Human system (1) can be coupled in the usual way to snail infection (pre-patent and patent groups), through the force of human infection λ and the corresponding, extra-human, larval densities (Appendix A). Here the force of snail infection Λ will depend on human MWB, similar to the standard Macdonald (Reference Macdonald1965). But, unlike the Macdonald system, our MWB is not an independent variable but computed from prevalence variables {h i}

Rescaling
In the follow-up analysis and calibration we rescale SWB-system (1) and MWB (2) using non-dimensional (primed) variables and parameters, along with time and source terms. Specifically,

Then the i th equation for system (1) becomes

For the sake of brevity we shall drop ‘prime’ from all rescaled variables.
The SWB system yields several reduced equations based on statistical moments of distribution {h i}. Among them are (i) ‘total population dynamics’ for H (0-moment (sum)),

with S=H∑i=0nS i; (ii) Macdonald-type MWB equation for w (1st moment (mean))

Here  designates the cumulative source. Let us note that
 , if new recruits enter system (1) only through its non-infected (zero) compartment (like newborn children). Derivation of (4) exploits a special form of resolution rates γ i=γi for i-th strata). So worms in all hosts are assumed to have the same (mean) life-span, independent of the host state (age, burden level etc.). We also ignore all other confounding factors, like density-dependent mortality (due to crowding), or immune regulation of parasites. Such factors can in principle be included in the SWB scheme, but to calibrate such a model would require a more detailed demographic/infection data of host population (e.g. age, behavioural risk, susceptibility etc.), than provided in most community studies of schistosomiasis. Our formulation tries to keep what we believe are the most essential components of the system, suited for the most frequently available data.
Equation (4) looks like the standard Macdonald MWB for dimensionless w(t) with an additional term h n that disappears in the infinite limit systems (n→∞), used in many theoretical studies. In our case (finite size SWB) this term remains positive, but sufficiently small over a wide range of parameter values, to be safely dropped in the follow-up analysis and calibration.
Equations (3) (total population growth) and (4) (MWB dynamics) represent the first two statistical moments of distribution {h i} driven by SWB system (1). It can be further extended to higher moments: variance, aggregation etc. Such schemes were adopted in some theoretical studies (e.g. Pugliese Reference Pugliese2000) as a way to reduce a large (infinite) system (1) to its low-dimensional (mean-field) approximation. In this paper, our goal and approach is different. We utilize reduced (moment) equations (3)–(4) for model calibration. But all dynamic simulations (for prediction-analysis-control) are run with full SWB system (1), using its calibrated parameters. Thus a system of 10 villages in a particular study area (Msambweni), with each population subdivided into child and adult groups will contain 2×10×15 ‘human’ variables plus a suitable number of ‘snail’ variables proportional to the number of contact sites.
It should be stressed that increased order (dimension) of SWB system (compared to its MWB cousin) posed no substantial mathematical or computational obstacle by itself. Indeed, we can generate such a large, coupled dynamical system using Wolfram Mathematica 7 (Champaign, IL). It also allows efficient ways to solve and manipulate them in various ways for analysis, calibration, prediction and control experiments. Details of these programs are available from the corresponding author.
Analysis of equilibria
The equilibrium solution of system (1), with stationary source S and prescribed λ, depends on 2 parameters μ and λ. The former μ is determined by known demographical or biological factors, the latter λ (proportional to the force of human infection) can vary depending on the transmission environment, and will be calibrated along with other parameters.
The complete SWB system (1) has no exact analytic solutions (even for stationary equilibria), but we can explore a broad range of parameters {λ, μ} numerically. Fig. 2A shows equilibrium burden distributions at several λ. Qualitatively they resemble negative binomial (NB) distributions of decreased aggregation (smaller λ having higher aggregation, hence a larger fraction of low-level infections).
MWB equation (4) can be used either in dimensional form for variable w(t), or non-dimensional w=∑1nih i. Our calibration scheme exploits 2 epidemiological data values, uninfected human prevalence P=h 0, and MWB, w (which is related to measured egg-counts in the field). Both are functions of parameters λ, μ, and source S

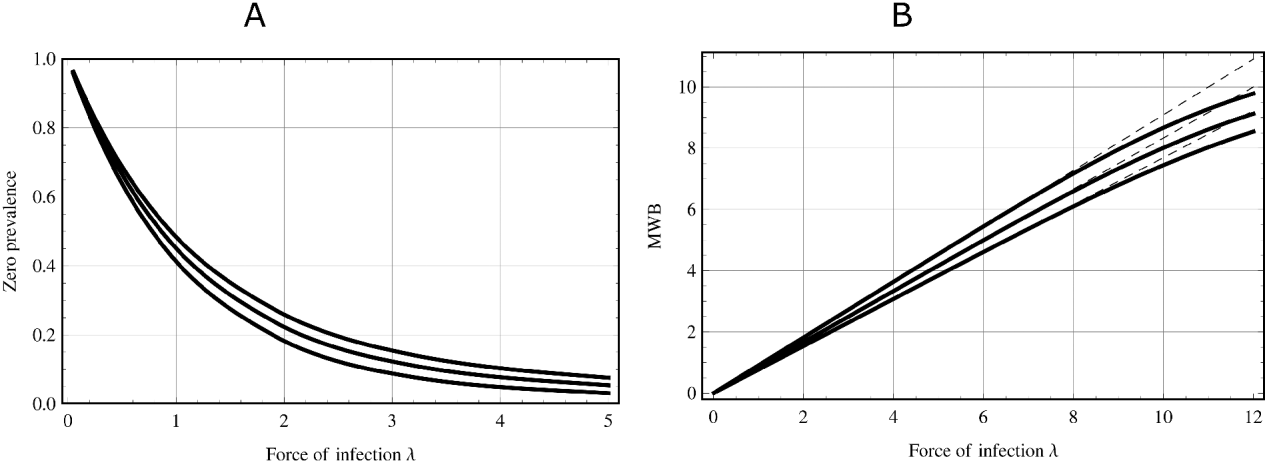
Both functions ϕ and ψ are illustrated in Fig. 3. While there are no analytic formulae, they can be easily computed numerically by interpolation (sampling a range of values λ and μ). These procedures are used extensively in our calibration schemes below.
(A) Plot of uninfected prevalence function P=ϕ(λ, μ, S) on worm acquisition rate λ for 3 values μ={0·1γ, 0·2γ, 0·3γ} (top to bottom) and identical stationary source (S) at the lowest strata; (B) Plot of MWB-function w=ψ(λ, μ, S) on λ for the same values of μ as (A) (top to bottom) with dashed lines corresponding to a would-be ‘linear relation’ (slope)  at λ=0 (appropriate for Macdonald MWB).

Let us note that the range of uninfected human prevalence from our data (Table 2), 0·2<P<1, constrains λ/γ within relatively narrow interval [0, 2·5] (Fig. 3A). In that range, both λ and w obey a nearly linear (Macdonald type) relationship (Fig. 3B),

which is important for our calibration scheme. At large λ>8 (a strong force of infection) we observe nonlinear departure from simple Macdonald model outcomes (Fig. 3B), due to the extra-term of our MWB-equation (4). But this range (and level of transmission) is well above the likely range of values in our study environment.
Human and snail demographics and infection data: ‘egg-count’ refers to arithmetic mean/host


MODEL CALIBRATION
Data that are typically available for calibrating models of macro-parasite transmission include: (i) Demographics: human population H, and snail density N; (ii) Biological factors: human loss rates (mortality, turnover) – μ, snail mortality – ν, worm mortality γ; (iii) Epidemiological infection data: infected and patent snail prevalences (y, z), human egg-counts (arithmetic and geometric means) E, G. Depending on the choice of model, all or part of these data can be used for estimating unknown transmission parameters (see, e.g. Riley et al. Reference Riley, Carabin, Belisle, Joseph, Tallo, Balolong, Willingham, Fernandez, Gonzales, Olveda and Mcgarvey2008).
In our calibration scheme below, we use both egg-counts (arithmetic mean) and infection prevalence as 2 independent parameters. For the sake of exposition we precede the discussion of larger, distributed systems, with a few special cases.
The general scheme involves 3 steps:
(i) Estimate human force of infection λ (for suitable populations) from demographic and human prevalence data. This part utilizes prevalence function ϕ(λ, μ, S)
(ii) Next estimate snail-to-human transmission coefficient {A} for appropriate population groups, as well as biological parameter ρ (egg-production/worm).
(iii) Finally, estimate human-to-snail transmission coefficients {B} (see Table 1 for notations).
The single population case
In this case our calibration scheme will utilize 2 reduced equations resulting from SWB (1): (i) MWB (4) coupled to a snail prevalence equation (as in the standard Macdonald setup), and (ii) an equilibrium zero-prevalence function (5), computed numerically. The former gives a coupled system of 2 differential equations for w(t) and y(t)

with per capita forces of infection

The transmission coefficients A (snail to human) and B (human to snail) depend on several biological and environmental/behavioural factors (Table 1). Let us note that having stratified human population is irrelevant for snail infection, as long as all strata have similar behavioural (water contact) patterns. So the force of snail infection Λ is the same as in the classical Macdonald setup (i.e., proportional to total human burden, Hw)
System (7) has stable endemic equilibrium provided its Basic Reproduction Number (BRN)

Our goal is to estimate transmission coefficients A, B from equilibrium solutions (7) and the available data. The data include egg-count E (related linearly to w) and snail prevalence (y). The relation of E to w is given by another (unknown) parameter egg production rate

Our goal is to calibrate parameters A, B, ρ. We proceed in 2 steps:
(1) solve equation (5) for a given (known) human prevalence P, relative loss rate μ, (demographics), and source S, to find rescaled force of infection λ.
(2) compute A from the first expression of (8), ρ and B equilibrium of equations (7)
The resulting explicit formulae give calibrated parameters in terms of the data

In reality, infection field data, either human (egg-counts E, prevalence P) or snail data (pre-patent and patent prevalences y, z), can be highly inaccurate (de Vlas et al. Reference de Vlas, Engels, Rabello, Oostburg, Van Lieshout, Polderman, Van Oortmarssen, Habbema and Gryseels1997; Hamburger et al. Reference Hamburger, Hoffman, Kariuki, Muchiri, Ouma, Koech, Sturrock and King2004) due to low sensitivity of the standard tests and observational errors. One way to account for data errors (underestimation) is through a suitable statistical ensemble of data values and the resulting parameters (A, B, ρ). Here explicit formulae (9) prove helpful, as any a priori information of data errors (statistics or distribution) can be translated via (9) into suitable estimates for calibrated parameters. Indeed, we shall explore sensitivity of our calibration scheme to data errors for a specific data set (below).
Multiple risk groups
Next we subdivide human population within a single village (or human–snail site pairing) into several risk groups labelled by index s, that differ in their behaviour (contact rate) hence the resulting force of infection, λ s. In the following, those will be children and adult groups. The extended system couples human transmission (either MWB equations for dimensional {w s} or the corresponding SWBs for each risk-group) and a single snail equation (contributed by all groups)

As above, we use equilibrium solutions (10) along with the prevalence equation ϕ(λ s, μ s, S s)=P s, for each group. The calibration problem now asks to estimate transmission coefficients {A s, B s}. The above 2 steps yield (i) the rescaled force of infection for each group {λ s}, (ii) the corresponding A-coefficients

To get B-coefficients we observe that both sets (A's and B's) are proportional to contact rates {η s}, assumed to be the only risk factor,

Here a is worm establishment rate/per single infected snail, assumed to be identical for all groups, b – snail infection rate/per single worm×contact. Then we get B-coefficients

expressed through group specific egg-production/worm rates

Equations (11)–(13)–(14) extend the above calibration scheme (9) to heterogeneous populations with multiple risk groups.
Child–adult system
Next we further specify the above ‘multi-risk’ setup for separate child–adult groups, still within a single human–snail pairing context. These two human age-related subgroups differ in their risk factors (contact behaviour) and infection levels. This case, however, differs from the previous one, in that the two groups are also coupled by a demographic birth–aging process, whereby infection is carried from the younger to the older group. The population dynamics for variables H c; H a (total child/adult populations) is given by a Leslie-type differential system

The demographic parameters include (i) mean per capita birth rate β, (ii) specific child and adult mortalities μ c, μ a, (iii) transition (aging) rate τ.
Note that population dynamics (15) follow from the extended child–adult SWB system, the same way that the previous simple population model (3) follows from (1). The source term for child SWB, S c=βH a, enters through the uninfected (zero) stratum (newborns), whereas the adult source, S a, is equal to children's SWB distribution ((Eq.B.1) in Appendix B).
The real population and transmission dynamics are more involved. Clearly, different ages have different SWB-distributions, gradually changing from early childhood (aggregated at low burden) to older age-group patterns shifted towards higher w (Fig. 2). The adult source would then come from the older children's distribution (15–20 years), rather than the mean distribution over all ages (5–20). In principle, both systems (demographic and SWB) can be extended to accommodate refined population structure (e.g. 5-year bins). But here we confine ourselves to the coarse child–adult partition, as the only available epidemiological data for our specific environment has only those two groups.
The corresponding child–adult Macdonald-type MWB equations account for demographics

As in the previous (multiple risk) case, we utilize zero-prevalence to compute forces of infection,

Specifically, we first find children's force of infection λ c with known prevalence P c and source S c (in terms of birth rate), then compute the resulting equilibrium-prevalence distribution  , substitute it to get adult source S a={τh icH c/H a}i=0n and get λ a from the second equation in (17). Having estimated both λ's we proceed as in the previous section to get transmission coefficients {A c; A a; B c; B a; ρ c; ρ a} for two groups (see Appendix B for details).
Distributed system
Our next goal is to extend the above models and calibration scheme for geographically distributed systems made up of several different human sites (villages), labelled by i=1, 2, …, n, and connected snail (water), sites labelled by j=1, 2, …, m. Mathematically, calibration of such dynamical system is an ill-posed (heavily under-determined) problem as far as the available human and snail infection data. Indeed, the n+m equations of a typical ‘MWB+snail prevalence’ system (Eq.C.1) have altogether (2n×m) unknown transmission coefficients {A ij; B ij}, if all connections are allowed (Woolhouse, Reference Woolhouse1991; Woolhouse et al. Reference Woolhouse, Watts and Chandiwana1991; Gurarie and King, Reference Gurarie and King2005; Riley et al. Reference Riley, Carabin, Belisle, Joseph, Tallo, Balolong, Willingham, Fernandez, Gonzales, Olveda and Mcgarvey2008). Different reduction schemes can be used to constrain the resulting parameter set. Thus Gurarie and King (Reference Gurarie and King2005) and Gurarie and Seto (Reference Gurarie and Seto2009) proposed a version of a landscape ‘gravity’ model, whereby geographical distances (or other hurdles) control human water contact rates. A suitable parameterization of this hurdle-function yields a drastic reduction of the parameter set.
Other procedures are possible depending on the available data. For example, data collected from our specific environment (Msambweni region of eastern Kenya (Sturrock et al. Reference Sturrock, Kinyanjui, Thiongo, Tosha, Ouma, King, Koech, Siongok and Mahmoud1990; Muchiri et al. Reference Muchiri, Ouma and King1996; Hamburger et al. Reference Hamburger, Hoffman, Kariuki, Muchiri, Ouma, Koech, Sturrock and King2004; Kariuki et al. Reference Kariuki, Clennon, Brady, Kitron, Sturrock, Ouma, Ndzovu, Mungai, Hoffman, Hamburger, Pellegrini, Muchiri and King2004; Clennon et al. Reference Clennon, Mungai, Muchiri, King and Kitron2006)) has additional information in terms of relative contact rates from various human sites to water (snail) sites. Here we propose a distributed calibration scheme designed specifically for such type of data. Each contact pair (i, j) contributes to human infection in village i and snail infection at site j through transmission coefficients A ij; B ij both proportional to absolute contacts per person from village i to water site j, T iη ij with T i being the group- specific total contacts to all water sites and η ij relative contact (∑jη ij=1). Our basic hypothesis is that each of them is a product of a suitable local (biological/environmental) factor (A 0 times ‘absolute contact rate’),

It means that humans at site i will pick up infection from snail site j in proportion to their ‘absolute contact’בthe site's snail infection level’. By the same pattern, snails at j will get infected by humans from different sites i in proportion to their absolute contact times human infection level (egg release). Since the establishment of miracidia in snails involves 2 stages – hatching of miracidia and the miracidium's successful invasion into a snail body – which depends heavily on the local environmental conditions, we set the local environmental factor B 0j as site specific. This hypothesis clearly reduces the number of unknown parameters to a manageable set {A i; B j}, consistent with the number of MWB equations.
Accordingly, for age-structured populations, the MWB system ((Eq.C.2) in Appendix C) has the following unknown parameters to be estimated: (i) local transmission coefficients for child–adult groups {A ic; A ia}; (ii) local transmission coefficients for snail sites {B j}; (iii) egg production/release rate for children and adults {ρ c; ρ a}, the latter two are biological factors independent of location.
The calibration scheme proceeds similarly to the previous case. Namely, we first use local prevalence and loss rate for children and adults to get their local rescaled forces of infection, {λ ic; λ ia}, as in Table 3. Then we write the proper distributed versions of the calibration formula (11), (14)

Calibrated transmission coefficients and egg production rates based on the individual level field data for 2 choices of discretization step (Δw), and infection threshold w T=10.


Symbol s={c, a} indicates child/adult groups, and denominator of A gives a weighted snail infection density (with relative ‘contact weights’). While all A-coefficients are local (i.e., depend on i), the egg production term, ρ s, should be biological and site independent. So, based on (19) we expect the numerator of the right hand site of ρ s expression to be proportional to the denominator at all sites, with slope ρ s. The real data show departures from simple linear relations, so we approximate parameters ρ c; ρ a with their ‘best-fit’ slopes. Having estimated {A is} and {ρ s}, we compute coefficients {B j} from the snail equilibrium equations ((Eq.C.4) in Appendix C).
RESULTS
Calibration results for a specific environment
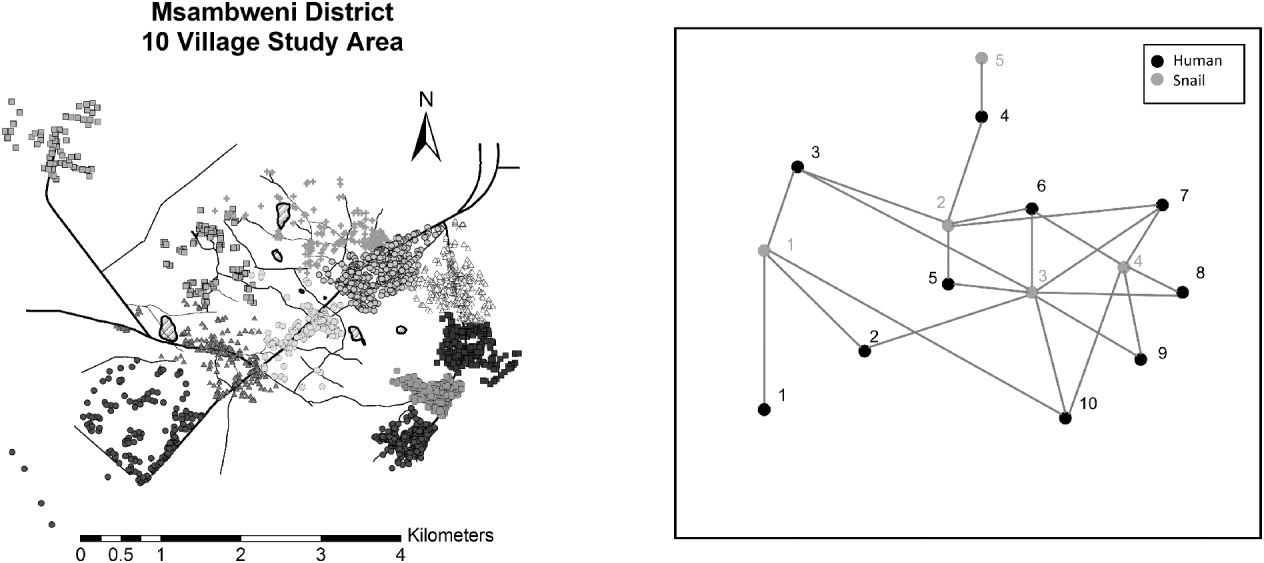
In this section we apply SWB methodology to a specific environment of the Msambweni region of Eastern Kenya sampled from 10 villages and 5 contact snail sites observed in year 2000, shown in Fig. 4 (Sturrock et al. Reference Sturrock, Kinyanjui, Thiongo, Tosha, Ouma, King, Koech, Siongok and Mahmoud1990; Muchiri et al. Reference Muchiri, Ouma and King1996; Hamburger et al. Reference Hamburger, Hoffman, Kariuki, Muchiri, Ouma, Koech, Sturrock and King2004; Kariuki et al. Reference Kariuki, Clennon, Brady, Kitron, Sturrock, Ouma, Ndzovu, Mungai, Hoffman, Hamburger, Pellegrini, Muchiri and King2004; Clennon et al. Reference Clennon, Mungai, Muchiri, King and Kitron2006). Infection prevalence and egg-counts (arithmetic means) were observed using standard filtration of urine samples (10 ml) from the resident populations (Table 2). Basic biological parameters were included from well-known estimates of snail and worm mortality, as well as basic life table estimates (among other parameters in Table 1). Field data (Table 2) for the models included (i) demographic data: human populations (divided into child/adult groups) and snail densities; (ii) infection data: mean egg count for children in each village and density of susceptible, infected and shedding adult snails in all water sites; and (iii) behavioural data: relative contact distribution for each village to adjacent snail sites.
Partial area map of the Msambweni region (left), and its schematic view (right) with human sites (black dots), snail sites (grey dots) and established ‘human-to-snail’ links based on observed human contact activity.

We first demonstrate calibration results of the individual level field data, utilizing formulae and procedures of the previous methods sections (Model Calibration). As above we run it in 3 steps:
(i) Estimate ‘local forces’ of human infection in 10 villages (first children, then adults) from the human data (prevalence and demographics), by solving equations at each site. Here we utilize the known (‘universal’) childhood prevalence function ϕ(λ, μ, S c) (Fig. 3) and the derived adult prevalence function ϕ(λ, μ, S a) with source S a from the children's group.
(ii) Next we estimate village-specific transmission coefficients A i(i=1, 2, …, 10) for child/adult groups via formulae (19), and forces of infection λ i (output of step (i)). We also compute the ‘best-fit’ estimates for biological parameters ρ c; ρ a (egg-production/worm).
(iii) Finally, we estimate snail transmission coefficients B j(j=1, 2, …, 5) from equation (Eq.C.4) (Appendix C).
Table 3 shows estimated snail to human transmission coefficients {A c, A a} for child and adult groups in 10 villages, along with the best fit egg-production rate estimates {ρ c, ρ a} for the two groups, and human to snail transmission rates {Bj: j=1, …, 5}. We also looked at the effect of worm discretization step Δw on estimated parameters. To this end we run 2 calibrations of the individual level field data, with steps Δw=10 and Δw=5, and fixed infectivity threshold w T=10 (Table 3). The 2nd case gave overall higher estimates of transmission rates {A i}, but the children group was less sensitive (<15%) than adults. Since children carry the bulk of infection and transmission, our scheme seems overall insensitive to Δw.
Model validation
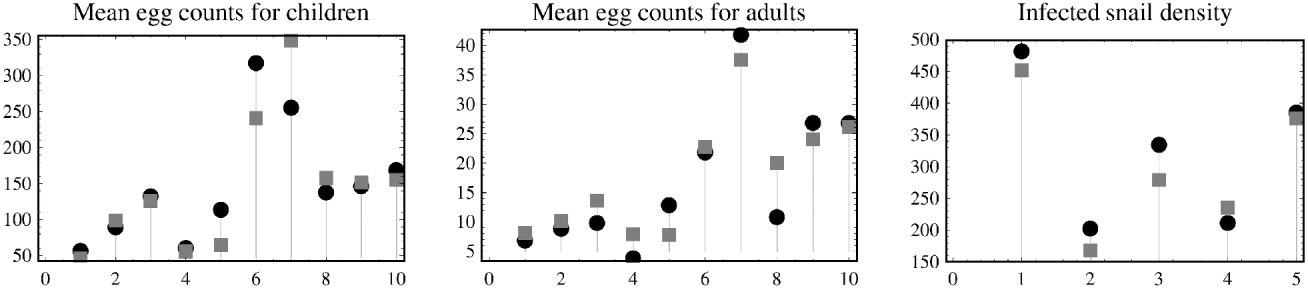
We ran a simple self-consistency (validation) test for our calibrated system by comparing the predicted equilibria (computed from the model) with the individual level field data. An exact match is not expected as parameters of the distributed system are no longer exact solutions of equilibrium equations. Indeed, the complete set of equations (MWB+human prevalence+snail prevalence) is over-determined now, so we use best-fit approximation to obtain the estimates of Table 3. The comparison test shows good agreement (Fig. 5).
Comparison between individual level field data (dark disk) and equilibrium solutions of the calibrated model (grey square); the x-axis labels the ‘village’ or snail site and y-axis – ‘mean egg count’ or ‘snail density’.

Sensitivity analysis
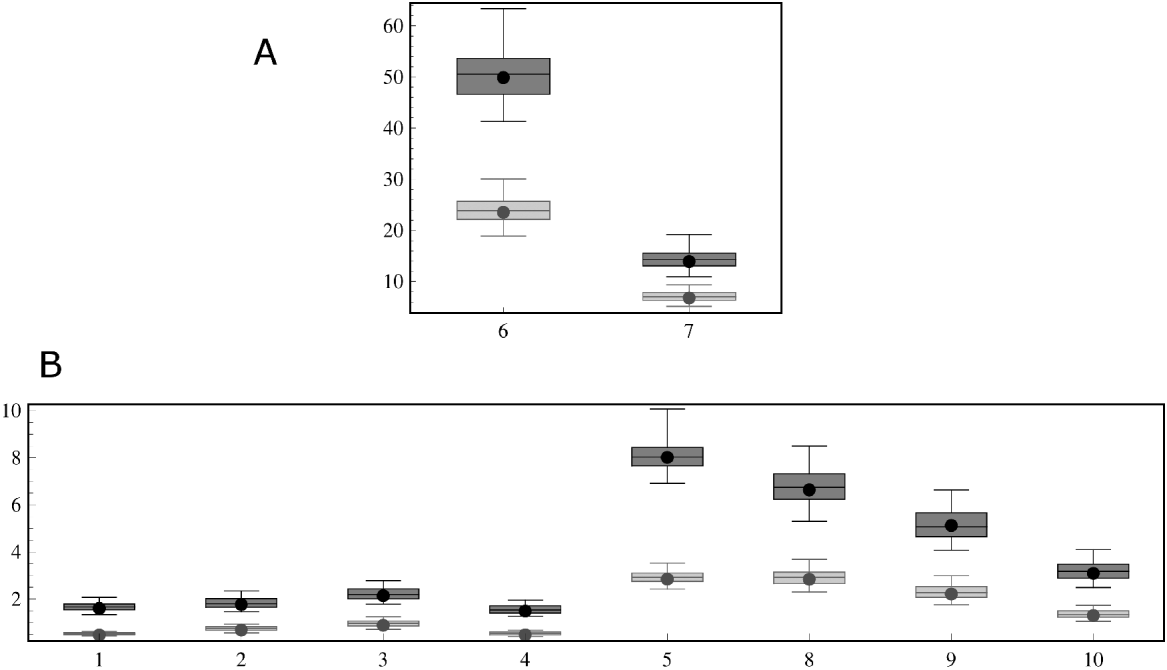
The infection data based on egg and snail counts is notoriously inaccurate partly due to imperfect diagnostic tools. Another major uncertainty in our model is the infectivity threshold w T. To examine such uncertainties on calibrated parameters we took 2 threshold values w T=10 and 20, and in each case run an ensemble of 200 data choices, randomly selected within suitable ranges: ±10% of the individual level field data, for egg counts; ±5% – for human prevalences, and ±20% – for snail infection. The error margins are somewhat arbitrary, but they reflect the overall level of uncertainty. For instance, individual egg-counts can be much ‘noisier’ than 10%, but the community mean would reduce their variance by factor 1/n – community size. Fig. 6 shows the results of sensitivity analysis for some calibrated parameters. The overall estimates remain fairly stable (error <5%). We plan to use the calibrated ensemble of parameters to provide error bars for predicted control outcomes in the future work on control analysis with SWB.
Sensitivity analysis of model parameters (snail-to-human transmission rates) {A i} for children in 10 villages: panel (A) shows heavily infected villages nos 6 and 7, and panel (B) for all others. Two sets (light/dark) of box-and-whisker plots (‘box’=0·25–0·75 quantiles; ‘whiskers’=10–90) correspond to infectivity thresholds w T=10 and w T=20. Black dots mark calibrated values of the ‘individual level field data’ in each case.

SUMMARY AND CONCLUSIONS
We propose a new approach to modelling schistosomiasis transmission (and other vector-borne macroparasites), based on a Stratified Worm Burden (SWB) formulation. In this approach, a community of hosts is subdivided into burden strata in terms of their infection levels. The transitions among strata depend on (i) force of infection (determined by the transmission environment and human risk factors); (ii) worm attrition (natural or drug-induced); and (iii) human demographics (ageing, mortality, growth sources). Such stratified systems offer many advantages compared to the conventional MWB approach (Macdonald, Reference Macdonald1965), or SIR-type prevalence systems. By naturally encoding both types of information, these models allow new (refined) calibration procedures with the available data. Furthermore, they can also include demographics and/or other measured (e.g., behavioural) risk factors for structured human populations (age, occupation, etc.). Finally, SWB naturally explain highly aggregated burden distributions in host populations (typical of Schistosoma and other helminth infections (Anderson and May, Reference Anderson and May1991)) without imposing ad hoc distribution patterns.
We have demonstrated the SWB approach and model calibration procedures in several settings: the single homogeneous population, a population with multiple risk/age groups (child–adult systems), and a more complex area with geographically distributed human–snail populations and contact patterns. In each case, the modelling combines demographics (population levels, births, deaths, and ageing), human–snail infection levels (egg-counts and prevalences), and for distributed systems, a minimum of environmental data (snail habitats, human contact patterns, etc.).
In simple cases such dynamical (differential) systems can be analysed mathematically to determine their endemic equilibrium levels in terms of transmission parameters such as the Basic Reproduction Number, R 0. In all cases they are amenable to efficient numeric implementation using desktop software, despite a large number of variables and parameters. For instance, a complete list of variables for a distributed human–snail system would typically include number of population sites×population age/risk groups×burden strata+all snail variables. Here, we were able to implement it using accessible commercial desktop software.
The SWB methodology has many potential applications. In the present paper, we outlined calibration results for a specific environment (the Msambweni region of eastern Kenya). We also conducted a simple validation test and sensitivity analysis of our calibration scheme to uncertainties in the data (random errors). In subsequent work we shall provide further details and applications of our methodology in exploring the predicted impact of different control strategies such as the currently advocated targeted treatment of school-aged children (WHO, 2006) as compared to community-based delivery to children and adults (Gabrielli et al. Reference Gabrielli, Toure, Sellin, Sellin, Ky, Ouedraogo, Yaogho, Wilson, Thompson, Sanou and Fenwick2006).
One might wonder how our extended model and results compare to the standard (Macdonald) MWB approach. There is no direct way to compare the two systems, as MWB by itself has no human prevalence information. Other significant differences can arise in implementation of drug treatment in the two systems. The drug-based clearing of infection can enter an MWB-system only through increased worm mortality, whereas in SWB we implement it by shifting burden strata from ‘high’ to ‘low’ to ‘lowest’ levels as hosts get cleared. The significant difference has to do with the slow process of natural worm mortality versus fast worm clearing by drug. We shall discuss this aspect in more detail in the forthcoming work on control interventions.
While our approach allows more detailed parasite distribution in host populations, it leaves out many other important within-host factors, such as density-dependent survival and egg-production and immune regulation of parasite levels and establishment. Some of these factors (immunity) are age-dependent, and would require more detailed age-structured (doubly stratified) SWB. In the current analysis, we had limited parasitological data (child–adult), and structured our model accordingly. Hence age-dependent factors (immunological etc) enter our system through different transmission and egg-production rates. Table 3 shows marked differences between two groups, and we attribute this fact partly to a protective role of immunity that develops with age.
It is, however, somewhat easier to accommodate density-dependent factors (worm survival and host infectivity) within SWB approach. Resolution rates {γ m} (for m-th strata) related to worm mortality, can be made to increase faster (than linearly) in ‘m’ to account for crowding mortality. One can also make infectivity (egg-production) of m-th strata a non-linear function of m in terms of reduced fertility. While there is no simple way to accommodate such features in MWB, we have demonstrated how SWB provides a natural representation of such macroparasite dynamics.
ACKNOWLEDGEMENTS
The authors thank the referees for their pointed questions and stimulating comments that helped us to improve the results and exposition of the work.
FINANCIAL SUPPORT
This project was supported in part by National Institutes of Health Research Grant R01 TW008067 funded by the Fogarty International Center. The funders had no role in study design, data collection and analysis, decision to publish, or preparation of the manuscript.
APPENDICES
A. Basic Macdonald system for multiple human risk groups
All snail and larvae populations {N; c, m} are measured by [density]/[unit snail habitat]. Our basic assumptions include
(i) Snails are minimally mobile and relatively attached to their local habitat, so we ignore hydrologic (or other) transport of snails/larvae.
(ii) There is an approximately uniform snail density throughout each habitat (their local numbers are part of the collected field data).
(iii) All human–snail contacts and transmission (via larval densities) take place locally. So the force of human-to-snail infection (miracidial production term) is proportional to human population density/unit habitat, rather than total human population.
The basic Macdonald setup (Macdonald, Reference Macdonald1965) for single habitat modified to include multiple risk groups (labelled by s), consists of (i) mean worm burden (MWB) and egg counts {w s, E s}; (ii) susceptible- infected-patent snail densities (or prevalences) {x, y, z}; (iii) cercarial and miracidial densities {c, m}:

The miracidial production term is given by Q s=π Mη sH sE s – proportional to the population density (per unit habitat).
When specified for child–adult groups (the human part of the MWB system) takes the form

Here we allow for aging, i.e. transition of worm burden from ‘child’ to ‘adult’ compartment at the age of 20. Hence we estimated loss-rate (τ=0·05) in the child-equation, balanced by a gain term,  , in the adult-equation, weighted in proportion to population fraction H c/H a. In this formulation we assumed stationary populations, but the equations can be easily adjusted for variable (time dependent) case. The notations are listed in Table 1.
The complete system (Eq.A.1) can be reduced by eliminating larval equations, due to their ‘fast’ death rates (μ C; μ M) compared to other ‘slow’ processes. So we replace (c, m) with their quasi-equilibrium values

The resulting human–snail system has MWB-type human equations:  (for s-group), or specifying it for a ‘child–adult’ setup we get

The snail part assuming stationary (seasonal mean) total population N, consist of 3 prevalence variables: x-susceptible, y-infected (pre-patent), z-patent, that obey a system of equations

The snail force of infection Λ (contributed by all contact groups {s}) is given by

The transmission coefficients {A s; B s} (‘snail-to-human’ and ‘human-to-snail’) are shown in Table 1.
B. Child–adult SWB system
Differential equations for SWB system for children and adults

The condition for stationary population in demographic equations (15) is

We estimated τ and β from the demographic data of the Msambweni region (Sturrock et al., Reference Sturrock, Kinyanjui, Thiongo, Tosha, Ouma, King, Koech, Siongok and Mahmoud1990; Muchiri et al., Reference Muchiri, Ouma and King1996; Hamburger et al., Reference Hamburger, Hoffman, Kariuki, Muchiri, Ouma, Koech, Sturrock and King2004; Kariuki et al., Reference Kariuki, Clennon, Brady, Kitron, Sturrock, Ouma, Ndzovu, Mungai, Hoffman, Hamburger, Pellegrini, Muchiri and King2004; Clennon et al., Reference Clennon, Mungai, Muchiri, King and Kitron2006). The child–adult death rates were computed from

They depend on local populations, hence we make them site specific.
Having estimated rescaled forces of infection λ c and λ a, we get the transmission coefficients and egg release rate from the equilibrium solution of system (16)

C. Distributed system
MWB equations for distributed human–snail meta-population system:

MWB equations for an age-structured (child–adult) human population with implified transmission coefficients:

Here we use local patent snail densities {Z j} instead of infected snail prevalences of earlier special cases (formulae (9)–(11)–(13)). Since patency conversion rates of infected snails {ψ j=Z j/Y j} are local and vary across snail sites (Table 2) we need to account of their contribution to human infection separately. Another modification is the force of infection for snail in (Eq.C.2).

Here {U j} are relative sizes of snail habitats (based on the number of contact sites of Table 2). We divide ‘human population’ by ‘contact size’ (H i/U j), since humans distribute their infection in inverse proportions to contact size of each habitat. Also the mean egg count E i is used in (Eq.C.3) instead of the mean worm burden w i in the snail force of infection Λ, as different age groups may have different egg-release rates. The transmission coefficients {A i; B j} in formula (Eq.C.3) are somewhat different from earlier cases (Table 1). Namely,

where T is represents the total contact rate for the risk group s in village i to all water sites. Having estimated A ic, A ia, ρ c and ρ a, we compute B j from the snail equation (2) at site j, using the relation between A’s and B’s equation (18):