I. INTRODUCTION
Nanoindentation probes small volumes of material and measures the mechanical properties with nanoscale precision.Reference Oliver and Pharr1 Nanoindentation contributes significantly to the investigation of plasticity at decreasing scales of interest.Reference Corcoran, Colton, Lilleodden and Gerberich2, Reference Schuh, Mason and Lund3 Small-scale contacts are frequent during the fabrication and/or the operation of microelectronic and photonic as well as micro-electromechanical systems (MEMS) devices.Reference Cha, Srolovitz and Vanderlick4 The contact size can vary depending on the asperities of the two surfaces in contact. The understanding of plasticity at various contact sizes is hence important not only from a theoretical viewpoint but also for a practical application.
In a nanoindentation on a well-prepared surface of crystalline materials (without defect or oxide contamination), indentation load–displacement (P–h) curves initially show an elastic deformation response up to a certain critical indentation load (P c). Above P c, the P–h curves show sudden increases in an indenter displacement (bursts) or sharp decreases in a load (dips) depending on load-controlled or displacement-controlled tests, respectively.Reference Van Vliet, Li, Zhu, Yip and Suresh5 These phenomena have been believed to indicate dislocation nucleation and propagation within a defect-free zone, which induces a sudden transition from elastic to plastic deformation.Reference Gouldstone, Van Vliet and Suresh6 Thus, it has so far been assumed that the displacement bursts (pop-ins) are only probable when no mobile dislocations exist in the volume beneath an indenter.
Recently, Shim et al.Reference Shim, Bei, George and Pharr7 reported a new type of indentation size effect (ISE) in single crystal Ni. Conventional ISE in the indentation literature is based on hardness, which is found to increase with decreasing indentation depth for Berkovich indentersReference Gao, Huang, Nix and Hutchinson8 and decreasing indenter radius for spherical indenters.Reference Qu, Huang, Pharr and Hwang9 The new type of ISE discovered by Shim et al. is based on the stress needed to initiate dislocation plasticity. The authors found that the transition from elastic to plastic behavior occurs with a clear sudden displacement burst for a wide range of spherical indenter radii. The maximum shear stresses under the spherical indenters at first pop-in were increasing with decreasing indenter radius and reach the theoretical strength for smallest spheres. The material in the highly stressed zone underneath small spheres is likely to be dislocation free, hence requiring dislocation nucleation at the theoretical stress. At larger spheres plasticity, it is postulated that there is an increasing probability that a nearby preexisting dislocation is probed by a sufficiently large volume of stressed zone and the activation of these preexisting dislocations initiates a transition from elastic to plastic deformation.Reference Shim, Bei, George and Pharr7
The displacement bursts for small indenter radii are not newly found phenomena and have been dealt with by some previous investigations.Reference Gerberich, Venkataraman, Huang, Harvey and Kohlstedt10–Reference Shibutani, Tsuru and Koyama16 The microscopic mechanism of dislocation evolution during the pop-ins has been checked by various dislocation models, which indicate that the displacement bursts can be attributed to the nucleation of dislocations. Some models have been proposed by assuming the nucleation of prismatic loopsReference Gerberich, Mook, Chambers, Cordill, Perrey, Carter, Miller, Curtin, Mukherjee and Girshick15, Reference Shibutani, Tsuru and Koyama16 or shear loopsReference Gerberich, Venkataraman, Huang, Harvey and Kohlstedt10, Reference Gerberich, Nelson, Lilleodden, Anderson and Wyrobek11 and by balancing the applied work with the work dissipated by the motion of the loopsReference Gouldstone, Koh, Zeng, Giannakopoulos and Suresh14–Reference Shibutani, Tsuru and Koyama16 or equilibrating the forces between each dislocation loop.Reference Gerberich, Nelson, Lilleodden, Anderson and Wyrobek11, Reference Gerberich, Karmer, Tymiak, Volinsky, Bahr and Kriese13
Clear pop-ins under larger indenter radii are newly observed phenomena and unexpected based on the following argument. The number of dislocations N within the area of contact radius “a” can be estimated to be ∼ρπa 2 (= ρπRh, for spherical indenters), where ρ is the initial dislocation density and R and h are the indenter radius and the indenter depth at the initiation of a pop-in, respectively. In the case of metallic single crystals, if the dislocation density ρ have a typical value of ∼1012 m−2, the maximum indenter radius R which has N ≤ 1 is 1.3–3 μm by considering that h ∼ (0.03–0.2)R as experimentally observed.Reference Shim, Bei, George and Pharr7, Reference Bei, Gao, Shim, George and Pharr17 Therefore, a pop-in is presumed not to happen for R ≥ 3 μmReference Lorenz, Zeckzer, Hilpert and Grau18 because the existing dislocations inside the highly stressed volume under the indenter are likely to continuously participate in plastic deformation and no sudden displacement burst arises. However, pristine Ni single crystals indented with spherical indenters were found to show a clear pop-in up to an indenter radius of ∼200 μm.Reference Shim, Bei, George and Pharr7 Although the authors have suggested that the displacement bursts can be attributed by the activation of preexisting dislocations by the stress field of indenter, considerable further studies developing comprehensive theoretical models and involving electron microscopy are required in an attempt to elucidate the mechanics and mechanisms of indentation.
The objective of the present work was to develop a mechanistic understanding of the displacement bursts for large indenter radii. Particular attention was devoted to develop a simple energy balance model to explain the linear relationship between the load and the excursion length at the displacement burst under a large indenter. For this purpose, nanoindentation experiments with various indenter radii were conducted on Mo single crystal. After the experimental results are described, we present a simple energetic model to check the feasibility of the hypothesis for the clear pop-ins under larger indenter radii, i.e., the activation of preexisting dislocations during the first displacement burst of large indenter radii. This model relates the load and the excursion length during the first displacement burst. The correspondence between the model and the data suggests that the model is a possible explanation for the mechanisms of displacement bursts at large indenter radii. Recent investigation by Morris et al.Reference Morris, Bei, Pharr and George19 provides some evidence of pop-in initiated at preexisting dislocations by presenting a statistical model, which can predict a distribution of pop-in strengths. Our model can estimate the extent of the first displacement burst from the pop-in strength. More precise theoretical and computational models are expected to emerge from the models mentioned above knowing the detailed structure of dislocations below an indenter tip.
II. EXPERIMENTAL
A (001) single crystal Mo (99.99%; Alfa Aesar Ward Hill, MA) was annealed at 1600 °C in vacuum (10−6 Torr) for 4 h. After annealing, the single crystal was mounted in epoxy, mechanically polished with SiC abrasive papers through 4000 grit and polished with a slurry of 0.05 μm alumina and then with a slurry of 0.02 μm colloidal silica using an automatic vibratory polishing machine. The sample was electropolished in a solution of 12.5% H2SO4 and 87.5% Ch3OH at a DC voltage of ∼10 V. Dislocation density of these materials is measured to be ∼1011/m2 by x-ray line broadening experiments and approximated to be 2.2 × 10¹¹/m2 by a theoretical modeling.Reference Morris, Bei, Pharr and George19
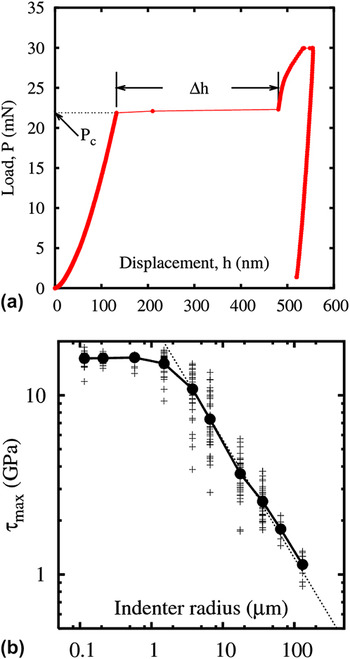
An electrochemically polished Mo (100) single crystal surface was indented by using a Nano Indenter XP system (MTS Nano Instruments, Oak Ridge, TN). Several spherical indenters are used: eight diamond indenters with radii of 0.115, 0.21, 0.58, 1.50, 3.75, 6.60, 17.5, and 36 μm and two sapphire indenters with radii of 64.4 and 130.3 μm. Nanoindentation tests were conducted in a load-controlled mode at a constant indentation strain rate,  = 0.05 s−1. A total of 36 indents were made for each indenter radius. Critical load P c and the excursion length Δh during a pop-in were extracted from each individual P–h curve as shown in Fig. 1(a).
(a) Typical P–h curve of a Mo (001) single crystal indented with R = 1.5 μm spherical indenter showing the displacement burst length Δh at the critical indentation load P c and (b) the calculated maximum shear stress for each spherical indenter radius. Circles denote the mean values of the individual data (plus symbols).

III. RESULTS AND DISCUSSION
A. Experimental observations
Figure 1(b) shows a log–log plot of the maximum resolved shear stress τmax for the pop-in load P c of each indenter tip radius R. According to standard Hertzian analysis,Reference Johnson20 τmax is related to R and P c by τmax = 0.31(6P cE *2/π3R 2)1/3, where E * is the reduced modulus given by  . Here, E s and E i are the Young’s moduli of the specimen and indenter, respectively; ν s and ν i are the Poisson’s ratios. The reduced modulus E * of Mo (100) for the diamond indenters is set to 274 GPaReference Bei, Gao, Shim, George and Pharr17 and 203 GPa for the sapphire indenters.Reference Oliver and Pharr1 All the measured data are plotted along with the mean values for τmax. Two separate regimes for τmax can be identified clearly in Fig. 1(b): regime I (R ≤ 1.50 μm) shows approximately a constant τmax irrespective of R, whereas regime II (R ≥ 3.75 μm) has a size-dependent τmax, which decreases with R while revealing a linear relationship (τmax ∼ R −0.66) in a log–log plot.
The measured τmax in regime I is ∼G/8 using the shear modulus G of Mo (∼126 GPaReference Simmons and Wang21). This is very close to the theoretical shear strength of Mo of 15 GPa computed from density functional theoryReference Ogata, Li, Hirosaki, Shibutani and Yip22 and therefore corresponding to the homogeneous dislocation nucleation in a Mo single crystal. Surface defects such as steps, oxide, or other surface layers can act as stress concentrators and contribute to a variation in the loads needed for nucleation, particularly for the smallest indenters. In our case, as the scatter in strengths for the three different small radii is small, we conclude that the electropolished surface behaves as if it is damage free and the effect of surface defects is negligible.
In regime II, pop-in stresses are lower than the theoretical strength and decrease with increasing the indenter radius. Note that the scatter in τmax is larger for regime II than for regime I in Fig. 1(b). The scatter is decreasing again for the largest radii where the maximum stress at pop-in is again well defined but much smaller than the smallest radii. Hence, Fig. 1(b) shows the full crossover from pop-in near the theoretical strength at small radii (deterministic), through a stochastic regime at larger radii, and into a deterministic regime for the largest radii. A similar trend has been reported in nanoidentation of Ni and Mo single crystalsReference Shim, Bei, George and Pharr7, Reference Morris, Bei, Pharr and George19 and in both experimentReference Bei, Shim, Pharr and George23, Reference Dimiduk, Uchic and Parthasarathy24 and simulationsReference Zhou, Biner and LeSar25, Reference Senger, Weygand, Gumbsch and Kraft26 of the uniaxial compression tests of metallic micropillars. The variety of observed stress–strain behaviors was related to the variability in the dislocation distribution for each pillar. The scatter in strengths is expected to be maximized as the size of the pillar approaches the average dislocation spacing. In summary, the scatter in strengths decreases with increasing pillar size for a fixed dislocation density and increasing dislocation density for a fixed pillar size. Thus, the relevant length scales are set by the dislocation density and indenter radius for nanoindentation or pillar size for microcompression tests.
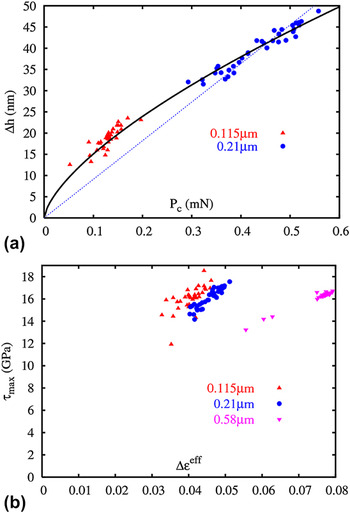
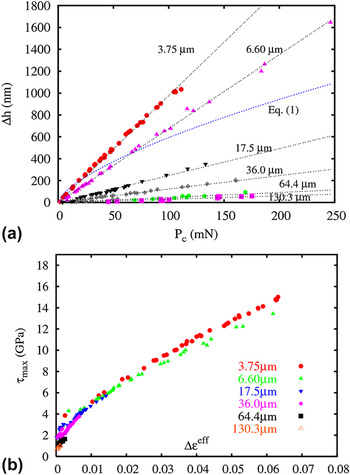
Although pop-ins are observed in both regime I and II, the aspects of the extracted P c–Δh relation are quite different Figure 2(a) shows the P c–Δh relation for the pop-ins for R = 0.115 and 0.21 μm, where the pop-ins are involved with nucleation of dislocations since τmax attains the theoretical strength. Figure 3(a) shows the P c–Δh relation for the pop-ins for R ≥ 3.75 μm. The magnitude of Δh spans a wide range from a few nanometers to a few micrometers for a given indenter radius. P c and Δh are however well correlated, i.e., a higher indentation load induces a larger displacement burst. P c and Δh for regime II are linearly correlated (Δh = γP c), which is not the case of the P c–Δh relation for regime I. Linear regressions are plotted as a dashed line in Figs. 2(a) and 3(a) to clarify the discrepancy in the P c–Δh relations for each regime.
For data in regime I: (a) P c–Δh relation in comparison with the theoretical model presented in Eq. (1) and (b) Δεeff–τmax relation.

For data in regime II: (a) P c–Δh relation and linear regressions and (b) Δεeff–τmax relation.

τmax is plotted versus the increase in an effective strain during a pop-in (Δεeff) in Figs. 2(b) and 3(b) for regime I and II, respectively. Δεeff is defined as 0.2Δa/R by utilizing an effective strain of 0.2a/R because indentation data for a spherical indenter were comparable with tensile data using an effective strain of 0.2a/R.Reference Johnson27 The increase in the contact radius during the pop-in (Δa) is expressed as a 2 − a 1, where a 1 is the contact radius at the onset of a pop-in and a 2 is the contact radius after a displacement burst. A contact radius is given by a 2 = Rh according to Hertzian theory.Reference Johnson20 Δa is determined as  . h 1 is the indenter displacement at the onset of a pop-in. The data shown in Fig. 2(b) for regime I reveal a radius effect in Δεeff during pop-ins, i.e., a larger indenter radius produces a more significant Δεeff at the relatively same τmax. For regime II, however, all data for different tip radii are found to lie approximately on a single curve as shown in Fig. 3(b); hence, each spherical indenter thus produces the same amount of Δεeff at the same τmax. A more rigorous expression for the contact radius using the geometry of the sphere,Reference Johnson20a 2 = 2Rh − h 2, also leads the same conclusion.
B. Modeling of displacement excursion
The experimental data of P c and Δh for small indenter radii are compared with the model proposed by Gerberich et al.Reference Gerberich, Mook, Chambers, Cordill, Perrey, Carter, Miller, Curtin, Mukherjee and Girshick15 The authors reported an energy balance criterion, which can model the displacement excursion for small indenter radii (homogeneous nucleation of dislocations). The authors considered that the external work provided by pushing the indenter is absorbed by plastic work, which is dissipated by the movement of nucleated dislocations, the surface energy, which is due to new surface creation, and stored elastic energy, which is arisen by nucleated dislocations. This energy balance criterion leads to Eq. (1) [Eq. (15) in Ref. Reference Gerberich, Mook, Chambers, Cordill, Perrey, Carter, Miller, Curtin, Mukherjee and Girshick15] for the displacement excursion:
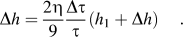
Here, h is related to P by the Hertzian elastic contact solution of a spherical tip of radius R with a flat surfaceReference Johnson20:
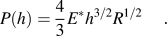
Equation (1) has the form of Δh ∼ P c2/3 and is plotted as a solid line in Fig. 2(a) by selecting η = 4 and Δτ/τ = 0.6–0.8. Equation (1) fits the P c–Δh data for regime I well.
P c and Δh for regime II are linearly correlated rather than Eq. (1) as shown in Fig. 3(a). The differences in the P c–Δh and τmax–Δεeff relations for each regime indicate that the microscopic mechanism involved for the pop-ins is different. We propose the following model to explain the linear P c–Δh relation for regime II by assuming that the total elastic energy stored during the initial elastic deformation induced by nanoindentation is exhausted by the activation and motion of preexisting dislocations.
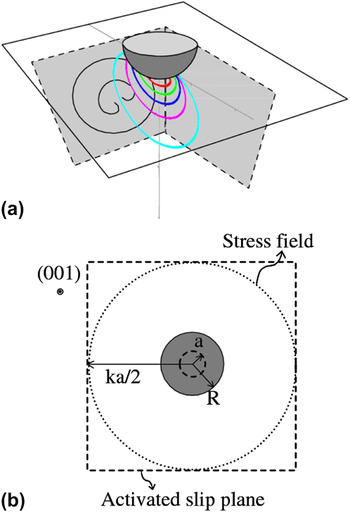
The indenter produces a stress field below the surface. When the stress field contacts a dislocation source randomly distributed inside a material, the source is activated and propagates on a certain slip plane, which produces displacement bursts until the externally applied work is dissipated by plastic deformation. The source activation under the indenter and propagation on an active slip plane is shown schematically in Fig. 4(a). Contours in Fig. 4(a) show the distribution of resolved shear stress given by the analytic solution of the stress field under a spherical indenter.Reference Bei, Lu and George28 The activation of dislocations ahead of an indenter and their slip toward a free surface has been experimentally observed by transmission electron microscopy (TEM) investigations in Fe–3 wt% Si single crystals.Reference Zielinski, Huang and Gerberich29 The activation of a single slip system has been found to induce a displacement burst on measured P–h curve from an in situ compression of Ni nanopillars.Reference Shan, Mishra, Syed Asif, Warren and Minor30
(a) Schematic of the activation and propagation of a dislocation source by the stress field (contours) beneath a spherical indenter and (b) top view of the indentation (001) surface. Dashed lines represent possible {110} slip planes.

The plastic work (W p) dissipated by the motion of the dislocations generated from the activated sources can be balanced with an external work (W ext) provided by the indenter as follows. The total elastic energy stored during the initial elastic loading can be calculated by integrating Eq. (2):
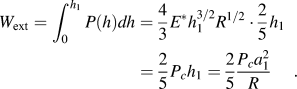
The plastic work W p absorbed by a group of mobile dislocations is the force per unit length of each dislocation multiplied by its length, its average traveled distance, and the number of dislocations. The product of the dislocation length with the average traveled distance corresponds to the area swept by moving dislocations and is thus proportional to the area of the active slip planes. It is assumed as a first-order approximation that {110} slip planes, which are at a distance (k/2)a from the indenter tip, are activated as shown in Fig. 4(b) and that the average shear stress exerted on the dislocations is  . The swept area is then proportional to α(ka)2, where α represents some fraction of the area swept by dislocations and the number of slip planes involved, e.g., by the cross slip of the screw components in activated dislocations, or by a concurrent activation of dislocation sources on different slip planes. The motion of dislocations must be able to accommodate the displacement of the tip. It has been suggested that the excursion length is related to the number of dislocations moved underneath an indenter tip.Reference Bahr, Kramer and Gerberich12 The number of dislocations is related to the displacement burst length Δh by N = βΔh/b, where β is the fraction of dislocations accommodating an indenter displacement and b is the magnitude of the Burgers vector. Hence, W p, which is (force per unit length) × (swept area) × (number of dislocations), can be calculated from Eq. (4):
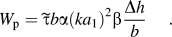
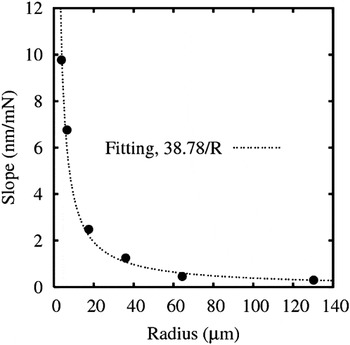
We obtain a linear relationship Δh = γP c by balancing W ext and W p in Eqs. (3) and (4). The slopes γ of P c–Δh relations are then inversely proportional to R, i.e.,  with
 . The slopes of the linear regressions of P c–Δh for each radius in Fig. 3(a) are found to fit well with A/R as shown in Fig. 5, and the coefficient A is 0.039 GPa−1. For a first-order approximation, it will be assumed that half of the total dislocations moved will participate in accommodating the displacement of the indenter tip (β = 0.5) and k = 10, α = 1–4. It is not unrealistic to assign k to be 10 because the contact radius is 1–2 μm at the average critical loads of displacement bursts and preexisting dislocations are estimated to show a typical separation of 3.2 μm. Then, the average shear stress
 exerted on dislocations during displacement bursts is 50–200 MPa. This value is on the same order of magnitude as the stress needed to activate existing dislocations in Mo single crystals. For example, tensile tests of Mo single crystals at various temperatures showed that the critical resolved shear stress is about 100 MPa at room temperature.Reference Guiu and Pratt31 The critical shear stress for dislocation nucleation is much higher and is estimated to be ∼4.6 GPa from microcompression tests of Mo alloy pillars.Reference Bei, Gao, Shim, George and Pharr17, Reference Bei, Shim, George, Miller, Herbert and Pharr32 Dislocation evolution during displacement bursts in regime II is therefore related to the activation of dislocation sources rather than dislocation nucleation.
Radius dependency of the slopes of the linear regressions of P c–Δh data for each spherical indenter radius in Fig. 3(a).

IV. CONCLUSIONS
Two different regimes exist in the incipient deformation of the contact surface by spherical indenters depending on the indenter radius; first, pop-ins due to dislocation nucleation and radius independent τmax (regime I) and, second, pop-ins due to the activation of preexisting dislocations and radius-dependent τmax (regime II). The pop-ins for regimes I and II are common in that the events correspond to the sudden multiplication of mobile dislocations, but the involved microscopic mechanisms are different.
A simple energetic model is proposed in this paper to rationalize the activation of randomly distributed dislocation sources by the stress field under the indenter in regime II. The operation of dislocation sources within the interior of a crystal have been experimentally observed during spherical indentations on (001) surfaces of LiF.Reference Swain and Lawn33 Dislocation arrays were observed by etch-pitting technique, which showed that dislocation sources operate initially on {110} planes. Considerable further study involving electron microscopy is required to elucidate the nucleation, geometry, and kinetics of dislocations induced by nanoindentation. However, some quantitative understanding of the mechanisms underlying the displacement bursts at larger indenter radii could be extracted from the simple model presented in this paper.