Introduction
The study of sea surface electromagnetic scattering characteristics is of great significance in radar detection, target recognition, ocean remote sensing, etc. It provides important theoretical support and guidance for inverting ocean parameters, improving radar performance, and optimizing target recognition algorithms.
However, the study of the interaction mechanism between the sea surface and electromagnetic waves is usually restricted by two aspects, nonlinear effects in complex sea state [Reference Zhang, Wu and Su1] and efficient electromagnetic scattering model [Reference Zhang, Wu and Su2].
The wave spectrum plays an important role in electromagnetic scattering from the sea. The wave spectrum model gives the distribution of sea surface energy with wavelength and wave direction. The Pierson–Moskowitz (PM) spectrum, proposed by Pierson and Moskowitz, contains both gravity waves and capillary waves [Reference Pierson and Moskowitz3]. However, it can only be used in the full developed sea surface. The JONSWAP (North Sea Wave Project) spectrum [Reference Hasselmann, Barnett, Bouws, Carlson, Cartwright, Enke, Ewing, Gienapp, Hasselmann and Kruseman4] modifies the gravity wave region of the PM spectrum, which can describe the full developed and undeveloped sea surface. Elfouhaily et al. proposed a joint spectral function that simultaneously modifies gravity waves and capillary waves [Reference Elfouhaily, Chapron, Katsaros and Vandemark5], and the slope distribution of the Elfouhaily spectrum is in good agreement with Cox and Munk measurements [Reference Cox and Munk6]. By introducing the Hilbert transform, Creamer proposed a weak nonlinear sea surface model [Reference Creamer, Henyey, Schult and Wright7]. Soriano [Reference Soriano, Joelson and Saillard8] extended the method to the two-dimensional nonlinear sea surface by using Taylor series expansion approximation.
Based on these wind-driven wave spectrum, the electromagnetic scattering models from wind-driven sea surface are established. By combining with the measured data, these scattering models can be further simplified to geophysical model function (GMF), such as CMOD and QSCAT correspond to C-band and Ku-band, respectively. CMOD and QSCAT play an important role in the spaceborne global sea surface wind field measurement system.
However, the traditional sea electromagnetic scattering model [Reference Wright9] based on the wind-driven wave spectrum cannot be directly applied to the sea surface current field measurement. Therefore, it is necessary to establish a new electromagnetic scattering model based on the air-sea boundary motion theory.
According to the “weak hydrodynamic interaction” theory, wave packets travelling follows the action balance equation [Reference Romeiser and Alpers10], in which the source function contains wave—wave interaction and wave—current interaction. The action spectrum can be obtained by using numerical integral method to solve the action balance equation. Based on the relationship between the action spectrum and the wave spectrum, the modified spatio-temporal variation wave spectrum can be obtained.
At the moderate incident angle and moderate wind speed, the scattering electromagnetic wave from the sea surface is mainly modulated by the Bragg wave in ocean waves. Based on this, the capillary wave modification facet scattering model (CWMFSM) is proposed [Reference Zhang, Chen and Yin11]. However, CWMFSM is based on the simple Bragg scattering theory only considering wind modulation. Many improved CWMFSMs, which take the modulation of internal wave [Reference Zhang, Wu and Su2] and surface current [Reference Su, Zhang, Dang and Tan12] into account, are proposed.
In this paper, the spatio-temporal variation wave spectrum is introduced to modify the scattering amplitude of every facet. Therefore, the total scattering electromagnetic wave is not only modulated by the wind-driven wave but also by currents and waves. Doppler spectra and SAR image are the most common tools to study the characteristics of sea surface motion in microwave remote sensing. Based on this paper model, Doppler spectra and SAR images of time-evolving deterministic sea surfaces are simulated to analyze the effects of sea surface motion and radar system parameters on remote-sensing products.
In this paper, a modified CWMFSM is used to investigate the electromagnetic scattering properties of the nonlinear sea surface with currents. This paper is organized in the following order. In the section “Methods”, a nonlinear 2-D Creamer II sea surface is generated, and the modulation of sea surface current on the wave spectrum is also presented in this part. The CWMFSM with nonlinear sea surface with currents is introduced. In the section “Results and discussions”, the statistical properties of the backscattering wave and Doppler characteristics for different polarizations from linear and nonlinear sea surface with and without currents are presented. The SAR images of the sea surface and the ATI SAR images of the sea surface with current are presented. Finally, conclusions are presented in the section “Conclusion”.
Methods
Wave spectrum modulated by sea surface currents
This section introduces the time-evolving deterministic Creamer-II nonlinear sea surface based on Elfouhaily spectrum. The Elfouhaily omnidirectional spectrum expresses as a sum of two spectrums

here Bl and Bh are long-wave curvature spectrum and short-wave curvature spectrum, respectively. The presentations of Bl and Bh are shown in [Reference Elfouhaily, Chapron, Katsaros and Vandemark5] in detail. The wave spectrum consists of an omnidirectional spectrum and a directional spectrum.

In this paper, we use a unilateral cosine direction spectrum proposed by Longuet-Higgins et al.,

where φ w is the wind direction angle,

The Elfouhaily spectrum describes the form of the wind-driven waves, but the actual ocean movement is much more complicated. The currents in spatial variation such as tidal currents and internal waves will modulate the wave spectrum and change the roughness of the sea surface, which is characterized by hydrodynamic modulation in SAR imaging.
According to the “weak hydrodynamic interaction” theory, wave packets travelling can be described by the action balance equation [Reference Romeiser and Alpers10]

here N denotes the action density of a surface wave packet. The source function Q describes the combined effect of wind input, wave–wave interaction, and dissipation. The action spectrum $N\lpar {\bi k}\comma \;{\bi x}\semicolon \;t\rpar$ and wave spectrum $W_{st}\lpar {\bi k}\comma \;{\bi x}\comma \;t\rpar$
 are as follows

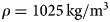
where $\omega _0 = \lpar gk + \tau k^3/\rho \rpar ^{1/2}\comma \;g = 9.81\,{\kern 1pt} {\rm m/}{\rm s}^2\comma \;\tau = 0.079\,{\rm N/m\comma } $ , $\rho = 1025\,{\rm kg/}{\rm m}^3$
 . In this paper, a numerical integration algorithm developed by Romeiser [Reference Romeiser and Alpers10] is used to calculate the action spectrum $N\lpar {\bi k}\comma \;{\bi x}\semicolon \;t\rpar$
 , which is obtained by tracing the trajectories from an interesting position. Then the new spatio-temporal variation wave spectrum $W_{st}\lpar {\bi k}\comma \;{\bi x}\comma \;t\rpar$
 can be obtained.
Model of the deterministic nonlinear sea surface
The fast Fourier transform (FFT) is used to generate time-evolving deterministic nonlinear sea surface. The spatial Fourier components of the surface at any time t is

$W\lpar k_{m_k}\comma \;k_{n_k}\rpar$ in (5) and W(k, φ) in (2) are the expressions of the wave spectrum in Cartesian coordinates and polar coordinates, respectively. ${\lcub }\gamma _n{\rm \rcub}$
 is a set of independent complex random numbers with a Gaussian probability density function and unit variance. L x and L y are the length of the sea surface. $\omega \lpar {\bi k}\rpar$
 is the dispersion relationship of seawater.

g is gravity acceleration, h is the depth of seawater, km equals 370 rad/m, ${\bi u}_c$ is the speed of the sea surface current. Then the linear sea surface profile is obtained by taking the inverse Fourier transform of (5)

Creamer introduced Hilbert transform to obtain nonlinear sea surface based on the linear sea surface. The Creamer nonlinear Fourier components are approximately as

The first order of this series $A_{NL}^{\lpar 1\rpar }$ identifies with F(k m, k n;t) in (5), then the second-order is given by

F D( ⋅ ) represents a two-dimensional Fourier transform. Therefore, a second-order Creamer nonlinear sea surface can be written as

Electromagnetic scattering model
This section describes CWMFSM, which is an improved TSM. According to the first-order small perturbation theory proposed by Fuks, the scattering field of an arbitrary tilted small patch can be expressed as

where $\hat{{\bi k}}_i$ and $\hat{{\bi k}}_s$
 are incident and scattering electromagnetic wave vectors, respectively (Fig. 1), SPQ is scattering amplitude matrix

here ${\bi q} = {\bi k}_s-{\bi k}_i\comma \;\tilde{{\bf {F}}}_{PQ}\comma \;$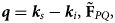 is scattering factor matrix and its expression is in [Reference Zhang, Chen and Yin11].
The coordinate system of electromagnetic scattering model CWMFSM.

The capillary wave component, which satisfies the Bragg resonance condition along the radar observation direction, dominates the intensity of scattering electromagnetic wave from the sea surface. In CWMFSM, this component can be considered a set of monochromatic cosine waves.

where ${\bi k}_c$ is sea surface Bragg wave number, ω c is angular frequency corresponding to wave number ${\bi k}_c$
 . Because of the introducing spatial surface current velocity, the dispersion relation of the model in (8) is different from that of the traditional CWMFSM [Reference Zhang, Chen and Yin11]. Furthermore, the amplitude of the cosine waves $B\lpar {\bi k}_c\comma \;{\bi \rho }_c\comma \;\;t\rpar$
 , which is also different from the traditional CWMFSM [Reference Zhang, Chen and Yin11], is spatio-temporal variable determined by the wave spectrum, thus

where the spatio-temporal wave spectrum $W_{st}\lpar {\bi k}\comma \;{\bi \rho }_c\comma \;\;t\rpar$ in (6), Δx and Δy are the facet length in x and y direction, respectively.
Therefore, the integration in (14) can be simplified into

J n is n-order Bessel function, and ΔS is the area of the small patch.

The two terms of ${\bi I}_0\lpar {\bi k}_c\rpar$ , respectively, represent the contribution of the Bragg wave propagating towards and away from the radar incident direction, respectively. Z x and Z y are the derivatives of the second-order Creamer nonlinear sea surface height $f_{NL}\lpar {\bi r}\comma \;t\rpar$
 in x and y direction, respectively, representing the contribution of wave–wave interaction to the scattering field.
The total scattering field can be obtained by summing scattering field in (13) corresponding to small facet in (12).

Doppler spectrum and SAR images
The Doppler spectrum of time-varying sea surface can be obtained by the following formula [Reference Toporkov and Brown13]

The detailed realization process of Doppler spectrum is as follows:
(1) Input a set of independent complex random numbers ${\rm \lcub}\gamma _n{\rm \rcub}$
 , and the nonlinear sea surface at a certain time t is generated according to the method described in the section “Methods–Model of the deterministic nonlinear sea surface”;
(2) The scattering field of each nonlinear sea surface is obtained by CWMFSM;
(3) Generate the nonlinear sea surface at the next time, and repeat step (2), until the time series of sea surface scattering field is obtained within the required integration time;
(4) The Doppler spectrum of each sea surface sample is obtained through the Doppler spectrum formula (20);
(5) Input another set of independent complex random numbers ${\rm \lcub }{\gamma }{\prime}_n{\rm \rcub }$
, repeat steps (1)–(4), then the Doppler spectrum under the required number of samples is obtained;(6) The Doppler spectrum of each sample is statistically averaged.


Since we obtained the scattering field for each discrete facet of the nonlinear sea surface, it is easy to simulate the ensemble averaged image intensity through the velocity bunching (VB) model proposed by Alpers [Reference Alpers, Duncan and Clifford14] in the following translation:

where σ I(x g, y g) = σ(x g, y g)(1 + f SAR(x g, y g)), denotes the backscattering coefficients (BSC) of the nonlinear sea surface that takes the hydrodynamic modulation and velocity bunching into account. f SAR(x g, y g) is the SAR modulation function. σ(x g, y g) is the NRCS based on this paper's proposed ocean scattering model. u r is the orbital velocity in the range direction. Further, f y(x − x g) is the range resolution function, ρ aN = N lρ a denotes the stationary target azimuth resolution for N l incoherent looks, ρ a = λR/2VT is the azimuth resolution, λ is the electromagnetic wavelength, V is the platform velocity, T is the synthetic aperture duration, and ${\rho }^{\prime}_{aN}$ is the degraded azimuth resolution due to the target acceleration and finite scene coherence time

where a r is the orbital acceleration in the range direction, and τ s is the scene coherence time.
Results and discussions
Backscattering coefficient
To validate the nonlinear sea surface model and the electromagnetic scattering model in this paper, the simulation results are compared with the experimental data. The measurement data from the results of the Joint Ocean Surface Study by the Naval Research Laboratory (NRL) is obtained from 4FR airborne radar, which worked in X-band (8910 MHz), C-band (4455 MHz), L-band (1228 MHz), and P-band (428 MHz). In this section, the measurement data are selected for the L-band and the wind speed is 5~6 and 5~7.5 m/s [Reference Daley, Ransone and Burkett15]. In the simulation, the linear and nonlinear sea surface with 31.27 m × 31.27 m are generated based on Elfouhaily spectrum, while the speed of wind is 10 m/s at 10 m above sea level. While temperature is assumed to be 20 °C, salinity is 35%, the permittivity of seawater is (71.332, 62.97) according to the double Debye model.
Figure 2 shows the backscattering coefficient for HH and VV polarization versus incident angles. The simulation results are calculated by using CWMFSM and averaging 100 sea surface samples. It can be seen that the backscattering field from the nonlinear sea surface has much more significant backward enhancement effect than that from the linear sea surface and is in good agreement with the experimental data. This is because the nonlinear sea surface considers wave–wave interactions to generate more large-slope facets, and the mirror reflection effect from these facets will significantly enhance the backscattering field.
Backscattering from linear and nonlinear sea surface: (a) HH; (b) VV.

Doppler spectrum
Figures 3–7 show the Doppler spectral characteristics of linear and nonlinear sea surface with and without currents. The linear and nonlinear sea surfaces are both based on Elfouhaily spectrum. The frequency of incident wave is 5.4 GHz at 45 °C incident angle. The speed of the current is assumed to be 2–5 m/s, and the direction of current is the same as the wind.
Doppler spectral characteristics of linear sea surface with and without currents: (a) linear sea surface HH polarization; (b) linear sea surface VV polarization.

Doppler spectral characteristics of linear sea surface with different currents: (a) linear sea surface HH polarization; (b) linear sea surface VV polarization.

Doppler spectral characteristics of linear sea surface with different frequencies: (a) linear sea surface HH polarization; (b) linear sea surface VV polarization.

Doppler spectral characteristics of nonlinear sea surface with and without currents: (a) nonlinear sea surface HH polarization; (b) nonlinear sea surface VV polarization.

Doppler spectral characteristics of linear and nonlinear sea surface with currents: (a) linear and nonlinear sea surface with current HH polarization; (b) linear and nonlinear sea surface with current VV polarization.

It can be seen from Figs 3(a) and 3(b) that the currents make the Doppler spectrum of the linear sea surface to broaden and shift. The currents with the same direction of wind cause the sea surface motion to intensify, and generate more harmonic components and make the Doppler spectrum broadened.
Doppler spectral characteristics of the linear sea surface with different currents are shown in Fig. 4. It can be seen from Fig. 4 that with the increase of current velocity, the Doppler spectrum is broadened, and the influence of current on Doppler spectrum is verified. Figure 5 shows the Doppler spectral characteristics of the linear sea surface with different frequencies, we can observe that with the increase of frequency, the spectrum width of Doppler spectrum broadens, and the center frequency shifts to the high frequency range.
The characteristics of Doppler spectrum of the nonlinear sea surface with and without currents are shown in Figs 6(a) and 6(b). It illustrates that currents have little effect on the backscattering Doppler spectrum. It may be that the Doppler spectrum broadening caused by nonlinear model considering interaction between waves is greater than that of sea currents.
Figure 7 shows the linear and nonlinear sea surface Doppler spectra with the same current velocity. The Doppler spectra of the nonlinear sea surface is wider than that of the linear sea surface. However, considering Fig. 6, this broadening effect may be caused by the wave–wave interaction of the nonlinear sea surface itself rather than wave–current interaction.
SAR images of nonlinear sea surface
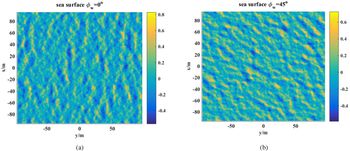
According to the CWMFSM method introduced in the section “Methods–Electromagnetic scattering model”, the spatial distribution of sea surface scattering coefficient can be obtained, and the imaging simulation results of sea surface SAR can be obtained by considering the time-varying imaging velocity bunching effect. In this section, nonlinear sea surface geometry profiles in different wind directions is simulated as shown in Fig. 8. The simulation parameters are: the sea surface size is 196 m × 196 m, sea surface interval is Δx = Δy = 0.75 m, sea surface wind speed is u 0 = 5 m/s.
Nonlinear sea surface geometry profiles (a) ϕ w = 0° (b) ϕ w = 45°.

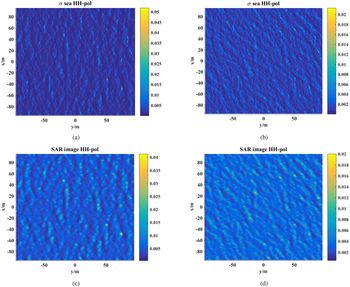
The simulation results of sea surface NRCS and sea surface SAR image under HH polarization are given in Fig. 9. The simulation parameters are: incident wave frequency is f = 13.9 GHz, incident angle is θ i = 45°, the correlation time of sea surface $\tau _s = 0.3\,{\rm s\comma \;}\;T{\rm} = 0.18\,{\rm s\comma \;}\;R/V = 50\comma \;\;N_l = 2$ . It can be seen from Fig. 8 that taking the velocity bunching effect of the SAR system into account, the change distribution of light and dark stripes can be clearly seen from the simulated SAR image, which shows the propagation characteristics of the sea wave along the wind direction. The azimuth resolution decreases due to the increase of defocus in the image plane.
NRCS distribution and SAR images of nonlinear sea surface under HH polarization (a) NRCS ϕ w = 0° (b) NRCS ϕ w = 45° (c) SAR image ϕ w = 0° (d) SAR image ϕ w = 45°.

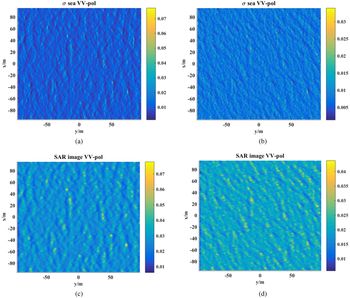
The simulation results for VV polarization is shown in Fig. 10. The other parameters in these two figures are the same. Because the VV polarization backscattering from sea surface is stronger than HH polarization, the texture features in VV polarization SAR image is more significant. Therefore the VV polarization SAR image shows more obviously the propagation characteristics of the sea wave.
NRCS distribution and SAR images of nonlinear sea surface under VV polarization (a) NRCS ϕ w = 0° (b) NRCS ϕ w = 45° (c) SAR image ϕ w = 0° (d) SAR image ϕ w = 45°.

The initial sea surface current velocity distribution is shown in Fig. 11. The wind speed is 10 m/s in the positive direction along the x-axis. The current direction is in the negative direction along the y-axis. The airborne radar platform velocity is 90 m/s at 3000 m height above the sea surface and the airborne radar platform is in the positive x-axis direction. The incidence angle of radar wave is 50°, the azimuth angle is 90°, the baseline along x-axis is 2.7 m and the frequency band is at L band (1.3 GHz). The calculation area is 5 km × 5 km, and the resolution is 50 m × 50 m.
The initial sea surface current field distribution.

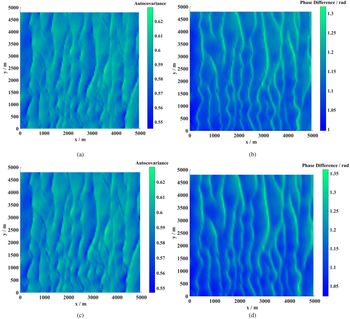
Figure 12 shows the correlation coefficient and interference phase distribution. It can be observed that the correlation coefficient of each resolution is greater than 0.5, and the interference phase difference has a change of at least 0.3 radian for both HH and VV polarizations, and that is to say, the correlation coefficient and interference phase difference can the fully illustrate the change of velocity given in Fig. 11.
Correlation coefficient and interference phase distribution (a) HH correlation coefficient (b) HH polarization interference phase difference (c) VV polarization correlation coefficient (d) VV polarization interference phase difference.

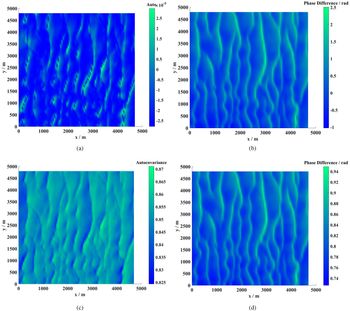
When the radar band and baseline remain the same, the flight direction of the airborne radar platform is in negative Y-axis direction and incident beam direction is in positive X-axis perpendicular to the direction of surface current. Since the wind speed, wind direction, incident angle, and radar frequency have not changed, Fig. 13(a) shows that all resolution still have high autocorrelation. The projection of the incident beam direction is perpendicular to the current direction, and the phase change is mainly caused by the wave motion driven by the wind. In the whole region, it is assumed that the wind speed is constant (10 m/s), thus the interference phase change range in Fig. 13(b) is small and negative.
The direction of the incident wave perpendicular to the direction surface current (a) VV polarization correlation coefficient distribution (b) VV polarization interference phase difference distribution.

The baseline length effects on correlation coefficient and interference phase are shown in Fig. 14. The radar system works in Ku-band (13.25 GHz), the other parameter is the same as that in Fig. 12. Electromagnetic backscattering from the sea surface is decorrelation in Fig. 14(a), and the interference phase difference is no longer related to sea surface motion in Fig. 14(b). When the baseline is as short as 0.17 m, the correlation reappears in Fig. 14(c), and the current field can be obtained from the interference phase difference in Fig. 14(d). From Fig. 5, a higher frequency corresponds to a wider Doppler spectrum, which means shorter decorrelation time. Therefore, when a higher frequency electromagnetic wave is used to detect the surface current, a shorter baseline should be set.
Baseline length effects on correlation coefficient and interference phase (a) Correlation coefficient for baseline 2.7 m (b) Interference phase difference distribution for baseline 2.7 m (c) Correlation coefficient for baseline 0.17 m (d) Interference phase difference distribution for baseline 0.17 m.

Conclusion
In this paper, a time-evolving deterministic sea surface model is established by introducing 2D Creamer-II nonlinear model and wave–current interaction model. The CWMFSM is modified by introducing the spatio-temporal wave spectrum so that it can calculate electromagnetic scattering from not only the wind-driven sea surface but also the nonlinear sea surface with surface currents. By comparing simulation results with experimental data, it is proved that the nonlinear models can more accurately describe the interaction between electromagnetic waves and the ocean. The wave-current and wave-wave nonlinear effect both make the Doppler spectrum broaden. When considering both of them, the effect of wave–current interaction on Doppler spectra is weaker than that of wave–wave interaction. Because nonlinear effect makes the small-scale capillary wave drift more intensely, and introduces more velocity components.
Based on the modified CWMFSM, the NRCS images and SAR images of the nonlinear sea surface are simulated. Considering the time-varying characteristics of the sea surface, the SAR image is defocused obviously in the azimuth direction. Because the texture features of SAR image for VV polarization is more significant, SAR image for VV polarization shows more obviously the propagation characteristics of the sea wave. The correlation coefficient images and interference phase images of along-track interference SAR are also simulated by using the modified CWMFSM. The simulation results indicate that the modified model can provide effective support for the design of sea surface currents field measurement system in future.
In future research, by combining the measured data, this scattering model should be further simplified into an efficient geophysical model function which can be applied in sea surface currents field measurement.
 Xiang Su received the B.S. degree in applied physics from Xidian University in 2009 and received his Ph.D. degree in radio physics from Xidian University, Xi'an, China, in 2016. He is currently an engineer with the China Academy of Space Technology, Xi'an Branch, China. His research interests include remote-sensing mechanism, retrieval, and high-performance computing for remote sensing.
 Xiaoxiao Zhang received her B.S. degree in electronic information science and technology from Xidian University in 2013 and received her Ph.D. degree in radio physics from Xidian University, Xi'an, China, in 2018. She is currently in Xi'an University of Post & Telecommunications, Xi'an, China. Her research interests include computational characteristic of the rough sea surface and the target.
Hongxing Dang is currently a Professor with the China Academy of Space Technology, Xi'an Branch, China. Her research interests include radar system design and SAR imaging algorithm.
Xiaomin Tan is currently a Professor with the China Academy of Space Technology, Xi'an Branch, China. His research interests include radar system design.