I. INTRODUCTION
Two-dimensional (2D) heterostructures consisting of alternating layers of graphene, BN, MoS2, etc. are attracting a great deal of interest for a number of applications. The graphene/hexagonal boron nitride (hBN) vertical heterostructure is of particular interest to achieve high electron mobility in substrate-supported graphene. Their structural similarities and contrasting electronic properties make graphene and boron nitride (BN) ideal for building electronic devices. Like graphene, BN forms a layered sp 2 phase with a weak out-of-plane bonding and a strong in-plane bonding with a honeycomb lattice. These structural similarities allow the formation of atomically abrupt and flat interfaces with a small (∼1.7%) lattice mismatch. In graphene, the purely covalent C–C sp 2 bonding results in a zero gap semimetal whose valence and conduction bands form a Dirac cone, which gives rise to graphene’s extremely high ambipolar mobility. On the other hand, the sp 2 B–N bond in BN is partially ionic, leading to a wide band gap (6 eV) insulator.Reference Michel and Verberk1 Because of these properties, the mobility and transistor performance of graphene/BN heterostructures exceed those of graphene on SiO2/Si.Reference Ishigami, Chen, Cullen, Fuhrer and Williams2–Reference Kim, Hsu, Park, Chae, Yun, Lee, Cho, Fang, Lee, Palacios, Dresselhaus, Kim, Lee and Kong5 Mobilities as high as 60,000 and 37,000 cm2/V s have been measured in graphene/BN produced by exfoliation and transfer, respectively.Reference Dean, Young, Meric, Lee, Wang, Sorgenfrei, Watanabe, Taniguchi, Kim and Shepard6,Reference Mayorov, Gorbachev, Morozov, Britnell, Jalil, Ponomarenko, Blake, Novoselov, Watanabe, Taniguchi and Geim7
Up until this point, most graphene/BN heterostructures have been fabricated by exfoliation of micron-sized flakes or by the transfer and stacking of graphene and BN films grown on metal substrates. While these are excellent methods for quickly developing test structures in a laboratory, they are not scalable device fabrication techniques. Development of a scalable method for the growth of graphene/BN would be a major milestone in the advancement of 2D electronics and devices. In recent years, there have been a number of reports on the growth of graphene on BNReference Yang, Chen, Shi, Liu, Zhang, Xie, Cheng, Wang, Yang, Shi, Watanabe, Tanigushi, Yao, Zhang and Zhang8–Reference Davies, Albar, Summerfield, Thomas, Cheng, Korolkov, Stapleton, Wrigley, Goodey, Mellor, Khlobystov, Watanabe, Taniguchi, Foxon, Eaves, Novikov and Beton12; however, these reports utilized either exfoliated or transferred BN. Mishra et al.Reference Mishra, Miseikis, Convertino, Gemmi, Piazza and Coletti13 and Tang et al.Reference Tang, Wang, Wang, Sun, Zhang, Cong, Xie, Liu, Zhuo, Huang, Chen, Yu, Ding, Xie and Jiang14 describe epitaxial growth of high quality graphene islands up to 20 µm in diameter on exfoliated hBN. This process of growing graphene on exfoliated hBN is not scalable and introduces contamination at the graphene/hBN interface. Overcoming some of these issues, Wang et al.Reference Wang, Jang, Jang, Kim, Park, Kim, Kahng, Choi, Ruoff, Song and Lee15 reported sequential growth of graphene/hBN by first growing hBN on Cu followed by graphene on hBN/Cu, demonstrating the ability to produce these heterostructures in an all chemical vapor deposition (CVD) process. More recently, Zuo et al.Reference Zuo, Xu, Zheng, Khanaki, Zheng and Liu16 have demonstrated the growth of hBN on graphene heterostructures by MBE on a Co film, and Zheng et al. recently presented their findings on the MBE growth of graphene using few-layer hBN flakes on Co. In their work, Zheng et al. show that graphene was unexpectedly growing underneath hBN, not on top as would be expected.Reference Zheng, Khanaki, Tian, He, Cui, Xu and Liu17 In contrast, another groupReference Davies, Albar, Summerfield, Thomas, Cheng, Korolkov, Stapleton, Wrigley, Goodey, Mellor, Khlobystov, Watanabe, Taniguchi, Foxon, Eaves, Novikov and Beton18 also recently published their findings in which they successfully grew graphene on hBN flakes using MBE. One clear difference between these two studies is the hBN flake thickness, with using flakes that were much thicker (10–100 nm)Reference Davies, Albar, Summerfield, Thomas, Cheng, Korolkov, Stapleton, Wrigley, Goodey, Mellor, Khlobystov, Watanabe, Taniguchi, Foxon, Eaves, Novikov and Beton18 than (few layer),Reference Zheng, Khanaki, Tian, He, Cui, Xu and Liu17 which suggests that graphene will only grow on hBN preferentially if it is sufficiently isolated from a metal substrate. Other different approaches to producing G/BN heterostructures have been co-segregation of graphene and BN from Ni-catalyzing filmsReference Zhang, Zhao, Jin, Koh, Zhou, Xu, Li, Xiong, Peng and Liu19 or a temperature-triggered chemical switch for growing vertical or in-plane heterostructures.Reference Gao, Song, Du, Nie, Chen, Ji, Sun, Yang, Zhang and Liu20
In this paper, we discuss the development of a pathway for the sequential, single-process CVD growth of graphene/hBN heterostructures on copper thin films. There has been very little study into single-process growth of graphene/hBN heterostructures using CVD. This is an important tool for producing 2D heterostructures as CVD can grow large-area, uniform films and is a popular growth technique in the electronics industry. Here, we present the surprising finding that, under the growth conditions presented, graphene forms under the hBN layer at the Cu surface even though it is deposited second, resulting in a hBN/graphene heterostructure instead of the anticipated graphene/hBN stacking.
II. EXPERIMENTAL DETAILS
This work was realized using a cold-walled CVD reactor with a close-coupled showerhead for the growth of graphene and hBN. The copper thin films (300 nm) used for the growth of graphene/hBN heterostructures were prepared on c-plane sapphire by sputtering. The resulting Cu film is (111) aligned with a few nanometers of roughness. Prior to growth, the Cu/sapphire substrates were degreased and then etched in acetic acid to remove the surface oxide. After cleaning and etching, the films were loaded into the reactor and annealed at 800 °C in H2 at a pressure of 20 torr. This was done to improve the surface of the Cu (larger grains, smoother surface) and remove any remaining copper oxide. The hBN layer was grown using separate B and N precursors: triethylborane (TEB) and ammonia (NH3), respectively, with H2 as the carrier gas. After Cu annealing, the reactor was held at 20 torr for the growth of the hBN films at 900 °C. Growth time was varied between 1 and 60 min, resulting in 1–3 layers of hBN.Reference Siegel, Ciobanu, Narayanan, Snure and Badescu21 After the growth of hBN, the TEB and NH3 gases were turned off and the system was prepped for graphene growth by switching to a primarily N2 atmosphere.
For this work, a range of process conditions were investigated for growth of graphene from methane (CH4) on a hBN/Cu. Growth pressure (20–500 torr), time (15–120 min), atmosphere (N2/H2 ratio), and hBN thickness were all investigated. For all growths, the CH4 flow rate was held constant at 4 sccm. Due to the limitations of the thin film Cu substrates, the temperature used to grow graphene was 900 °C. The H2/N2 ratio was varied between pure N2, pure H2, and N2/H2 ratios from 0.75 to 14.5 (N2 fixed at 290 sccm for these runs). The effect of hBN layer thickness was also studied by varying hBN growth time prior to graphene growth.
The resulting films were characterized using Raman spectroscopy (Renishaw Invia Reflex Raman Microscope, 488 nm laser, Andor EMCCD, Renishaw, Gloucestershire, UK), atomic force microscopy (AFM; Bruker Dimension FastScan in tapping mode, Bruker, Billerica, Massachusetts), X-ray photoelectron spectroscopy (XPS; PerkinElmer Phi 5500, PerkinElmer Inc., Waltham, Massachusetts), and transmission electron microscopy (TEM; JEOL JEM-2800 STEM, JEOL Ltd., Tokyo, Japan). Samples were prepared for TEM using an FEI Helios Nanolab 650 dual-beam FIB (FEI, Hillsboro, Oregon). EDS was acquired using dual SDD detectors for ultrafast data collection. Raman spectroscopy was used to identify the phase, evaluate quality, and estimate the thickness of graphene samples using a 100× objective, attenuated to <1 mW, and an 1800 L/mm grating centered at 2100 cm−1. AFM was used to find the nanoscale roughness and surface uniformity. XPS was implemented to determine whether there was any difference in the carbon bonding in various samples and was also used to measure the composition and ordering of the films. Samples were prepared for TEM analysis using a dual-beam FIB to cut-out a cross-sectional wedge. This allowed high resolution TEM measurements of exact film thicknesses and layering quality and also gave access to nanometer-scale chemical composition information.
III. RESULTS AND DISCUSSION
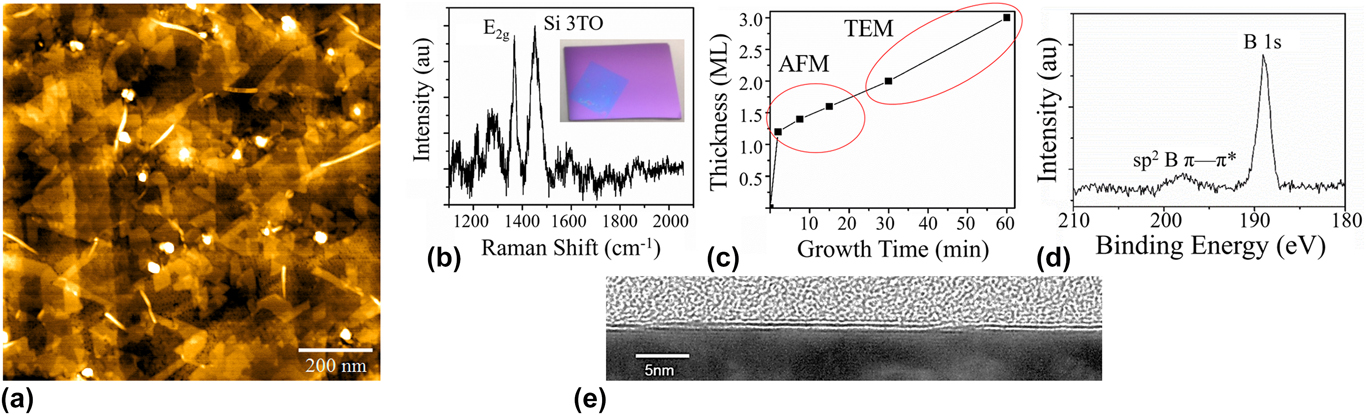
To investigate the growth of graphene/hBN heterostructures, we begin by building on our previous work, wherein we developed a well-controlled method for epitaxial growth of one to few layers of hBN on Cu/sapphire substrates.Reference Siegel, Ciobanu, Narayanan, Snure and Badescu21 In Fig. 1, a detailed characterization of these hBN films using an array of techniques such as Raman spectroscopy, XPS, AFM, and TEM is presented. Both Raman spectroscopy and XPS, used to determine phase and bonding, confirm that the BN is of high quality and purity, with no trace of unwanted oxides [Figs. 1(b) and 1(d)]. From XPS spectra, only one peak near the B 1s (189 eV) is observed, which is indicative of B–N bonding and not B–O or pure B (B–N = 189–190 eV, B–O = 191–193 eV, B = 186–187 eV).Reference Song, Lu, Sorokin, Jin, Ni, Kvashnin, Kvashnin, Lou, Yakobson and Ajayan22,Reference Moulder, Stickle, Sobol, Bombem and Chastain23 Raman spectra also show only a single peak at 1368 cm−1, which is characteristic of sp 2-bonded BN (E2g planar vibrational mode).Reference Gorbachev, Riaz, Nair, Jalil, Britnell, Belle, Hill, Novoselov, Watanabe, Taniguchi, Geim and Blake24 Typical AFM height images presented in Fig. 1(a) reveal some very interesting features. First off, we observe a moire pattern with hexagonal symmetry over a portion of the film. As previously described, this moire super structure between hBN and Cu(111) forms due to the incommensurate alignment where the periodicity depends on the rotational misalignment.Reference Siegel, Ciobanu, Narayanan, Snure and Badescu21,Reference Joshi, Ecija, Koitz, Iannuzzi, Seitsonen, Hutter, Sachdev, Vijayaraghavan, Bischoff, Seufert, Barth and Auwarter25 A periodicity between 12 and 8 nm is observed corresponding to a 0.5–1.5° angle between hBN and Cu(111). The same moire is not, however, observed in the second layer, which allows us to distinguish between mono and bi (or more) layers, giving us a way to estimate layer coverage for thickness <2 monolayers (ML). Films thicker than 2 ML could be measured only using TEM [Fig. 1(e)] as there is no easily discernable difference between the second, third, etc. layer of BN using AFM. Using the island geometry, we were able to estimate the orientation of the second layer hBN islands, where the zigzag edges all orient 0, 60, or 120° to Cu [110] indicating epitaxial alignment.Reference Liu, Song, Zhao, Huang, Ma, Zhang, Lou and Ajayan26 From these AFM and TEM data, we found that the first layer of BN grows in approximately one minute as its growth is catalyzed by the Cu substrate. For more than two layers, the Cu catalytic effect is greatly reduced (screened by the first layer of BN resulting in the surface becoming inert), which results in the much slower, linear growth rate seen in Fig. 1(c) of approximately two layers per hour. Accordingly, this would imply that growth of graphene on top of >1 ML of hBN/Cu would act similar to growth on an inert substrate like sapphire, which requires growth temperature much higher than the 900 °C limit of the substrates.Reference Hwang, Kim, Campbell, Alsalman, Kwak, Shivaraman, Woll, Shigh, Hennig, Corantla, Rummeli and Spencer27,Reference Oliveira, Schumann, Garallo-Caballero, Fromm, Seyller, Ramsteiner, Trampert, Geelhaar, Lopes and Riechert28
(a) AFM image showing partially bilayer hBN grown on copper. (b) Raman spectrograph of a transferred hBN film. (c) Plot of growth rate showing rapid first layer formation and a steady 2 ML/h thereafter. (d) XPS of the B 1s spectra showing only a peak at ∼189 cm−1 (B–N bond). (e) TEM cross section of bilayer hBN on copper.

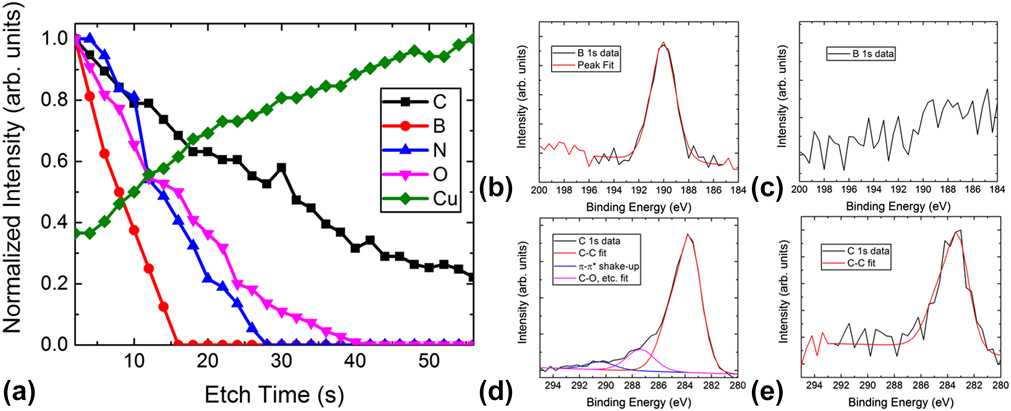
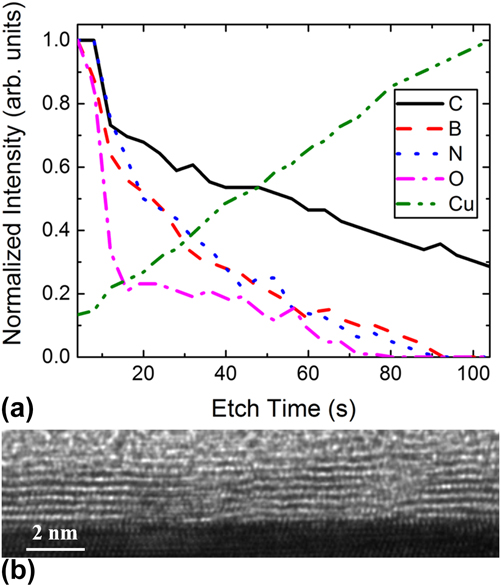
Subsequent graphene growth on hBN/Cu (111)/sapphire shows the formation of graphene/hBN heterostructures even at 900 °C. However, unexpectedly we find that graphene forms between hBN and Cu instead of on the hBN surface, which is consistent with reports by Zheng et al.Reference Zheng, Khanaki, Tian, He, Cui, Xu and Liu17 As previously reported, XPS is a powerful tool to determine the thickness of ultra-thin layers by using intensity ratios of the films and substrate.Reference Zemlyanov, Jespersen, Zakharov, Hu, Paul, Kumar, Pacley, Glavin, Saenz, Smith, Fisher and Voevodin29 However, using this method, we are not able to determine the order of graphene and hBN in the stack. Instead we use a destructive etch profile and monitor C, B, and N intensities as a function of etch time. In Fig. 2(a) we observe a reduction in C, B, and N intensity and an increase in Cu intensity with each etch step, thereby revealing that the graphene film does not grow on hBN, but instead grows adjacent to the Cu. This is clearly observed from the loss of the B and N occurring well before the loss of the C signal. If the hBN film was under graphene, then the signal of the B and N peaks would increase with initial etching, much the same as the Cu peak is seen to do. XPS scans from the B 1s and C 1s initial [Figs. 2(b) and 2(d)] and final etches [Figs. 2(c) and 2(e)] show how the peaks change during the etching process. It is worth noting that the O peak exists only on the surface of the sample and is fully removed after the etching. The O signal corresponds very well with the “C–O” bonding peak observed in the C 1s spectrum pre-etch [Fig. 2(d)]. This suggests that the O present is from physisorbed organic materials on the sample’s surface and is not a part of the hBN or graphene films. This is further confirmed from the pre-etch B 1s spectra [Fig. 2(b)] showing only a single peak at ∼190 eV, which indicates only “B–N” bonding.
(a) XPS etch profile of the BN/graphene films grown on copper. (b) Initial B 1s peak. (c) Post-etch B 1s showing no peak. (d) Initial C 1s peak showing C–C (graphene) as well as C–O bonding (physisorbed carbon on surface) (e) Post-etch C 1s showing only C–C bonding (graphene).

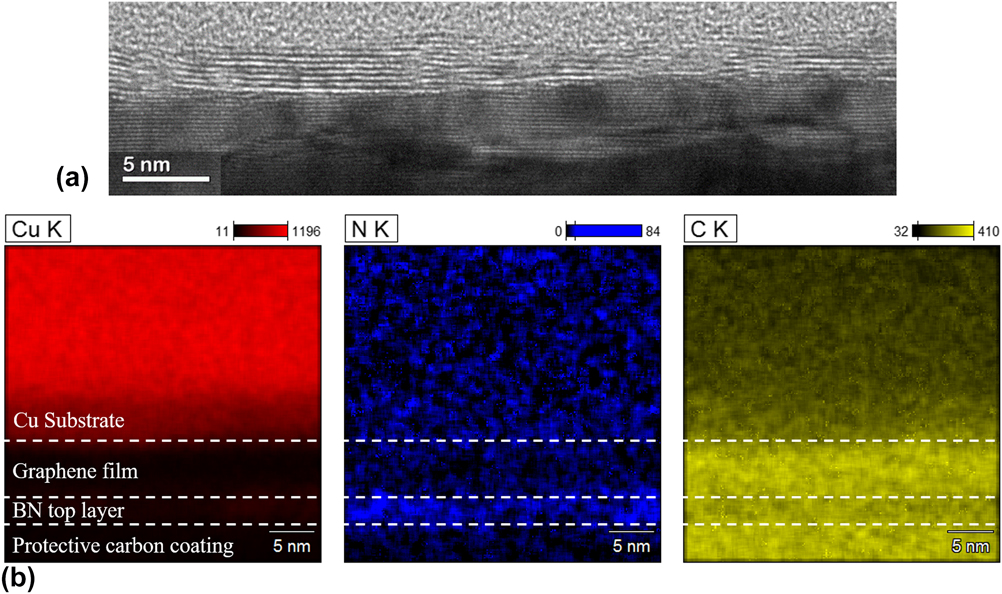
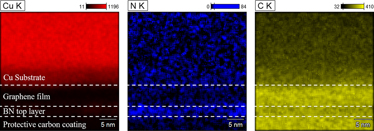
Figure 3(a) shows TEM from a similar sample to that presented in Fig. 2(e) of a graphene/hBN cross section, revealing a layered structure between 6 and 8 layers thick. Due to the small difference in the lattice spacing between graphene and hBN, it is not readily apparently from the TEM images where the graphene and hBN layers are. Using EDS collected using a dual-detector setup within the TEM [Fig. 3(b)], we are able to image the Cu, C, and N distribution in this cross section. Looking at the N, we observe a very weak region just below the Cu substrate with an intensity similar to or even weaker than in the Cu film. As we scan farther from the Cu surface, a small region of high-intensity N is observed. Comparatively, the C signal is quite strong just below the Cu layer followed by a region of lower intensity. This observation of a strong (weak) C (N) signal near the Cu surface followed by a strong (weak) N (C) signal a few nanometers away from the surface supports the XPS data [Fig. 2(a)] suggesting that graphene is growing below hBN even though it was grown second.
(a) High-resolution TEM image of the BN/graphene film showing 6–8 layers of growth. (b) EDS maps of the BN/graphene film (orientation is flipped vertically) from the same TEM, which shows that graphene has grown between BN and the copper substrate. Dashed lines added to help easily distinguish the layers.

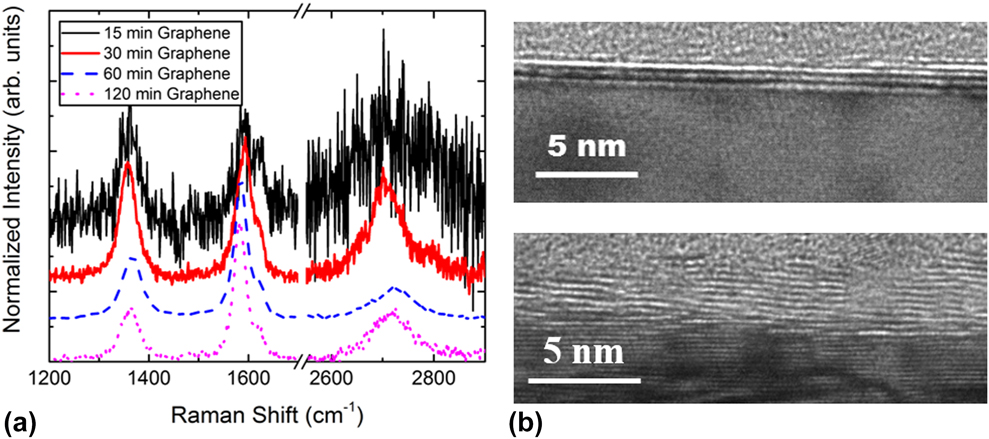
In order for graphene to grow underneath a continuous hBN layer, C must diffuse through to the Cu surface, which may occur through a number of pathways (defects, grain boundaries, interstitially). To explore this type of graphene growth, we started by examining the effects of graphene growth time. Growth times of 15, 30, 60, and 120 min were tested (CH4 flow = 4 sccm, pressure = 200 torr, H2 = 200 sccm, H2/N2 = 1). Figure 4 shows the Raman spectra and TEM of the hBN/graphene heterostructures at various graphene growth times with a fixed hBN growth time (15 min, approximately 1–2 layers). From the Raman spectra [Fig. 4(a)], it was found that at the shortest growth time (15 min) there was negligible growth of graphene. After 30 min of growth, the surface coverage of graphene increased, and by 120 min we achieved full coverage. Figure 4(b) shows TEM cross sections of the 30 (top) and 120 min (bottom) graphene growth samples. Based on Raman analysis and TEM cross sections, it was determined that the 30 min sample had ∼4 layers of graphene and the 60 min sample (not pictured) had ∼8 layers. As such, the growth rate during the first hour was approximately 8 ML/h. We also found that when the growth time was increased from 60 to 120 min, the surface coverage of graphene also increased, with full surface coverage being achieved after 120 min. This was confirmed using electrical conductivity testing, with only the samples grown for 120 min able to pass current. However, the trend of increasing thickness of graphene with growth time was no longer seen. In fact, as the growth time was extended from 60 to 120 min, we saw no increase in the thickness of graphene [Fig. 4(b), bottom], suggesting C can no longer reach the Cu surface. However, from the Raman spectra, it was observed that the quality of graphene, based on graphene’s relative intensities of the G and D peaks (G/D), improved with time over the entire range of 15–120 min. This suggests that the lateral growth continues, well after vertical growth has stopped, thus increasing grain size.
(a) Raman spectra of hBN/graphene films grown for various time lengths. D, G, D′, and G′ peaks are labeled. (b) TEM images of 30 min (top) and 120 min (bottom) growths showing approximately 3–4 and 6–8 layers of graphene, respectively. Both samples have hBN thicknesses of ∼1.5 layers.

Because graphene is growing underneath the hBN film, adjacent to copper, we were interested in seeing the effect that thicker hBN films would have on the subsequent graphene films. All of the growths previously mentioned in this work utilized 1–2 ML of hBN. So to this end, we grew an hBN film that was 3 ML thick on our Cu substrate before repeating the graphene growth steps listed above (200 torr, 200 sccm H2, 120 min growth). The film was characterized using the same cross-sectional TEM and XPS as described earlier. The results from these tests are shown in Fig. 5. It is clear from the XPS data [Fig. 5(a)] that hBN is approximately three times thicker than before, as its signal persists approximately three times longer than in our original sample, confirming that we do still see graphene growing underneath hBN even when the film is a few layers thick. Furthermore, from the TEM analysis [Fig. 5(b)], it is seen that the total thickness of our hBN/graphene film is ∼10 layers, which suggests that the graphene growth rate is unaffected (3 layers hBN, ∼7 layers graphene) by the thicker hBN top layer. That said, there is likely a critical thickness of hBN that would affect the growth rate of the underlayer graphene and cause a transition for it to grow on top of hBN. While it is still unknown exactly when this transition occurs, previous reports have identified that for 10-nm-thick hBN films, the growth occurs on top of hBN.Reference Davies, Albar, Summerfield, Thomas, Cheng, Korolkov, Stapleton, Wrigley, Goodey, Mellor, Khlobystov, Watanabe, Taniguchi, Foxon, Eaves, Novikov and Beton18
(a) XPS etch profile of the hBN/graphene film with thicker (3 layers) BN and 120 min of graphene growth. (b) High-resolution TEM image of the cross section of the said film, showing 8–10 layers of hBN/graphene, which is ∼2 layers thicker than the sample found in Fig. 3(b) (bottom) as expected.

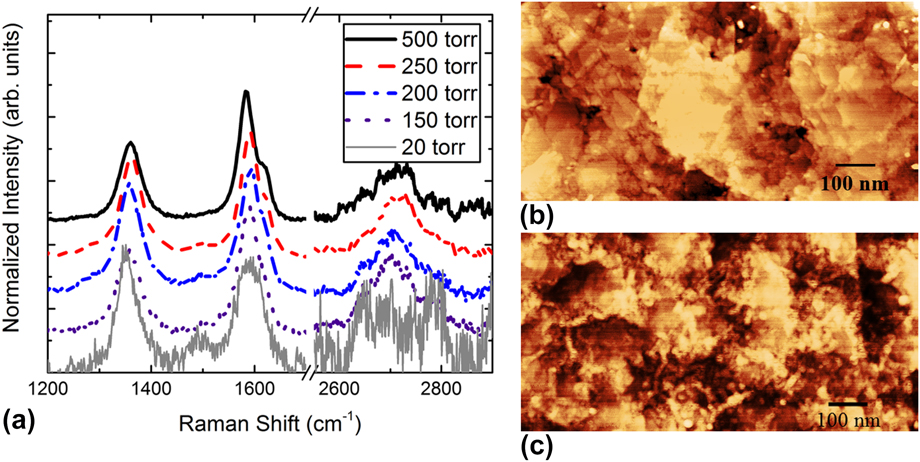
To further explore the growth of graphene under hBN, we examined the effect of pressure. A series of graphene films were grown at pressures of 20, 150, 200, 250, and 500 torr. Each of these films had fixed growth times (30 min) and N2/H2 ratios (∼0.6, 110 sccm H2). The Raman and AFM images of these samples are found in Fig. 6. It is observed from Fig. 6(a) that at 20 torr only a weak graphene Raman signal was measured. Increasing the pressure to 150 torr, the characteristic Raman spectrum becomes distinct indicating the clear formation of few layer graphene films. AFM taken from the 200 torr sample is seen in Fig. 6(b), which has an RMS surface roughness of ∼1 nm with a relatively smooth surface [compare to Fig. 1(a)] indicating a thicker film covering the Cu substrate. From 150 to 250 torr, the quality of the films stays approximately constant while the surface coverage is improved. It is worth noting here that while the quality of these graphene films was uniform, the quality itself was rather poor, with G/D ratios barely above 1. This trend did not continue as the pressure was increased above 250 torr. Above this pressure, the surface of the films began to look less like a smooth 2D growth and instead had a high number of visible 3D features (ridges, ripples, etc.) [Fig. 6(c)].
(a) Raman spectra for the hBN/graphene films grown at various pressures. (b) AFM of a film grown at 20 torr showing very little signs of graphene growth. (c) AFM of a film grown at 500 torr showing a high roughness due to three-dimensional structures on the surface.

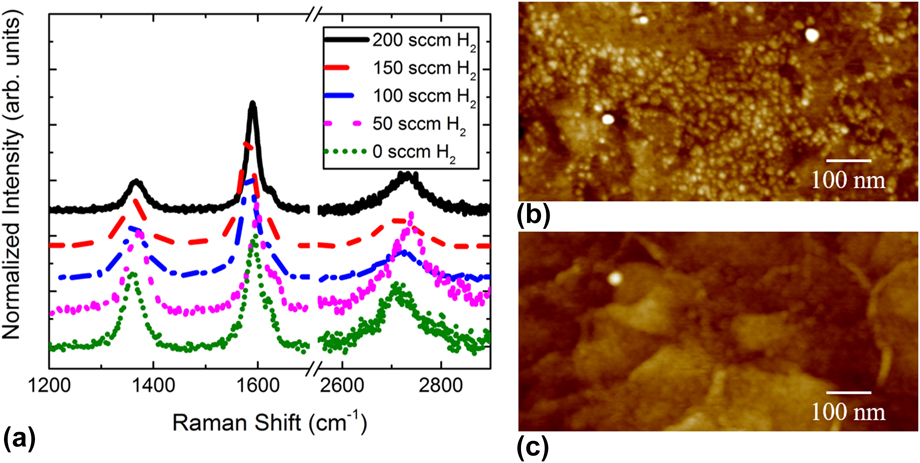
During the CVD growth of graphene, H2 is known to have a significant impact. High H2 concentrations can act to etch C, which can remove amorphous C that may contribute to defects. Therefore, the effects of H2 concentration were investigated as a way to improve graphene quality. A series of samples were grown under N2/H2 ratios from 0.75 to 14.5 and under pure N2 or H2. The Raman spectra from these samples are shown in Fig. 7(a). In pure N2 or at high N2/H2 ratios, the resulting graphene was of a rather poor quality. This is observable in the Raman spectra as a low G/D ratio (∼1) as well as in the AFM imaging [Fig. 7(b)], showing that the surface is covered with 3D particles. Conversely, if the amount of H2 is too high (N2/H2 > 1.5), the growth rate was greatly reduced where H2 etching began to compete with the growth. When the H2/N2 ratio is increased to >1, we no longer observe the graphene signal in Raman (not pictured). Between these two extremes, however, there was a clear, monotonic increase in the quality of graphene as the N2/H2 ratio is increased, peaking at around 1.5 [Fig. 7(c)]. Interestingly, it was found that the growth rate of graphene increased with an increasing H2 concentration within this window of flow rates.
(a) Raman spectra for the hBN/graphene films grown with various flow rates of H2. (b) AFM image of a film grown with no hydrogen present exhibiting a surface cluttered with particles. (c) AFM image of a film grown with 200 sccm of hydrogen showing a much smoother, uniform surface.

To better understand the effects of these process parameters on graphene crystallinity, we use Raman analysis to approximate the grain size. There are two general models that can be used to approximate the grain size. The first is based on the full-width at half-maximum of the peaks (Γ) and follows this equation:
 $$\Gamma = A + {B \over {{L_{\rm{a}}}}}\quad ,$$
where Γ is the full-width at half-maximum, A and B are constants whose values depend on which peak is being fitted (G, D, etc.), and L a is the average grain size. The values of A and B used for each peak were those mentioned in Ref. Reference Oliveira, Schumann, Garallo-Caballero, Fromm, Seyller, Ramsteiner, Trampert, Geelhaar, Lopes and Riechert28.
The second model uses peak intensities for its approximation. Specifically, it relates the relative intensity of the G peak to the selected peak following this equation:
 $${L_{\rm{a}}} = {C \over {E_{\rm{l}}^4}}{\left( {{I \over {{I_{\rm{G}}}}}} \right)^{ - 1}}\quad ,$$
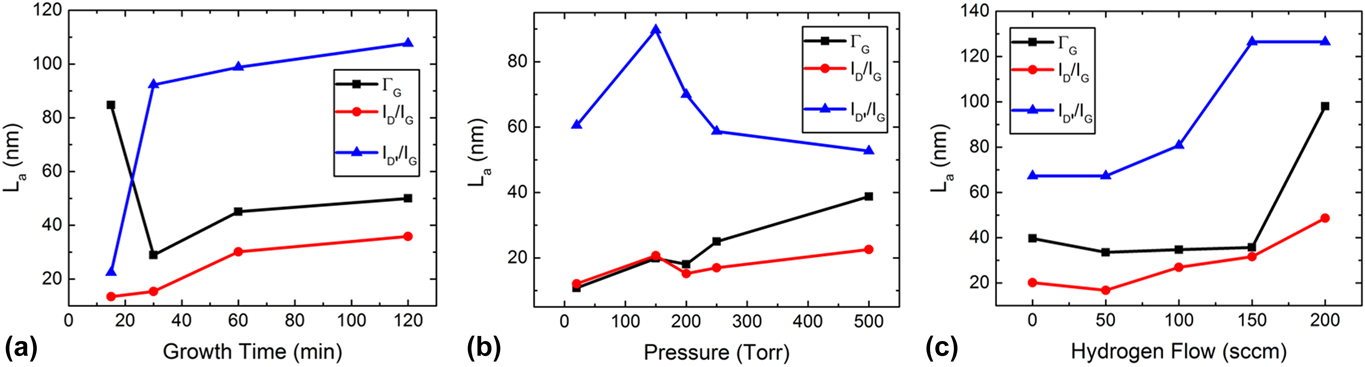
where C is a constant whose value depends on which peak is being fitted, E l is the laser energy in eV, I is the intensity of the peak being fitted, and I G is the intensity of the G peak. We compare both models as neither is an exact measurement. The calculated grain size based on each model can be seen in Fig. 8. It can be seen that both models generally find that graphene has grain sizes in the range of 15–40 nm. The one exception to this is I D′/I G, which estimates a much larger grain size when compared with the other methods. This is because the model simplistically correlates this defect peak (D′) intensity to its grain size, but in reality the peak is generated by various defects that are independent of the grain size resulting in it not being a good fit for this model. Figure 8(a) shows L a for samples with increasing graphene growth times. We find that the calculated L a increases with growth time using ΓG, I D/I G, and I D′/I G with the maximum grain size of 50 to 40 nm (excluding I D′/I G) reached after 120 min of growth. From Fig. 8(b), it is also observed that grain size increases with pressure. And finally, in Fig. 8(c) we see an interesting trend with respect to the amount of H2 present during growth. It seems that until a critical amount of hydrogen is present, there is very little effect on the grain size. But once reached, the grains are suddenly able to grow much larger. We expect that this is due to the preferential etching effect that was described in the earlier section. Overall, it is seen that the presence of H2 has the strongest effect on grain size, with grains increasing by 30–50 nm over the range. Growth time and pressure had comparatively weak effects, increasing the grain size only by 20–30 nm over their ranges. Furthermore, a plateau effect is seen in both growth time and pressure where the rate of increase in grain size slows midway through the tested ranges. This is not seen in the H2 flow tests where there is a strong increasing trend in grain size at the higher H2 flow rates.

IV. CONCLUSION
In this study, we found that a single-process CVD growth of hBN/graphene on Cu thin films is a viable pathway for producing large-area heterostructures. Of particular interest was the discovery that although grown second, using our growth conditions graphene preferentially grows underneath the hBN layers instead of on top as would be expected. This phenomenon was confirmed using XPS and TEM/EDS cross sections, which could resolve the locations of graphene and hBN. AFM, TEM, Raman spectroscopy, and XPS were all used to qualify and quantify the thickness, film quality and grain size, and stacking order of the films. This work was a good first step in understanding the growth parameters for the single-process CVD growth of hBN/graphene heterostructures, especially in identifying the major role H2 plays during growth on both quality and grain size of resulting graphene.
ACKNOWLEDGMENTS
This work was funded by the Air Force Office of Scientific Research under award number FA9550-16RYCOR331. The TEM sample preparation, ultrafast EDS, and imaging were performed by the Surface Analysis and Nano-Scale Imaging Laboratory at the Utah Nanofab (University of Utah).