Introduction
Frozen embryo transfer (FET) has become in the last 3 decades a widely used procedure for female infertility patients (Roque et al., Reference Roque, Valle, Sampaio and Geber2018; Trounson and Mohr, Reference Trounson and Mohr1983). FET is considered comparable and even better than fresh embryo transfer for live birth outcomes (Coates et al., Reference Coates, Kung, Mounts, Hesla, Bankowski, Barbieri, Ata, Cohen and Munné2017; Wei et al., Reference Wei, Liu, Sun, Shi, Zhang, Liu, Tan, Liang, Cao, Wang, Qin, Zhao, Zhou, Ren, Hao, Ling, Zhao, Zhang and Qi2019). Specifically, FET can increase oocyte retrieval by storing additional viable embryos that can reduce risks, including ovarian hyperstimulation syndrome and multiple pregnancy risks (Tiitinen et al., Reference Tiitinen, Halttunen, Härkki, Vuoristo and Hyden-Granskog2001; Shi et al., Reference Shi, Sun, Hao, Zhang, Wei, Zhang, Zhu, Deng, Qi, Li, Ma, Ren, Wang, Zhang, Wang, Liu, Wu, Wang and Bai2018). FET is highly prevalent in China because this procedure is cost effective, less invasive than fresh embryo transfer, and may improve the cumulative pregnancy rate (Ghobara and Vandekerckhove, Reference Ghobara and Vandekerckhove2008). Techniques for FET, including embryo freezing and thawing technology, are mature and easily accessible; however the clinical pregnancy rate fluctuates between 30% and 60% and has failed to improve significantly (Reed et al., Reference Reed, Said, Thompson and Caperton2015). The predictors for the final live rate of women with FET are unclear. Therefore, its research direction has recently shifted towards identifying relevant factors for FET outcomes. Previous studies have demonstrated various factors for FET outcomes, including female age, body mass index (BMI), infertility duration, infertility aetiology, caesarean section, and endometrial preparation regimen for FET (Veleva et al., Reference Veleva, Orava, Nuojua-Huttunen, Tapanainen and Martikainen2013). However, a comprehensive study that assesses these factors and generates a cost-effective way of evaluating the probability of live birth is lacking, and existing studies have typically focused on the clinical or biochemical pregnancy of these factors. Taken together, early screening of women with the risk of live birth failure (LBF) is important.
Machine learning, a computer algorithm that learns from prior experience, has been commonly used in various disease fields to screen potential populations because of its superior performance over traditional statistical modelling approaches (Beam and Kohane, Reference Beam and Kohane2018; Chen and Asch, Reference Chen and Asch2017; Booth et al., Reference Booth, Williams, Luis, Cardoso, Ashkan and Shuaib2020; Radhakrishnan et al., Reference Radhakrishnan, Damodaran, Soylemezoglu, Uhler and Shivashankar2017). Specifically, machine learning models based on the least absolute shrinkage and selection operator (Lasso) regression algorithm have been widely applied to various diseases (Huang et al., Reference Huang, Liang, He, Tian, Liang, Chen, Ma and Liu2016). However, studies that have used the Lasso algorithm to screen the relevant risk factors for LBF in women with FET are limited. Therefore, the present study aimed to evaluate comprehensively potential factors for LBF in women who had accepted FET. Moreover, a nomogram risk model was established to provide information for clinical decisions and consultations.
Materials and methods
Patients
In total, 6104 Chinese female patients accepted the first FET at our hospital between September 2010 and September 2020. The ethics committee of The Affiliated Hospital of Wenzhou Medical University approved all the procedures performed in this study. We collected information on 44 features, including male partner age, female age, infertility duration, and BMI, for all the female participants. Only women with comprehensive information and FET outcome were enrolled, and these participants were divided randomly into training and validation cohorts. A high-quality embryo was defined as having four or five cells and 20% fragmentation if cultured for 2 days or a minimum of eight cells and 20% fragmentation if cultured for 3 days (Van Royen et al., Reference Van Royen, Mangelschots, De Neubourg, Valkenburg, Van de Meerssche, Ryckaert, Eestermans and Gerris1999). Informed patient consent was unnecessary because results are shown based on retrospective records.
FET was performed with either a hormone replacement cycle or a natural cycle protocol. The choice of endometrial preparation protocol depended on the physician or centre preference and the patient’s characteristics. Hormone replacement therapy for endometrial preparation began with oral estradiol valerate (Progynova, Schering Pharmaceutical Ltd, Guangzhou, China), followed by a transvaginal ultrasound scan on cycle days 2–5 at a dose of 4 mg/day for 4 days; the dose was then increased to 6 mg/day for 5 days. A second ultrasound scan with serum estradiol and progesterone examinations was then performed, and the estradiol valerate was increased to 8 mg/day. Luteal support was initiated when the endometrial thickness reached at least 8 mm, serum estradiol level was 600 pmol/l, and the progesterone level was <5 nmol/l. Progestin (Utrogestan; Besins Manufacturing, Brussels, Belgium) was administered vaginally at 40 mg/day for 3 or 5 days before embryo transfer, and progestin supplementation continued until pregnancy was confirmed at 10 weeks of pregnancy. The timing of FET in terms of a natural cycle was based on either monitoring the naturally occurring peak of the luteinizing hormone (LH) or performing frequent ultrasound scans and measuring the size of the growing follicle.
Women with the following criteria were enrolled in the present study: women with regular menses who accepted first FET, and infertility duration of more than 1 year. In contrast, women were excluded if they had a history of unilateral oophorectomy, recurrent spontaneous abortion, diagnosis of polycystic ovary syndrome, uterine abnormality, or other chronic medical conditions associated with adverse pregnancy outcomes.
Lasso regression algorithm
Lasso regression feature selection is an unbiased estimation used to process high-dimensional complex collinearity data. A penalty function to select the main variables with a strong correlation with the output parameters from the input variables and build a refined regression model is the basic idea for the Lasso method (Sauerbrei et al., Reference Sauerbrei, Royston and Binder2007). Lasso feature selection compresses the model coefficients by increasing the penalty coefficient λ. When the absolute value of the regression coefficient Lasso estimate in the model is less than the absolute value of the minimum regression coefficient, some of the coefficients of the variables not strongly correlated are compressed to 0, and the variables corresponding to the coefficients with the estimated value of 0 are eliminated. In this way, the independent variables strongly related to the dependent variable are screened to achieve the purpose of feature selection.
Construction and validation of the nomogram
We initially used Lasso regression for selecting variables based on the training cohort, followed by multiple logistic regression analysis for the prediction of live birth. Only variables filtered by Lasso and identified as independent predictors via multiple regression analysis remained. Finally, an integrative nomogram was generated with these features. The discrimination performance nomogram was evaluated by receiver operating characteristic (ROC) curve analysis, and the area under the ROC curve (AUC), sensitivity, and specificity were represented. Two criteria, the concordance index (C-index) and the calibration curve, were used to validate the prediction model in the selected factor sets. For the C-index, a value range between 0 and 1, was used to assess the performance of the model. The larger the C-index, the better the performance of the model. Calibration curves close to ideal ones were thought to have the accurate predictive ability of this nomogram. Furthermore, we performed decision curve analysis (DCA) to visualize the net benefit for clinical decisions. In addition, the predictive capability of the nomogram was verified on the validation dataset.
Statistical analysis
The continuous variables were analyzed by mean ± standard deviation, and normality was tested using the Shapiro–Wilk method. A one-way analysis of variance was used to compare the differences between the factors. A test P-value < 0.05 indicated a statistically significant difference. The Lasso algorithm used the glmnet package for calculation. The nomogram was developed using the rms and foreign packages. All analyses were performed using the statistical programming environment R (version 3.6.0).
Results
Clinical characteristics
In total, 2086 female participants with complete information and outcomes, including 788 (37.8%) women with live births and 1298 women (62.2%) with LBF, were enrolled. In total, 1391 participants, including 518 (37.2%) live births and 873 (62.8%) with LBF, were treated as the training cohort, while 695 participants, including 270 (38.8%) live births and 425 (61.2%) with LBF, were considered the validation cohort. The baseline clinical information of all women, including female age and gender, is presented in Table 1. The results demonstrated that the difference in baseline characteristics between the training and validation cohorts was insignificant.
The characteristics between training and validation datasets

Note: BMI, body mass index; FET, frozen embryo transfer; HCG, human chorionic gonadotropin; FSH, follicle-stimulating hormone; TSH, thyroid stimulating hormone; FT3, free triiodothyronine; FT4, free thyroxine; TB, total bilirubin; ALT, alanine aminotransferase; AST, aspartate aminotransferase; ALP, alkaline phosphatase; GGT, gamma-glutamyl transferase; BUN, blood urea nitrogen; eGFR, estimated glomerular filtration rate; HDLC, high-density lipoprotein cholesterol; LDLC, low-density lipoprotein cholesterol; WBC, white blood cell; RBC, red blood cell; PLT, platelet count; MPV, mean platelet volume; HGB, haemoglobin.
Lasso selection for factors relevant to live birth failure
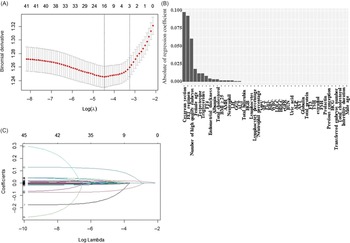
Then, the factors were selected using the Lasso binary logistic regression model in the training cohort (Figure 1A). The tuning parameter (λ) selection in the Lasso model used 10-fold cross-validation based on the minimum criteria. The area under the binomial deviance curve was plotted versus log (λ). Log (λ) = −4.4709 was chosen (1 − SE criteria) according to 10-fold cross-validation of the Lasso coefficient profiles (Table 2). A coefficient profile plot was produced against the log (λ) sequence (Figure 1B). Finally, the 17 factors related to LBF were selected (Figure 1C). These were female age, BMI, anti-Müllerian hormone (AMH), FET regimen, caesarean section, LH, testosterone, FT4, total bilirubin (TB), albumin, ALT, GGT, total cholesterol (TC), triglycerides, neutrophils, number of high-quality embryos and endometrial thickness.
(A) Tuning parameter (λ) selection in the Lasso model used 10-fold cross-validation based on the minimum criteria. (B) Changes in 44 features coefficients with the penalty parameter (λ). (C) In total, 44 features coefficients were obtained according to the selected best penalty parameter (λ).

Coefficient value of each variable derived from Lasso selection

Note: FET, frozen embryo transfer; FT4, free thyroxine; BMI, body mass index; GGT, gamma-glutamyl transferase; ALT, alanine aminotransferase; TB, total bilirubin; HGB, haemoglobin; MPV, mean platelet volume; PLT, platelet count; RBC, red blood cell; WBC, white blood cell; LDLC, low-density lipoprotein cholesterol; HDLC, high-density lipoprotein cholesterol; eGFR, estimated glomerular filtration rate; BUN, blood urea nitrogen; ALP, alkaline phosphatase; AST, aspartate aminotransferase; FT3, free triiodothyronine; TSH, thyroid stimulating hormone; FSH, follicle-stimulating hormone; HCG, human chorionic gonadotropin.
Predictive performance of the model
A multiple logistic regression model was established on the basis of the 17 factors, and five variables were finally identified as independent factors for LBF. The results are listed in Table 3. These were female age (OR: 3.092, 95%CI: 1.065–4.852), BMI (OR: 1.106, 95%CI: 1.015–1.546), caesarean section (OR: 1.909, 95%CI: 1.318–2.814), number of high quality of embryos (OR: 0.698, 95%CI: 0.599–0.812), and endometrial thickness (OR: 0.957, CI: 0.904–0.980). The ROC curve was used to evaluate the accuracy and predictive value of the above model (Table 4 and Figure 2). In the training cohort, the model showed good performance discrimination between live birth and LBF, with an AUC of 0.772 (95%CI, 0.747–0.797) (Figure 2A). In terms of the validation cohort, the model also showed a high AUC of 0.795 (95% CI, 0.761–0.830). The predictive model showed good accuracy in the training cohort (sensitivity: 73.3%; specificity: 69.5%; accuracy: 69.1%), and the validation cohort (sensitivity: 74.4%; specificity: 73.0%; accuracy: 71.5%) (Table 4).
Multivariate logistic regression analysis of 17 factors for live birth failure in women with FET

Note: *P < 0.05.
BMI, body mass index; FET, frozen embryo transfer; FT4, free thyroxine; ALT, alanine aminotransferase; GGT, gamma-glutamyl transferase.
Accuracy and predictive value among training and validation cohorts

ROC curves for the nomogram model are shown in the training and validation cohorts.

Generation and validation of the nomogram risk assessment model
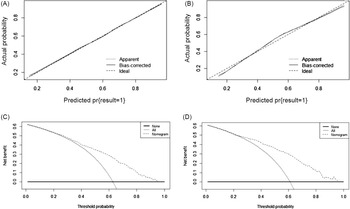
A nomogram risk prediction model containing the five independent predictors was generated (Figure 3). The sum of scores of items displayed in the nomogram was obtained. Calibration curves of the nomogram for the probability of LBF between the predicted and actual status in both training and validation cohorts were consistent (Figure 4A,B). The C-index for the nomogram in the training cohort was 0.671 (95%CI: 0.643–0.699), which was validated at 0.681 (95%CI: 0.641–0.721) in the validation cohort. This finding indicated that the model could successfully discriminate. The DCA exhibited the maximum area under the decision curve, thereby indicating the preferable net benefits of the nomogram in both the training and validation cohorts (Figure 4C,D).
Developed nomogram risk prediction model. The nomogram was established on the basis of female age, BMI, caesarean section, number of high-quality embryos, and endometrial thickness.

Calibration curves of the nomogram for predicting LBF among women with FET in the training cohort (A) and validation cohort (B), respectively. The 45° straight line represents an ideal model perfectly calibrated with an outcome. A close distance between two curves indicates high accuracy. Decision curve analysis for the nomogram in the training cohort (C) and validation cohort (D). The y-axis measures the net benefit. The dotted line represents the nomogram. The light grey line represents the assumption that all patients had LBF. The black line represents the assumption that no patients had LBF.

Discussion
The present study with women with the first FET had a large sample size and comprehensive inclusion indicators. We screened five factors related to LBF including female age, caesarean section, BMI, number of high-quality embryos, and endometrial thickness. We then established a nomogram model to provide a judgement basis for the early risk assessment of LBF in women accepting FET.
First, we identified female age as a critical factor in predicting LBF. Female age is a crucial factor in predicting live birth in women with FET. Numerous studies have demonstrated that the poor quality of oocytes in older women is likely to contribute to the relationship between age and LBF (Karlström et al., Reference Karlström, Bergh, Forsberg, Sandkvist and Wikland1997; Wang et al., Reference Wang, Yap and Matthews2001). Age was unrestricted in the present study and we demonstrated that older age was associated with LBF, as expected.
The caesarean section rate has continued to rise worldwide and has almost doubled from 12% to 21% in the past 2 decades; this value has increased to 36.2% in China (Boerma et al., Reference Boerma, Ronsmans, Melesse, Barros, Barros, Juan, Moller, Say, Hosseinpoor, Yi, de Lyra Rabello Neto and Temmerman2018). Studies have shown that caesarean section can increase the risk of subfertility (Miller et al., Reference Miller, Hahn and Grobman2013). A retrospective case–control study indicated that caesarean section decreased the pregnancy rate in women undergoing in vitro fertilization (IVF; Veleva et al., Reference Veleva, Orava, Nuojua-Huttunen, Tapanainen and Martikainen2013). A meta-analysis, comprising 10 studies that included 13,696 infertile women, demonstrated that caesarean section reduced the number of biochemical pregnancies and live birth rates compared with women with previous vaginal delivery (Riemma et al., Reference Riemma, De Franciscis, Torella, Narciso, La Verde, Morlando, Cobellis and Colacurci2021). However, other studies presented that the pregnancy rate among IVF women with or without caesarean section was the same (Patounakis et al., Reference Patounakis, Ozcan, Chason, Norian, Payson, DeCherney and Yauger2016; Diao et al., Reference Diao, Gao, Zhang, Wang, Zhang, Han, Du and Luo2021). Therefore, the detrimental effect of caesarean section on embryo transfer outcomes, particularly for women with FET, is still uncertain. Our study recruited women with first FET and showed that caesarean section was positively associated with LBF. However, this conclusion still requires further validation.
The relationship between BMI and FET outcomes is controversial. One study revealed that the implantation rate and pregnancy rate with high-quality embryo transfer remained unaffected by BMI (Ashrafi et al., Reference Ashrafi, Jahangiri, Hassani, Akhoond and Madani2011). Another study demonstrated that the difference in the implantation rate or live birth rate across different BMI women with FET was insignificant (Insogna et al., Reference Insogna, Lee, Reimers and Toth2017). In addition, a randomized control study comprised of only young women with FET indicated that BMI was unrelated to live birth (Pan et al., Reference Pan, Hao, Wang, Liu, Wang, Jiang, Shi and Chen2020). Our study included women of advanced reproductive age and low-quality embryos transfer. These two factors were then utilized in multiple regression analyses. Our findings indicated that a high BMI is associated with LBF with consideration for both age and quality of embryo transferred.
The infertility duration was not associated with LBF in the present study. Some studies have shown that infertility duration is a negative factor in the FET outcome (Cai et al., Reference Cai, Wan, Huang and Zhang2011; Nelson and Lawlor, Reference Nelson and Lawlor2011). Furthermore, an infertility duration of more than 4.5 years may affect the LBR among women who are less than 35 years old with FET (Pan et al., Reference Pan, Hao, Wang, Liu, Wang, Jiang, Shi and Chen2020). However, another study focused on women older than 40 years and demonstrated that the difference between infertility duration and live birth was insignificant (Kim et al., Reference Kim, Sung and Song2017). These studies have indicated that age may be a strong influencing factor for the effect of infertility duration on FET outcomes. The pathogenesis of the adverse effect of prolonged infertility on pregnancy outcomes remains unknown. A prospective study is required to clarify this issue.
Endometrial thickness is a crucial factor in determining the timing of FET. However, the association between FET outcomes and endometrial thickness is controversial. On the one hand, endometrial thickness presents a significant difference in the outcomes of FET cycles (Bu et al., Reference Bu, Wang, Dai and Sun2016). Specifically, pregnancy rates of women with an endometrial thickness of 9–14 mm are significantly higher than those with a thickness of 7–8 mm in exogenous hormone replacement cycles (El-Toukhy et al., Reference El-Toukhy, Coomarasamy, Khairy, Sunkara, Seed, Khalaf and Braude2008). Another study identified 8.9 mm as the cutoff value for improved live births, in which the endometrial thickness in women is ≥ 9 mm for a high probability of live birth (Pan et al., Reference Pan, Hao, Wang, Liu, Wang, Jiang, Shi and Chen2020). On the other hand, some studies have shown that endometrial thickness and LBR after FET are uncorrelated (Zhang et al., Reference Zhang, Li, Ren, Huang, Zhu, Yang and Jin2018). Note that endometrial thickness was a positive factor in live births in the present study.
Previous studies have demonstrated that the number of embryos and the number of high-quality embryos transferred significantly affected pregnancy outcome (Salumets et al., Reference Salumets, Suikkari, Mäkinen, Karro, Roos and Tuuri2006; Ashrafi et al., Reference Ashrafi, Jahangiri, Hassani, Akhoond and Madani2011). A large randomized controlled study enrolled women aged ≤ 35 years and revealed that the transferred number of frozen embryos rather than high-quality embryos was related to live births (Pan et al., Reference Pan, Hao, Wang, Liu, Wang, Jiang, Shi and Chen2020). Only the number of high-quality embryos transferred was a predictor of LBF in our study. However, in-depth studies are needed to determine whether other features, such as implantation timing, are the influencing factor for high-quality embryos transferred on LBR.
The endometrial preparation regimen remained after Lasso selection but failed in the multiple regression analysis in our study. This finding was consistent with another large randomized controlled study that enrolled young women with FET (Pan et al., Reference Pan, Hao, Wang, Liu, Wang, Jiang, Shi and Chen2020), thereby indicating that the FET regimen is not an independent factor for LBF. However, this finding requires further validation.
A nomogram was established on the basis of the five LBF-related factors for feasible clinical application. The comprehensive nomogram showed high accuracy in distinguishing between women with live births and others with LBF. Calibration and DCA curves demonstrated that the consistency and potential clinical applicability of the nomogram are high. Overall, the nomogram can effectively determine the possibility of LBF and assist physicians in the decision-making process for intensive monitoring and other special care for women with LBF potential.
First, our study design effectively avoided the collinearity between independent variables and robustly identified factors related to LBF compared with other studies. Lasso was used to determine the essential structure of multivariate observation variables. Studies that comprehensively evaluated the factors relevant to FET live birth were limited. Therefore, the results of our study may contribute to this field. Previous studies have mainly focused on the outcome of biochemical or clinical pregnancy rather than live birth. We used comprehensive and easily accessible clinical and laboratory features to establish an available and feasible model for predicting LBF as the outcome. However, our study presented the following limitations. The disadvantages of this retrospective design minimized the clinical significance of the conclusion. Data were derived from a single centre and require further validation. A prospective study with a large series of women from multiple centres will be necessary in the future to confirm the identified factors and validate the practicability of the nomogram model.
In summary, this study identified five predictors relevant to LBF among women with the first FET on the basis of the Lasso algorithm with common clinical and laboratory results. Furthermore, an accurate LBF prediction model was generated. This cost-effective and user-friendly model may help to guide the physician in implementing the necessary procedures for women with potential LBF.
Acknowledgements
This research received the Science and Technology Project of the Wenzhou Science and Technology Bureau (grant number Y20190239).
Competing interest
The authors declare no conflict of interest in preparing this article.
Ethical approval
The study was approved by the Ethics Committee of The First Affiliated Hospital of Wenzhou Medical University. Informed patient consent was not required as the results shown were based on retrospective records.