





1. Introduction
As human activities in Antarctica continue to expand, the engineering of transportation infrastructure, particularly snow roads and runways, has gained significant importance. A critical aspect of this endeavor involves investigating snow strength, which is essential for determining the load bearing capacity of snow-based roads and runways.
The mechanical behavior of snow is critically dependent on its strength properties, a key factor in assessing performance under load. Pioneering work by Wuori (Reference Wuori1957, Reference Wuori1962a) and Abele (Reference Abele1967) utilized plate bearing tests to investigate the creep deformation of snow under sustained stress and the underlying failure mechanisms. Wuori (Reference Wuori1963) performed constant-rate-of-penetration tests with a 19.35 cm2 circular piston, revealing significant challenges in rapid assessment of pavement bearing capacity using this method. Abele (Reference Abele1963) and Ueda and others (Reference Ueda, Sellmann and Abele1975) measured the ram hardness of snow, a methodology that subsequently became the most widely used technique for evaluating snow runway strength characteristics (Wuori, Reference Wuori1960, Reference Wuori1962b, Reference Wuori1963; Abele and others, Reference Abele, Ramseier and Wuori1966; Lee and others, Reference Lee, Haas and Wuori1988; Russell-Head and Budd, Reference Russell-Head and Budd1989). Moser and Stehle (Reference Moser, Stehle and Dahlgren1964), Moser and Sherwood (Reference Moser and Sherwood1966, Reference Moser and Sherwood1967) developed confined shear strength testing as a more efficient alternative to unconfined compressive testing, requiring less complex sample preparation. Narita (Reference Narita1980) observed a rate-dependent brittle-to-ductile transition in the mechanical behavior of snow through uniaxial tension tests at −10°C across deformation rates (6.8 × 10−⁸–3.1 × 10−⁴ m s−1) and snow densities (240–470 kg m−3). Hagenmuller and others (Reference Hagenmuller, Theile and Schneebeli2014b) developed a microstructure-based finite-element approach, successfully predicting tensile strength while proposing the innovative ‘minimum cut density’ as a novel microstructural parameter. Cao and others (Reference Cao, Mo, Zhang, Zhang and Fan2024) employed a novel digital shear apparatus to characterize the Mohr–Coulomb behavior of snow, revealing strength dependencies on density, aging time and normal stress. Among various strength indicators, uniaxial compressive strength is a fundamental and routinely tested metric for characterizing snow mechanics (White and McCallum, Reference White and McCallum2018). Abele (Reference Abele1963) performed unconfined compression tests on auger-cored snow samples, establishing reference strength values for subsequent snow mechanics research. Kovacs and others (Reference Kovacs, Weeks and Michitti1969) observed that snow failure transitions from instantaneous collapse at densities below 0.5 g cm−3 to crack-mediated failure at higher densities. Lintzén and Edeskär (Reference Lintzén and Edeskär2013) characterized the uniaxial mechanical behavior of manufactured snow, demonstrating positive correlations between snow density and strength, but inverse relationships with moisture content. Wang and Baker (Reference Wang and Baker2013) employed X-ray microtomography to characterize the microstructural evolution of snow during uniaxial compression, documenting a sequential failure process involving initial intergranular bond fracture followed by particle rearrangement and subsequent density increase. Wang and others (Reference Wang, Fu, Han, Liu, Xiao and Leng2021) established that uniaxial compressive strength exhibited positive correlations with decreasing temperature and increasing density through systematic testing of more than 480 natural snow specimens across controlled conditions (−5°C to −25°C, 0.35–0.60 g cm−3, 1–300 mm min−1), while elevated loading rates induced a transition from ductile deformation to brittle fracture behavior.
Snow strength is primarily influenced by factors such as density and sintering time (Abele and others, Reference Abele, Ramseier and Wuori1966; Abele and Frankenstein, Reference Abele and Frankenstein1967; Ramseier, Reference Ramseier1967; Mellor, Reference Mellor1975; Abele, Reference Abele1990). In the construction of snow roads and runways using layer-by-layer compaction, a major bottleneck in the engineering timeline arises from the prolonged waiting period required for compacted snow layers to achieve sufficient strength through sintering. Previous studies have indicated that applying external pressure to snow accelerated sintering, thus enhancing the rate of snow strength development (Maeno and Ebinuma, Reference Maeno and Ebinuma1983; Ebinuma and Maeno, Reference Ebinuma and Maeno1985; Wilkinson, Reference Wilkinson1988; Arnaud and others, Reference Arnaud, Barnola, Duval and Hondoh2000; Diemand and Klokov, Reference Diemand and Klokov2001; Bahaloo and others, Reference Bahaloo2022; Hong and others, Reference Hong2022; Huo and others, Reference Huo2024). However, the enhancement effects of pressure sintering on the uniaxial compressive strength of reconstituted and compacted Antarctic snow and its underlying mesoscale mechanisms remain unexplored. This study employs uniaxial compression tests to quantify the macroscopic strengthening effect of pressure sintering on Antarctic compacted snow, combined with μCT-reconstructed microstructures to analyze the corresponding mesoscale mechanisms.
2. Snow sample preparation
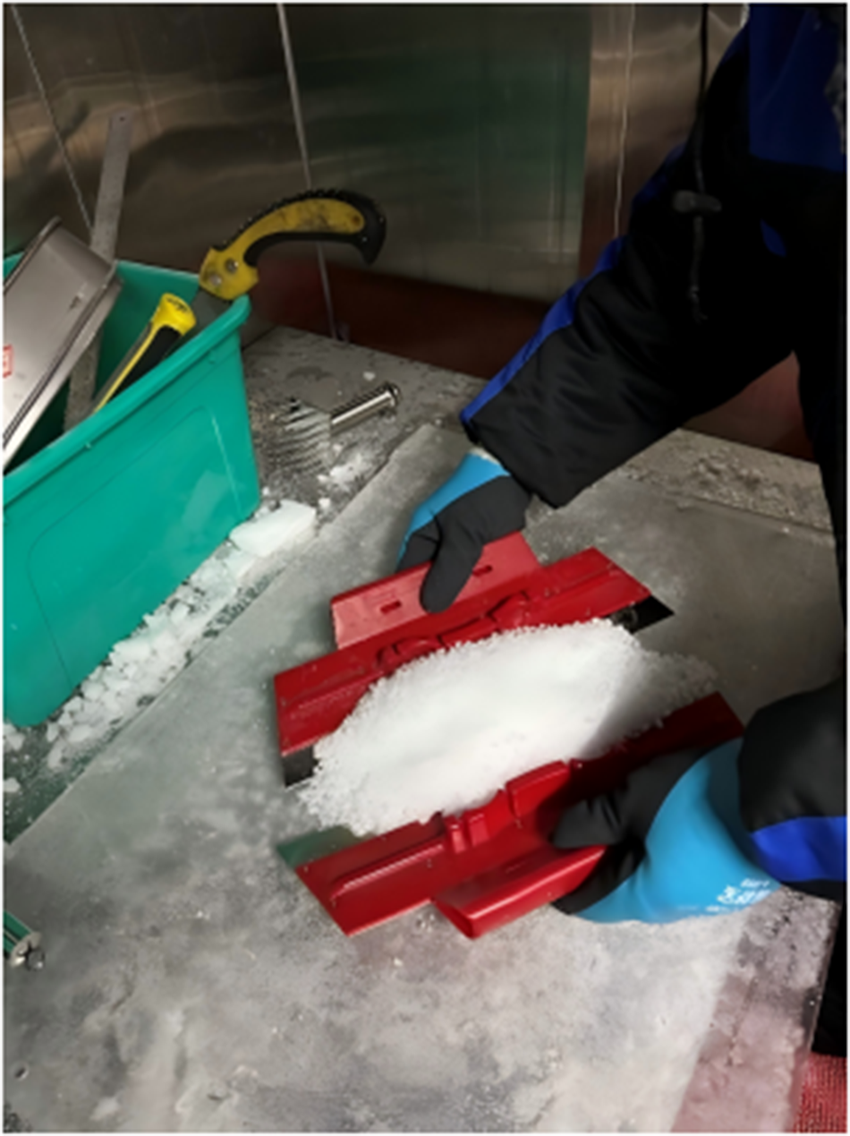
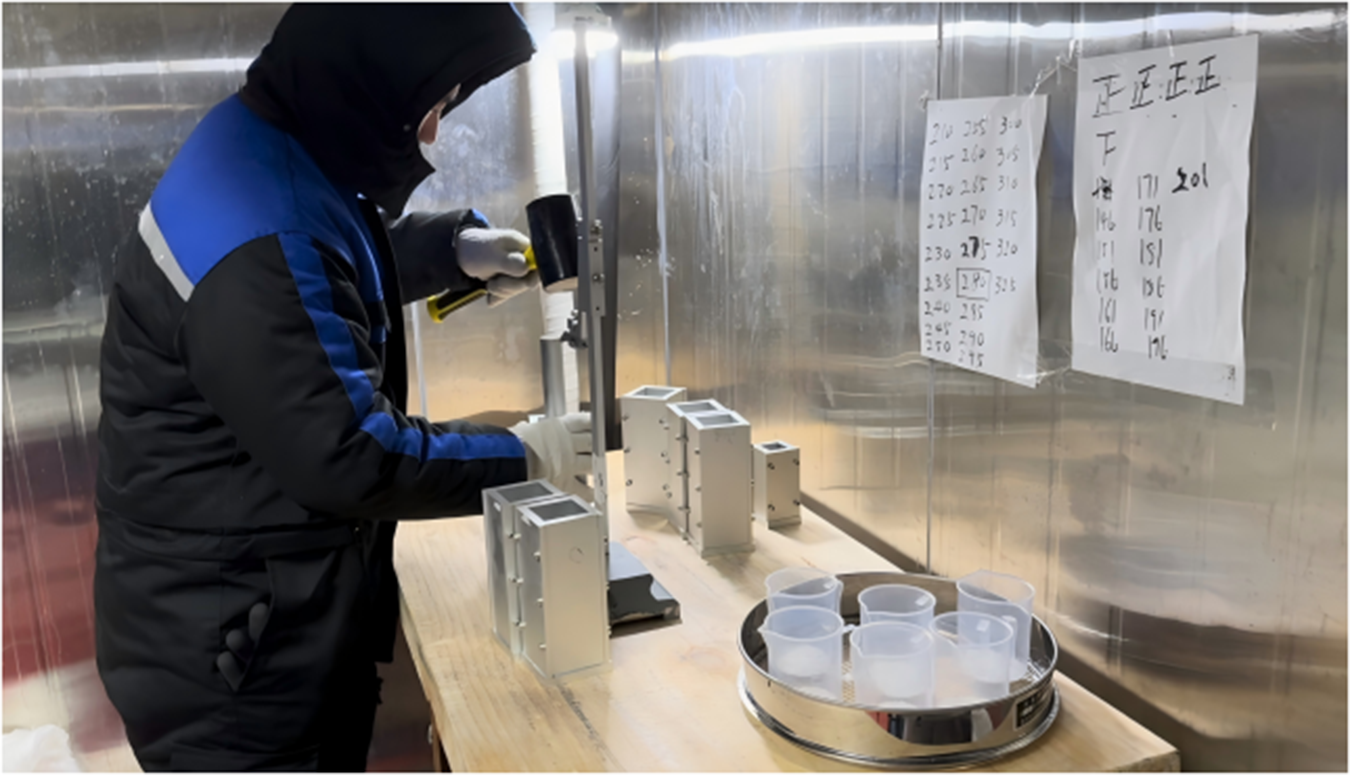
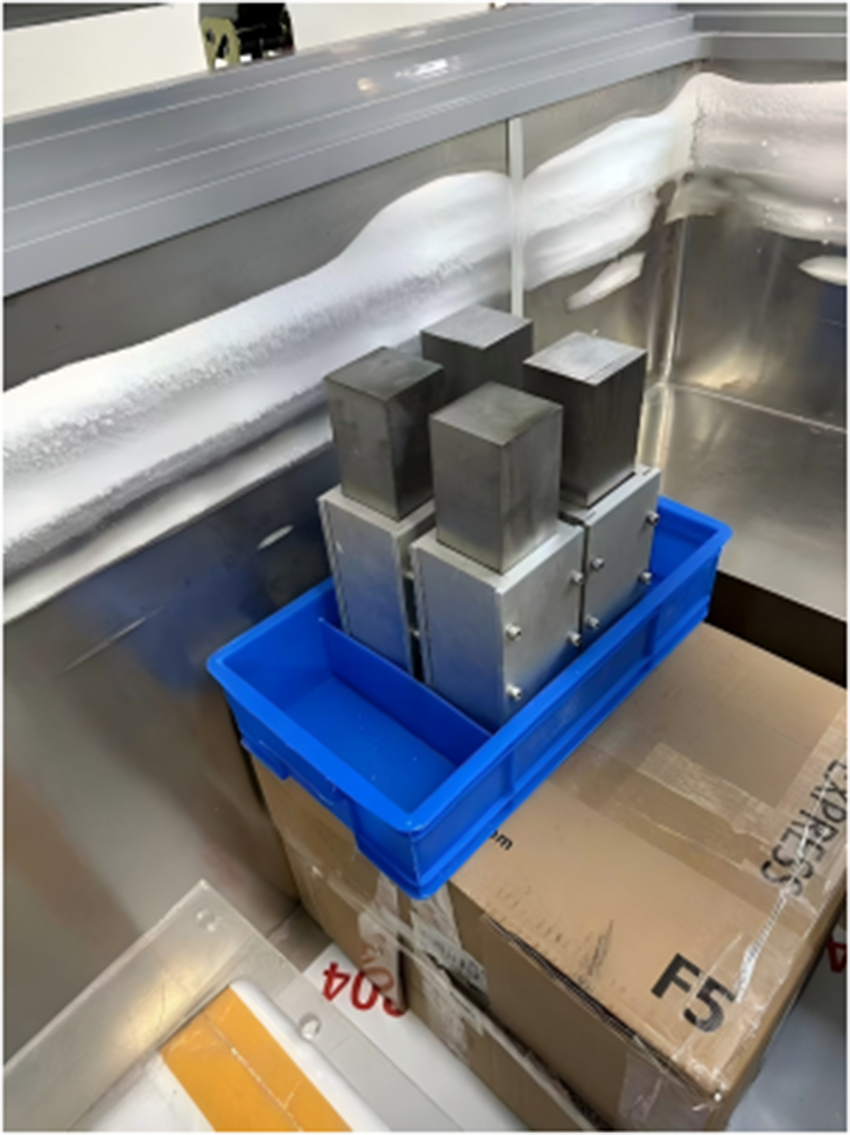
This study employed naturally sintered snow collected from subsurface layers (1–3 m depth) in the vicinity of Zhongshan Station, Antarctica. The naturally sintered snow was mechanically fragmented using an ice crusher (Fig. 1), subsequently sieved to obtain 1–2 mm particles (Fig. 2) and finally compacted in a metal mold (Fig. 3) to achieve the target density of 0.5 g cm−3. The compaction procedure involved 24 identical cycles of layer compaction, producing standardized samples with 120 mm final height and uniform density distribution. After compaction to final dimensions of 50 × 50 × 120 mm, the snow-filled molds underwent 48 hours of isothermal sintering at −10°C. In this controlled experiment, snow samples were categorized into two groups: the experimental group (40 KPa pressure sintering shown in Fig. 4) and the control group (sintering without external pressure). When the weight block (Fig. 4) was removed immediately after being placed on the snow samples, measurements showed no change in the snow sample’s density. Although Szabo and Schneebeli (Reference Szabo and Schneebeli2007) demonstrated that sintering bonds can form on sub-second timescales, the absence of immediate macroscopic densification observed herein is likely attributed to the high initial density (0.5 g cm−3) achieved during the pre-compaction phase. The pre-existing structural stability, reinforced by rapid initial bond formation, prevented significant instantaneous densification under the 40 kPa load. This indicates that the pressure from the weight block does not produce its effect instantaneously but rather generates a gradual effect on the snow sample throughout the entire sintering process.
Snow blocks collected from subsurface layers.

Snow particles with 1–2 mm diameter after sieving.

Snow particles compacted into metal molds to achieve target density.

Pressure sintering process.

The μCT scanning specimens were prepared following identical methodology to that of the uniaxial compressive test samples.
3. Experiment
3.1. Uniaxial compression testing
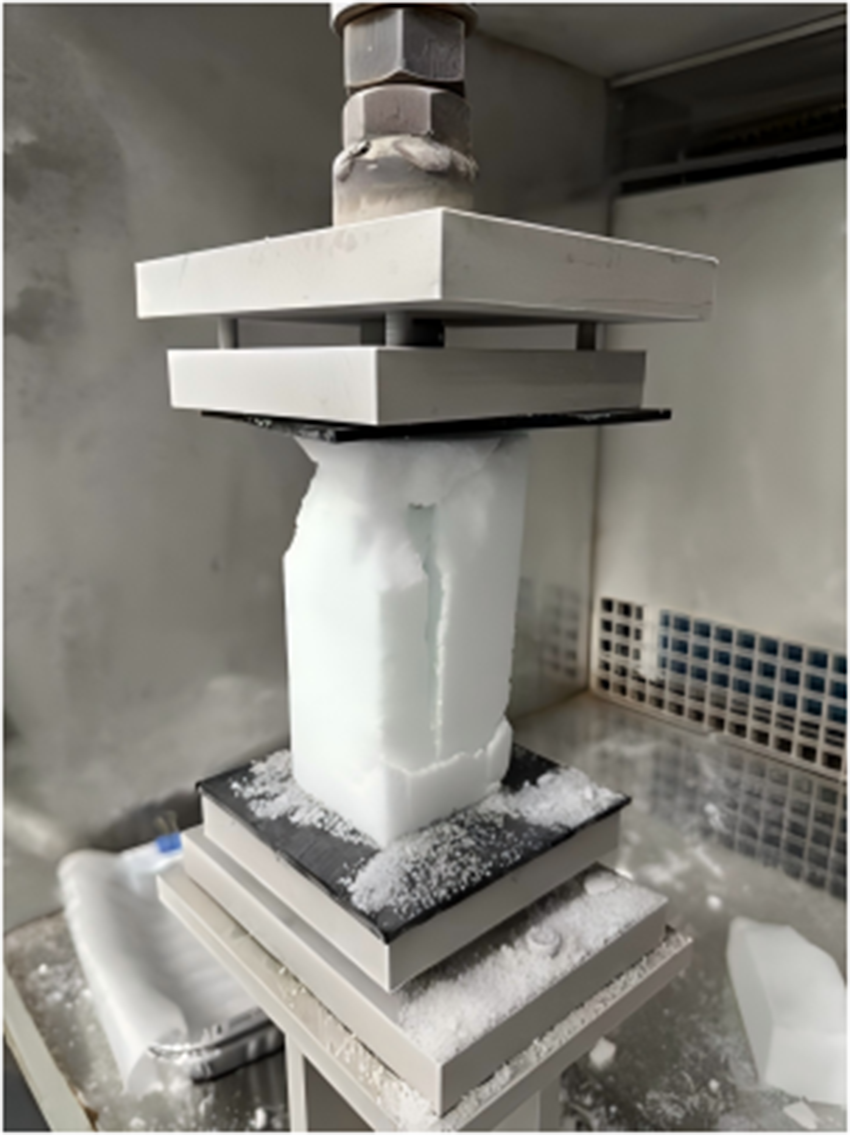
Samples were transferred to a −20°C pre-cooled loading chamber and maintained for ≥30 min before the uniaxial compressive testing. Uniaxial compression was then applied along the compaction direction at 0.01 s−1 strain rate to induce brittle failure (Fig. 5). Mean compressive strength values were derived from six compacted snow samples for each group.
Typical brittle failure observed during uniaxial compression testing at −20°C and 0.01 s−1 strain rate (sample dimensions: 50 × 50 × 120 mm).

3.2. μCT scanning
Compacted snow samples were cut into 5 × 5 × 5 mm cubes and imaged using a SKYSCAN 1272 high-resolution X-ray microtomograph. The X-ray absorption tomography reconstructed the three-dimensional microstructure by acquiring projection images at different rotational angles. For each sample, 300 projection images with a pixel resolution of 8.56 μm were obtained, covering a 180° rotation around the vertical axis.
4. Method
In this section, we first briefly introduce different mesoscopic indicators used to characterize the microstructure of snow samples, and then explain in detail the minimum cut density, directional connectivity and structure thickness that have a significant influence on the uniaxial compressive strength of snow samples.
4.1. Mesoscale mechanism analysis
Previous studies have relied on bonding systems and grain contact analysis to characterize snow crystal connectivity and mechanical force transmission within the microstructure. Since stress concentrations predominantly occur at narrow intergranular ice bonds, existing literature has quantified the bond network using parameters such as mean grain size, coordination number, contiguity and specific contact area to model the mechanical behavior of snow (Flin and others, Reference Flin2011; Gubler, Reference Gubler1978; Hagenmuller and others, Reference Hagenmuller, Chambon, Flin, Wang, Lesaffre and Naaim2013a,Reference Hagenmuller, Chambon, Lesaffre, Flin and Naaimb, Reference Hagenmuller, Chambon, Flin, Morin and Naaim2014a; Shertzer and Adams, Reference Shertzer and Adams2011; Theile and Schneebeli, Reference Theile and Schneebeli2011; Wang and others, Reference Wang, Gillibert, Flin and Coeurjolly2012). However, applying these microstructural metrics to dense snow remains challenging, particularly due to the subjective criteria required for grain boundary identification.
Alternatively, microstructure characterization methods based on correlation length have been widely employed to assess structural anisotropy in both pore networks and the ice matrix. Srivastava and others (Reference Srivastava, Mahajan, Satyawali and Kumar2010) first employed the mean intercept length (MIL) method to relate orthotropic compliances to fabric eigenvalues (Cowin, Reference Cowin1985). Subsequently, Löwe and others (Reference Löwe, Riche and Schneebeli2013) applied strong-contrast theory through the anisotropy parameter Q (Torquato, Reference Torquato1997), while Srivastava and others (Reference Srivastava, Chandel, Mahajan and Pankaj2016) expanded the framework using the Zysset–Curnier model (Zysset, Reference Zysset2003), incorporating star distributions and MIL-based tensors. Despite these advances, such methods have largely been limited to natural low-density snow and have yet to be validated for medium- to high-density compacted snow used in Antarctic roads and runways.
4.2. Minimum cut density index
Hagenmuller and others (Reference Hagenmuller, Calonne, Chambon, Flin, Geindreau and Naaim2014c) developed the minimum cut density index (MCDI) as an advancement over conventional porosity measures by accounting for ice matrix anisotropy. This approach builds upon the fundamental understanding that the macroscopic properties of snow are controlled by critical matrix constrictions (Ballard and Feldt, Reference Ballard and Feldt1965; Kry, Reference Kry1975a,b), while preserving Colbeck’s (Reference Colbeck1997) conceptual model of bonds functioning as flow-regulating valves, eliminating the need for precise grain boundary identification. Previous applications have demonstrated MCDI’s effectiveness in characterizing both tensile strength and elastic modulus of snow (Hagenmuller and others, Reference Hagenmuller, Theile and Schneebeli2014b). Therefore, this study analyzed the mesoscale mechanisms by evaluating the MCDI along three orthogonal directions (X, Y and Z), where the pressure was applied along the Z-axis during sintering.
4.3. Directional connectivity index
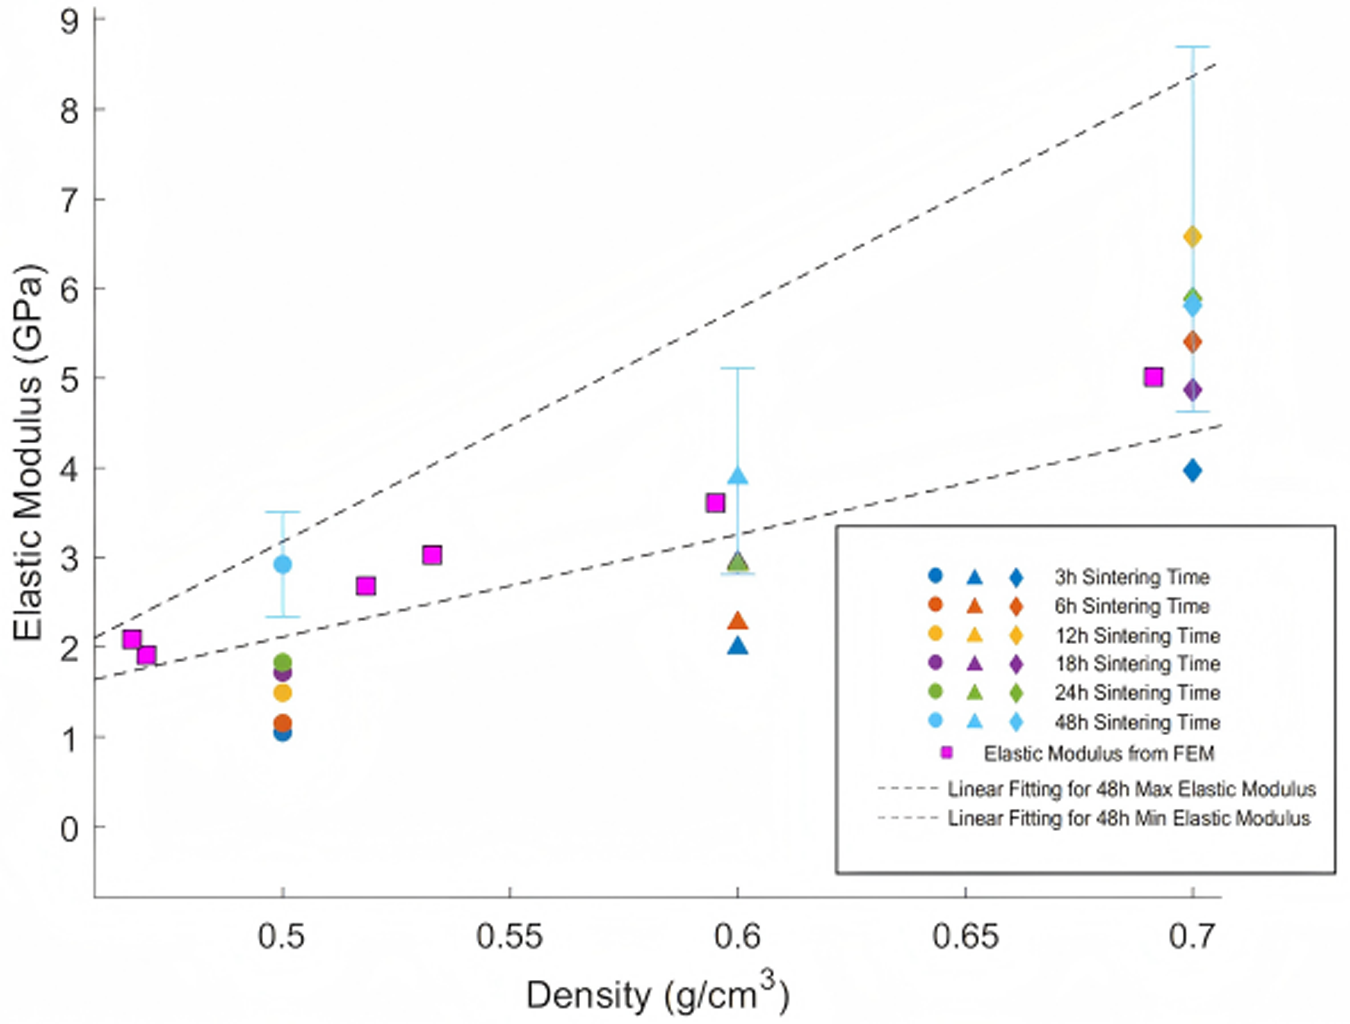
To examine mesoscale mechanical behavior in reconstituted and compacted Antarctic snow, we prepared specimens spanning density ranges of 0.45–0.70 g cm−3 (separate from the control and experimental groups mentioned previously) and performed μCT imaging alongside P-wave propagation measurements for elastic modulus estimation following Gerling and others (Reference Gerling, Lowe and van Herwijnen2017). Three-dimensional microstructures of reconstituted and compacted Antarctic snow derived from μCT imaging were converted into finite element meshes using Ansys ICEM (Ansys Inc, 2022). The reconstructed cubic volumes (3 mm actual edge dimension) were discretized with tetrahedral elements in Ansys ICEM. The refinement parameter (number of edges equivalent to the length of a radius when wrapped around the complete circumference) was configured at 4. Minimal element dimensions were specified as 30 μm, with total element counts ranging from 4 to 5 million. Within the simulations, ice was represented as a homogeneous, isotropic linear elastic material characterized by 10 GPa elastic modulus and 0.3 Poisson’s ratio. Uniaxial compression scenarios were implemented by imposing displacement on the upper boundary (perpendicular to Z-axis in Fig. 7) while restricting the lower boundary along the Z-axis. Given that finite-element analysis application herein focuses solely on force chain distribution examination within the microstructure without addressing structural failure (confined to the elastic stage), mesoscale simulation validity through finite-element methodology was confirmed via elastic modulus measurements. Simulated elastic moduli for compacted snow at varying densities with 48-hour sintering duration were superimposed onto measured elastic modulus plots across different densities and sintering periods. Figure 6 demonstrates strong agreement between simulated and experimental outcomes, both displaying consistent ascending trends with increasing snow density at 48-hour sintering duration. All computational data points reside within the envelope defined by best-fit lines marking upper and lower boundaries of measured elastic moduli at 48-hour sintering duration, thus confirming the reliability of finite-element–based mesoscale simulation.
Comparison between the measured and simulated elastic moduli of reconstituted and compacted Antarctic snow.

Figure 6 Long description
The scatter plot illustrates the relationship between Elastic Modulus (GPa) and Density (g/cm superscript 3) for reconstituted and compacted Antarctic snow. The horizontal axis represents Density, ranging from about 0.47 to 0.70, while the vertical axis represents Elastic Modulus, ranging from 0 to 9 GPa. The plot shows that the Elastic Modulus generally increases with higher Density and longer sintering times. Data points are grouped into clusters at Density values of approximately 0.5, 0.6 and 0.7. Within each cluster, markers represent different sintering times: circles for 3h, triangles for 6h, 12h, 18h, 24h and diamonds for 48h. The Elastic Modulus tends to rise with longer sintering times within each Density cluster, indicating a positive correlation. The legend explains the symbols: circular markers for 3h, triangular markers for 6h to 24h and diamond markers for 48h sintering times. Square markers represent Elastic Modulus from FEM. Two dashed lines indicate linear fitting for 48h Max and Min Elastic Modulus, showing an increasing range with Density. Notable data points include: at Density 0.5, Elastic Modulus ranges from about 1.9 to 3.0 GPa; at Density 0.6, it ranges from about 2.7 to 4.0 GPa; and at Density 0.7, it ranges from about 3.6 to 6.0 GPa. The plot reveals that Elastic Modulus increases with both Density and sintering time, with no significant outliers disrupting the trend.
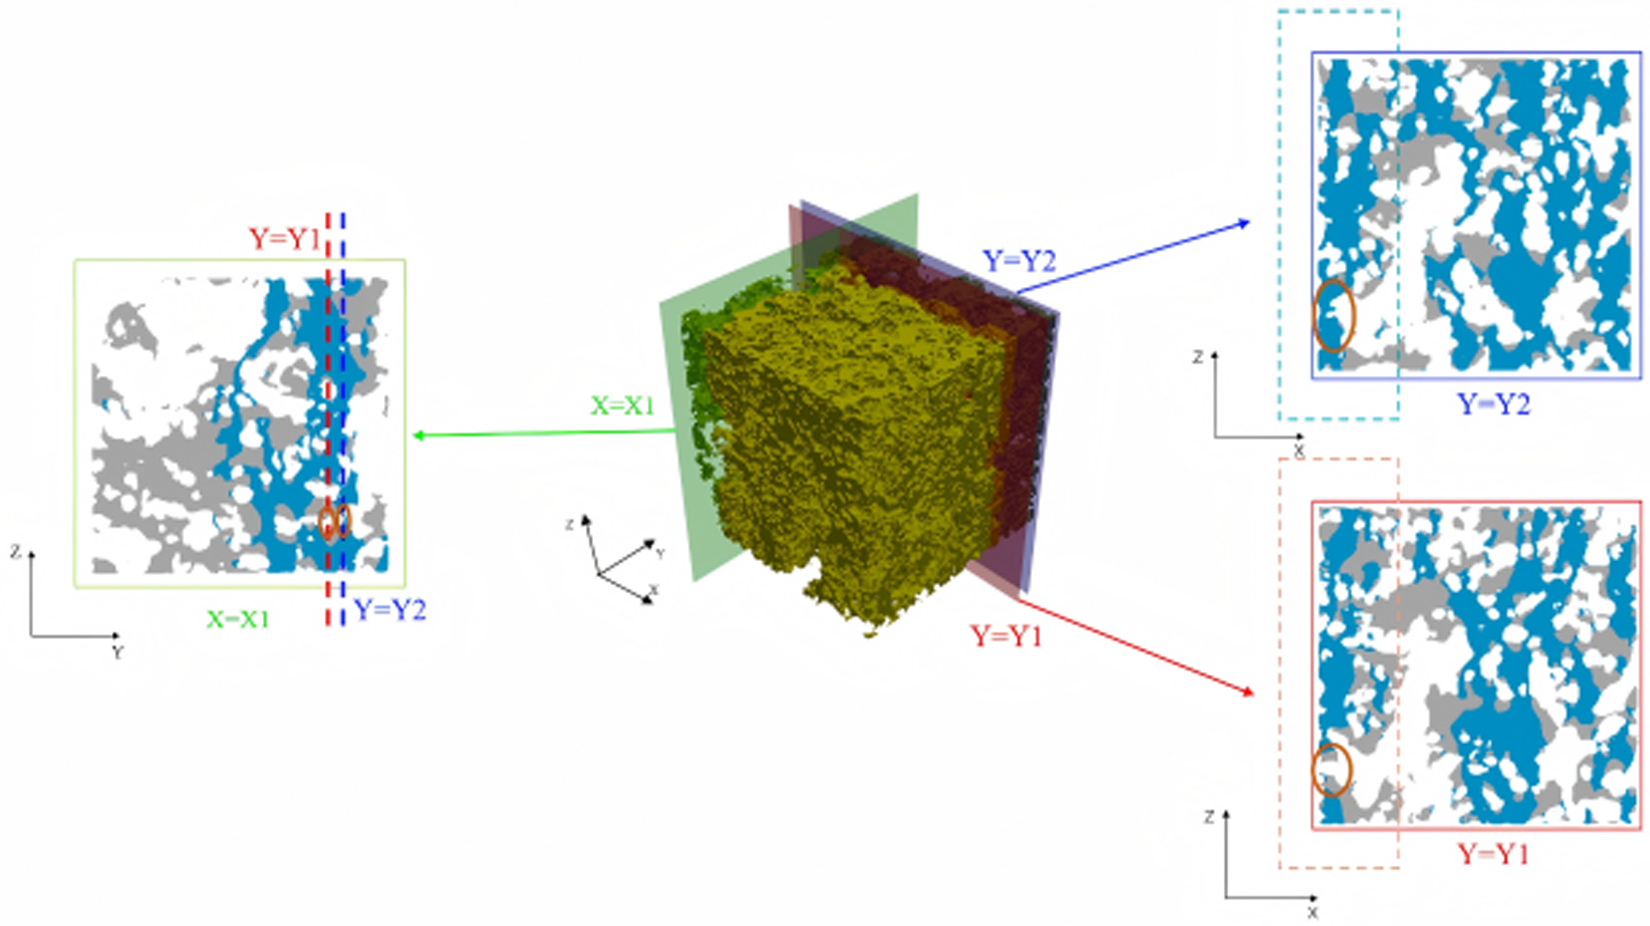
Distributions of larger compressive stresses ( ${\sigma _{nL}}$ < −1) and local connectivity in the loading direction in parallel adjacent cross section and the cross section in the perpendicular direction. Red boundary denotes the Y1 cross section in which the red circle emphasizes a local pore in ice matrix. Dark blue boundary denotes the Y2 cross section in which the red circle emphasizes the connection in ice matrix adjacent to the disconnection in Y1 cross section. Green boundary denotes the X1 cross section in which the red circles denote the transition from the pore in Y1 cross section to connection in Y2 cross section.

Figure 7 Long description
A three-dimensional ice matrix with cross sections highlighted. In the center, a cubic volume is shown with three planes intersecting it. The left section displays a cross section labeled X equals X1, with two vertical lines marked Y equals Y1 and Y equals Y2. The right section shows two separate cross sections, Y equals Y1 and Y equals Y2, each with a distinct boundary color. The Y equals Y1 section is outlined in red, while the Y equals Y2 section is outlined in blue. Both sections emphasize specific areas with red circles, indicating local features within the ice matrix. The axes are labeled X, Y and Z, providing orientation for the cross sections. The diagram visually represents the spatial relationship and connectivity within the ice matrix across different cross sections.
To quantify mesoscale stress heterogeneity independent of the applied force, a nominal stress parameter was defined as
 \begin{equation}{\sigma _{{\text{nominal}}}} = \frac{F}{{{l^2} \times \alpha }},\end{equation}
where  $F$
 $l$ is the side length of the simulated domain (mm) and α is the ice volume fraction (dimensionless).
 ${\sigma _{{\text{nominal}}}}$ represents the theoretical average stress under uniform pore distribution. The normalized stress
 ${\sigma _{nL}}$ was further defined as
 \begin{equation}{\sigma _{nL}} = \frac{{{\sigma _L}}}{{{\sigma _{{\text{nominal}}}}}},\end{equation}
where  ${\sigma _L}$ is the actual normal stress (MPa), and
 ${\sigma _{nL}}$ is the dimensionless normalized stress.
 ${\sigma _{nL}}$ < −1 indicates compressive stresses exceeding
 ${\sigma _{{\text{nominal}}}}$.
As illustrated in Fig. 7, stress distribution analysis revealed that larger compressive stresses ( ${\sigma _{nL}}$ < −1) concentrated within interconnected regions, forming continuous force transmission pathways spanning the microstructure along the loading direction. Cross-sectional analysis in both parallel (Y-Z) and perpendicular (X-Z) planes confirmed that continuous, microstructure-spanning pathways were prerequisites for force chain development. These results indicate that enhanced directional connectivity promotes additional force transmission pathways, increasing active load-bearing chains and ultimately improving uniaxial compressive strength. Based on this understanding, Xiao and others (Reference Xiao, Wang, Ding, Tang, Sun, Yin, Han and Wang2026) proposed the directional connectivity index (DCI) defined as
 \begin{equation}
{\text{DCI}} = \frac{{\begin{array}{*{20}{c}}
\!\!\!\!\!\sum\limits_{i = 1}^I\left\{ {1 - \frac{1}{2}\tanh (3) + \frac{1}{2}\tanh \left[ {30\left( {\frac{{{d_{th}}}}{{{d_{ib}}}} - 0.9} \right)} \!\right]} \!\right\} \\[6.5pt]
{\!\!\!+ \sum\limits_{j = 1}^J\left\{ {1 - \frac{1}{2}\tanh (3) + \frac{1}{2}\tanh \left[ {30\left( {\frac{{{d_{th}}}}{{{d_{jt}} + {d_{jb}}}} - 0.9} \!\right)} \!\right]} \!\right\}} \\[6.5pt]
{\!\!\!\!\!+ \sum\limits_{k = 1}^K\left\{ {1 - \frac{1}{2}\tanh (3) + \frac{1}{2}\tanh \left[ {30\left( {\frac{{{d_{th}}}}{{{d_{kt}}}} - 0.9} \right)} \!\right]} \!\right\}}
\end{array}}}{T}.
\end{equation}
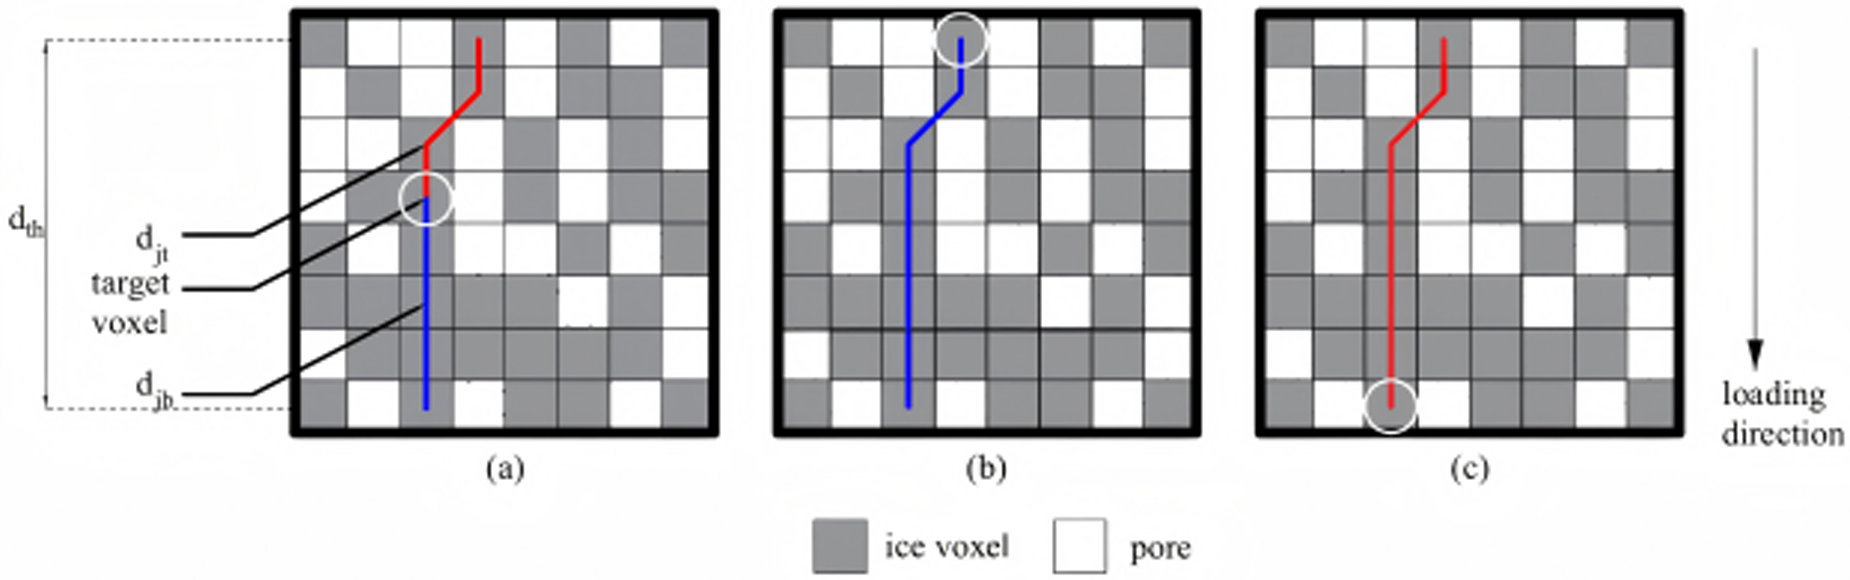
As illustrated in Fig. 8, voxels in the microstructure are categorized into three sets: Set  $I$ comprises the topmost layer voxels, Set
 $K$ consists of the bottommost layer voxels and Set
 $J$ includes all remaining voxels, with indices
 $i$,
 $j$ and
 $k$ assigned to voxels in Sets
 $I$,
 $J$ and
 $K$, respectively.
 $T$ denotes the total number of voxels when the entire microstructure is fully filled with voxels. The shortest path distances are defined as follows:
 ${d_{ib}}$ represents the shortest distance from voxel
 $i$ (Set
 $I$) to any voxel in the bottom layer,
 ${\text{ }}{d_{kt}}$ signifies the shortest distance from voxel
 $k$ (Set
 $K$) to any voxel in the top layer,
 ${d_{jt}}$ indicates the shortest distance from voxel
 $j$ (Set
 $J$) to any voxel in the top layer and
 ${d_{jb}}$ corresponds to the shortest distance from voxel
 ${\text{ }}j$ (Set
 $J$) to any voxel in the bottom layer. For detailed description and discussion on DCI, one can refer to Zhang and Wang (Reference Xiao, Wang, Ding, Tang, Sun, Yin, Han and Wang2026).
(a) Set voxel calculation: red lines represent shortest paths to any voxel in the top layer; blue lines denote shortest paths to any voxel in the bottom layer. (b) Set voxel calculation: blue lines indicate shortest paths to any voxel in the bottom layer. (c) Set voxel calculation: red lines illustrate shortest paths to any voxel in the top layer.

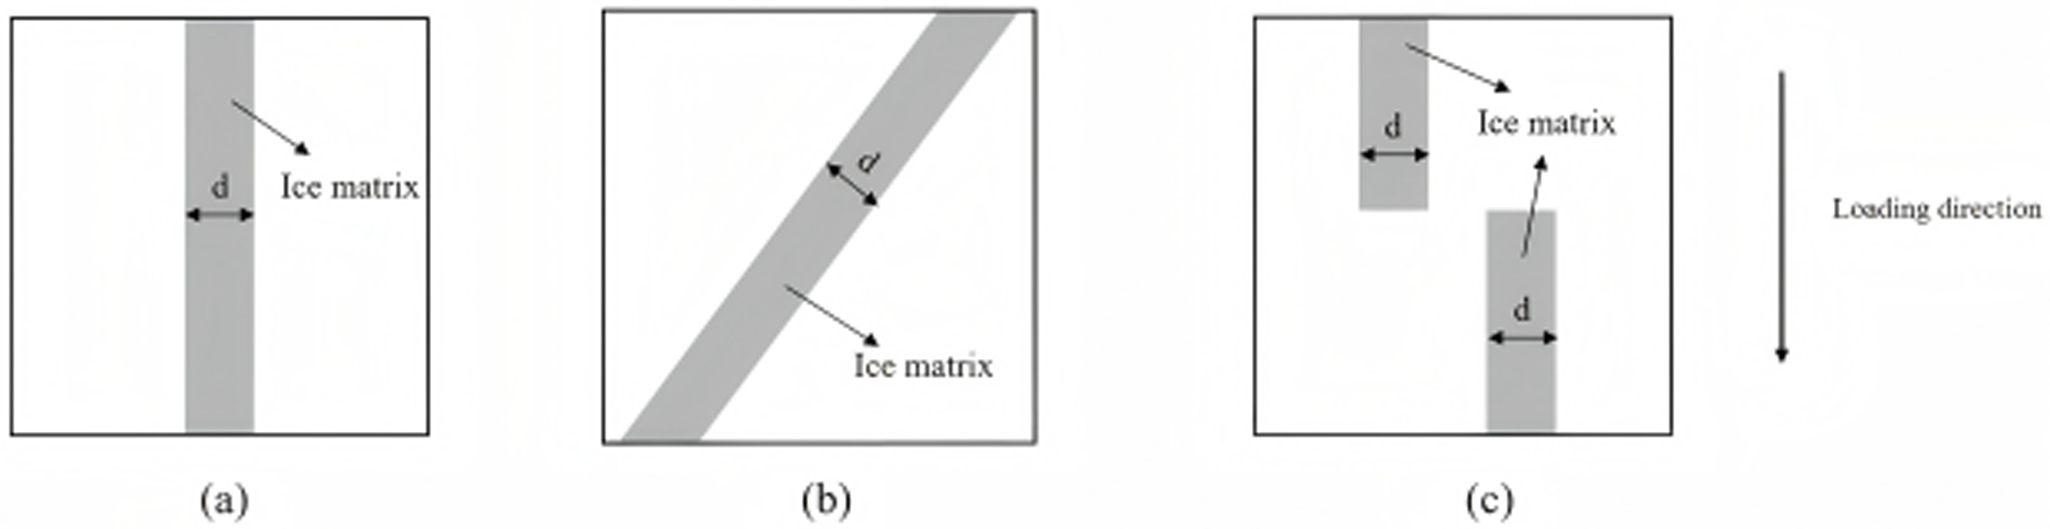
DCI values exhibit a positive relationship with structural load-bearing capacity. Figure 9a–c demonstrate this correlation: as force-transmitting chains progressively deteriorate from Fig. 10a–c, corresponding DCI measurements decline steadily, reflecting diminishing microstructural strength. Furthermore, DCI addresses key shortcomings of MCDI. Figure 9a,b reveal identical MCDI measurements despite differing load-bearing capabilities, demonstrating MCDI’s inability to differentiate structural strength in such scenarios. Therefore, integrating DCI strengthens the linkage between mesoscopic parameters and bulk mechanical strength.
Schematic diagram of the relationship between DCI and load-bearing capacity (where d represents the width of the ice matrix): (a) microstructure with comparatively large DCI value; (b) microstructure with comparatively small DCI value; (c) microstructure with DCI value of zero.

Strain in the loading direction for a Y-Z (defined in Figure 8) cross section. Red circles denote narrow constrictions with higher strain.

Figure 10 Long description
Heat map illustrating strain in the loading direction for a cross section. The gradient legend on the left ranges from 0.0003 to negative 0.0750, indicating strain levels. Higher strain is represented by circled constrictions, marked in red, which are distributed across the map. These constrictions are located near white void regions, suggesting areas of increased strain. The map lacks labeled axes, but the spatial distribution of strain shows notable clustering around these voids. The gradient suggests that negative values may indicate compression, with higher strain values near the circled areas.
The theoretical foundation of DCI rests on recognizing that external loads imposed on snow propagate nonuniformly, instead channeling preferentially through interconnected load-transmitting architectures (force chains). DCI evaluates the integrity of these stress-transfer pathways by examining the ice matrix’s effectiveness in distributing applied forces across the entire specimen. Elevated DCI measurements signify robust network connectivity, facilitating efficient load redistribution and enhanced overall strength. In contrast, diminished DCI values indicate fragmented architectures where loads concentrate along sparse pathways, rendering specimens susceptible to collapse when individual chains fracture. This elucidates why specimens with comparable densities demonstrate markedly divergent strengths: the determining factor extends beyond mere ice content to encompass how effectively this ice arranges into continuous load-bearing networks.
This study employs the DCI that incorporates the mechanical behavior of load-bearing chains to systematically analyze the mesoscale mechanisms underlying the macroscopic strengthening effects of pressure sintering.
4.4. Structure thickness
Strain distribution analysis of planar sections along the loading direction revealed strain localization in geometrically constrained ‘narrow-neck’ regions (Fig. 10), corroborating the fundamental understanding established by Ballard and Feldt (Reference Ballard and Feldt1965) and Kry (Reference Kry1975a, Reference Kry1975b) regarding the dominant role of critical ice matrix constrictions in governing the macroscopic mechanical response of snow. These microstructurally sensitive zones, where deformation preferentially concentrates, can be quantitatively described through the structure thickness metric.
The structure thickness parameter, introduced by Hildebrand and Rüegsegger (Reference Hildebrand and Rüegsegger1997), provides robust geometric characterization of microstructural dimensions via a maximal inscribed sphere approach. This metric defines the local structural dimension as the diameter of the largest sphere that can enclose a given point while remaining entirely within the solid phase, without requiring central positioning. While previous applications have successfully utilized mean structure thickness to monitor microstructural evolution during temperature gradient metamorphism (Schneebeli and Sokratov, Reference Schneebeli and Sokratov2004; Pinzer, Reference Pinzer2009), the current study extends this methodology to comparatively analyze the mesoscale mechanisms of the pressure sintering effects.
5. Results
5.1. Uniaxial compressive strength
Compared to the control group (density: 0.500 g cm−3), the experimental group achieved a higher density of 0.521 g cm−3 through pressure sintering. Correspondingly, the results of compression tests demonstrated that the average uniaxial compressive strength of the experimental group with six samples increased significantly from 0.132 MPa (control group with six samples) to 0.246 MPa, representing an 86% enhancement (Fig. 11). Typical stress–strain curves for the control group and experimental group are presented in Fig. 12. The nonlinearity at the initial loading stage is mainly caused by the rubber pads placed at the top and bottom of the specimen (Fig. 5), which are primarily used to prevent local failures induced by local contacts between the indenter and the snow sample.
Comparison of uniaxial compressive strength between experimental and control groups. The pink lines represent the mean compressive strength, with blue boxes indicating the minimum and maximum values. The experimental group (0.246 MPa) demonstrates an 86% enhancement compared to the control group (0.132 MPa).

Representative stress–strain curves for the control and experimental groups.

5.2. Minimum cut density index
As shown in Fig. 13, the average MCDI values in the Z-direction were 54% higher in the experimental group (0.077 g cm−3) than that in the control group (0.050 g cm−3). An independent samples t test revealed a significant difference in Z-direction MCDI between the control group and experimental group (p < 0.001). For the experimental group, Fig. 14 demonstrates that the MCDI values along the Z-direction were significantly higher than those in the X- (paired t test: p < 0.001) and Y-directions (paired t test: p < 0.001), while the values in the X- and Y-directions were comparable to each other.
Box plot of MCDI along Z-axis for experimental and control groups. The box represents the interquartile range (IQR), the horizontal line indicates the median, and the white diamond denotes the mean. Whiskers extend to the most extreme data points within 1.5 times the IQR, while the red dots represent outliers. The experimental group shows a significantly higher MCDI compared to the control group (p < 0.001).

Violin plot showing the distribution of MCDI values in X-, Y- and Z-directions for the experimental group. The width of the violin represents the probability density of the data. The internal box plot shows the median and IQR. The Z-direction exhibits significantly higher MCDI values compared to the X- and Y-directions (both p < 0.001), indicating structural orthotropy.

5.3. Directional connectivity index
As shown in Fig. 15, the Z-direction DCI in the experimental group (0.267) was significantly higher than in the control group (0.191), representing a 39% increase (p < 0.001). Consistent with the MCDI findings, the experimental group’s Z-direction DCI also significantly exceeded both the X- and Y-directions (all p < 0.001), as illustrated in Fig. 16.
Box plot of DCI in Z-direction for experimental and control groups. The box represents the interquartile range (IQR), the horizontal line indicates the median, and the white diamond denotes the mean. Whiskers extend to the most extreme data points within 1.5 times the IQR, while the red dots represent outliers. The experimental group demonstrates a significant increase in directional connectivity compared to the control group (p < 0.001).

Violin plot showing the distribution of DCI values in X-, Y- and Z-directions for the experimental group. The violin shape illustrates the data distribution density. The Z-direction DCI is significantly higher than that of the X-direction (p < 0.001) and Y-direction (p < 0.001), confirming the enhanced connectivity along the loading axis.

5.4. Structure thickness
As shown in Fig. 17, although the difference did not reach statistical significance (p = 0.125), the experimental group exhibited a higher mean structure thickness (161.550 μm) compared to the control group (154.596 μm).
Box plot of structure thickness for experimental and control groups. The box represents the interquartile range (IQR), the horizontal line indicates the median, and the white diamond denotes the mean. Whiskers extend to the most extreme data points within 1.5 times the IQR, while the red dots represent outliers. The experimental group showed a trend toward increased mean structure thickness compared to the control group, although this difference did not reach statistical significance (p = 0.125).

6. Discussion
The observed 86% enhancement in uniaxial compressive strength through pressure sintering can be attributed to several related mechanisms operating at the mesoscale level. The substantial increase in MCDI, with a 54% enhancement in the Z-direction (pressure applied direction), indicates that pressure sintering fundamentally alters the critical load-bearing regions within the ice matrix. These findings align with the theoretical framework proposed by Hagenmuller and others (Reference Hagenmuller, Calonne, Chambon, Flin, Geindreau and Naaim2014c), where the weakest cross-sectional areas govern overall structural integrity. The concurrent improvement in the DCI values, with a 39% increase in the Z-direction, further supports the hypothesis that pressure sintering enhances the formation of continuous force transmission networks along the loading direction. Notably, within the experimental group, both MCDI and DCI values in the Z-direction were substantially higher than those in the X- and Y-directions, while X- and Y-direction values remained comparable to each other. This pronounced anisotropy indicates that pressure sintering preferentially optimizes microstructural connectivity along the pressure applied direction, creating microstructural orthotropy of the experimental group. The increases in structure thickness indicate that pressure sintering not only densifies snow but also optimizes the spatial distribution of ice and void phases. This optimization contributes to more efficient load distribution and reduced stress concentrations at critical load bearing regions. The differences in the aforementioned mesoscale indices between the experimental and control groups are visually represented by the microstructure comparison in Fig. 18. As illustrated in Fig. 18, compared to the control group, the microstructure of the experimental group exhibits significantly more pores distributed along the Z-direction than along the X- and Y-directions. This phenomenon results from the applied pressure during the sintering process, which promotes the closure of pores aligned in the X- and Y-directions. This anisotropic pore distribution characteristic is in line with the higher MCDI and DCI values along the Z-direction in the experimental group.
Comparison of microstructures between the experimental and control groups (48 hours of sintering after compaction): (a) control group; (b) experimental group.

7. Conclusion
This study investigated the macroscopic strengthening effect of pressure sintering on reconstituted and compacted Antarctic snow through uniaxial compression tests, complemented by μCT-based microstructural analysis to elucidate the underlying mesoscale mechanisms. The results demonstrated that pressure sintering significantly improved the uniaxial compressive strength of snow through increased sample density and enhanced microstructural connectivity. The experimental group exhibited an average uniaxial compressive strength of 0.246 MPa, representing an 86% enhancement compared to the control group (0.132 MPa). Mesoscale characterization revealed substantial microstructural modifications in the loading direction: the MCDI increased by 54% in the Z-direction (from 0.050 to 0.077 g cm−3), while the DCI showed a 39% improvement in the Z-direction (from 0.191 to 0.267). Increases in mean structure thickness were also observed from 154.596 to 161.550 μm. Importantly, analysis within the experimental group demonstrated pronounced microstructural orthotropy, with both MCDI and DCI values in the Z-direction significantly exceeding those in the X- and Y-directions, while maintaining comparable values between the X- and Y-directions. The strengthening mechanism is attributed to density-enhanced particle rearrangement and optimized pore distribution during pressure sintering, promoting the formation of more effective load-bearing pathways and reducing critical stress concentrations. The findings in this study provide critical insights for optimizing snow compaction techniques in Antarctic snow engineering.
Acknowledgements
The authors would like to express their gratitude for the financial support provided by the National Key Research and Development Project of China under Grant No. 2022YFC2807101.




 Open access

