Implications
Defining different lying patterns, based on the Delaunay triangulation (DT) features extracted from the group lying patterns of pigs, could help farm managers to assess the adequacy of thermal provision for pigs in large-scale farms. Use of a multilayer perceptron (MLP) classifier network makes it possible to classify the thermal category in a room using DT features. Such data could be used as a supporting technology for ventilation system management.
Introduction
The heat regulation capacity of pigs is poorly developed compared with other mammals and heat loss is critical for them (Mendes et al., Reference Mendes, Moura, Nääs and Bender2013). Controlling environmental parameters helps to deliver high health, welfare and production performance efficiency (Mount, Reference Mount1968; Shao et al., Reference Shao, Xin and Harmon1998). The activity, feed intake and lying behaviour of pigs will change in different thermal conditions (Hillmann et al., Reference Hillmann, Mayer and Schrader2004; Renaudeau et al., Reference Renaudeau, Kerdoncuff, Anaïs and Gourdine2008; Spoolder et al., Reference Spoolder, Aarnink, Vermeer, Riel and Edwards2012; Weller et al., Reference Weller, Alebrante, Campos, Saraiva, Silva, Donzele, Oliveira, Silva, Gasparino, Lopes and Guimarães2013). When the temperature drops, pigs try to increase their heat production by means of energetically demanding muscular shivering thermogenesis, and they try to reduce their heat loss by social and individual thermoregulatory behaviours. Therefore, by investigation of pig lying posture, it could be possible to assess how comfortable or uncomfortable they are in their current environment.
Image processing has been applied in recent years as a cheap, fast and non-contact way to identify and classify behaviours linked to pig comfort and welfare (Shao and Xin, Reference Shao and Xin2008; Viazzi et al., Reference Viazzi, Ismayilova, Oczak, Sonoda, Fels, Guarino, Vranken, Hartung, Bahr and Berckmans2014; Nilsson et al., Reference Nilsson, Herlin, Ardö, Guzhva, Åström and Bergsten2015; Nasirahmadi et al., Reference Nasirahmadi, Hensel, Edwards and Sturm2016). This technique has been an important approach for a variety of applications involving pig lying behaviour recognition. Image processing systems have been used for finding the relation between the activity of pigs and environmental parameters by Costa et al. (Reference Costa, Ismayilova, Borgonovo, Viazzi, Berckmans and Guarino2014), and to detect movement and classify thermal comfort state of group-housed pigs based on their resting behavioural patterns by Shao and Xin (Reference Shao and Xin2008). In a previous study, the DT method was developed by Nasirahmadi et al. (Reference Nasirahmadi, Richter, Hensel, Edwards and Sturm2015) as an imaging system for finding general changes in group lying behaviours of pigs. The DT of a set of points on a plane is defined to be a triangulation such that the circumcircle of every triangle in the triangulation contains no point from the set in its interior, and the circumcircle of a triangle is the unique circle that passes through all three of its vertices (Hansen et al., Reference Hansen, Rödner and Bergström2001). It is one of the most popular techniques for generation of unstructured meshes and the principle of this method was originally developed from the study of structures in computational geometry (Jin et al., Reference Jin, Xu, Smeyers-Verbeke and Massart2006).
However, the model did not investigate in detail the mathematical relationships showing how pigs behave in different temperatures. Therefore, in this study, classification of pig group lying comfort was further studied using machine vision and an artificial neural network (ANN) technique.
The ANN is increasingly being applied to the dynamic modelling of process operations, pattern recognition, process prediction, optimizing, non-linear transformation, remote sensing technology and parameter estimation for the design of controllers (Nasirahmadi et al., Reference Nasirahmadi, Abbaspour-Fard, Emadi and Khazaei2014; Oczak et al., Reference Oczak, Viazzi, Ismayilova, Sonoda, Roulston, Fels, Bahr, Hartung, Guarino, Berckmans and Vranken2014). Some of the ANN applications in recent years have been in livestock-based research: dairy cattle (Grzesiak et al., Reference Grzesiak, Zaborski, Sablik, Żukiewicz, Dybus and Szatkowska2010), sheep (Kominakis et al., Reference Kominakis, Abas, Maltaris and Rogdakis2002; Tahmoorespur and Ahmadi, Reference Tahmoorespur and Ahmadi2012) and pigs (Oczak et al., Reference Oczak, Viazzi, Ismayilova, Sonoda, Roulston, Fels, Bahr, Hartung, Guarino, Berckmans and Vranken2014; Wongsriworaphon et al., Reference Wongsriworaphon, Arnonkijpanich and Pathumnakul2015). The performance of classifiers has a significant effect on machine vision outputs (Pourreza et al., Reference Pourreza, Pourreza, Abbaspour-Fard and Sadrnia2012), and the feed-forward neural network is one of the most powerful classifiers, which could be fast enough and acceptable for many processes (Khoramshahi et al., Reference Khoramshahi, Hietaoja, Valros, Yun and Pastell2014). The MLP network is a feed-forward network model which, with its simplicity, has the ability to provide good approximations and has been designed to function well in modelling data that are not linearly separable (Hong, Reference Hong2012). The complexity of the MLP network depends on the number of layers and neurons in each layer (Chandraratne et al., Reference Chandraratne, Kulasiri and Samarasinghe2007).
The frequent fluctuations in external air temperature in the United Kingdom make barn ventilation management difficult. Room temperature in a building for growing pigs is normally kept within their thermal comfort zone (at around 20°C), and the conventional measuring systems in commercial pig farms are based on only one or two air temperature sensors at fixed points above pig level (Mendes et al., Reference Mendes, Moura, Nääs and Bender2013). Therefore, finding a method that indicates the thermal experience of the pigs themselves by image processing could be a useful supporting technology to improve control of the ventilation system for better thermal comfort and welfare of pigs in the room.
In this study, different lying patterns (close, normal and far) under commercial pig farm conditions were defined and computed using the mathematical features of their lying styles. Then, based on DT features and using an MLP network, lying patterns were classified in different thermal categories. The lying model developed in this research is more accurate, faster and yields a precise mathematical model of room temperature category under commercial farm conditions and could be used as an input for room ventilation control systems.
Material and methods
Study area and animals
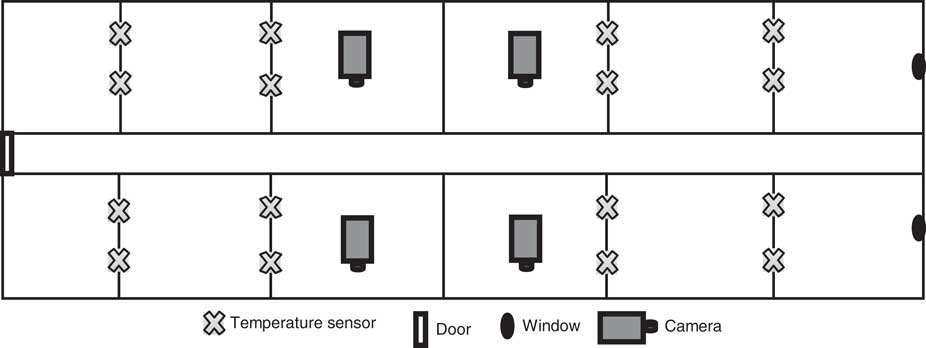
The study was conducted at a commercial pig farm in Stafford, UK. A series of rooms each housed 240 finishing pigs; rooms were mechanically ventilated and subdivided into 12 pens, each 6.75 m wide×3.10 m long and with a fully slatted floor. The white fluorescent tube lights were switched on during day and night. Room temperature was recorded every 15 min over the total experimental period with 16 temperature sensors (TE sensor Solutions, 5K3A1 series 1 Thermistor; Measurement Specialties Inc., Hampton, Virginia, USA) arranged in a grid pattern (Figure 1). Each temperature sensor was positioned around 20 cm above the pen walls (suspended from the ceiling), which was the nearest possible distance to the pigs without risk of damage. All sensors were set up and calibrated specifically for the experiment and the average of all sensors was used for room temperature calculation.
Schematic representation of research room showing the location of temperature sensors and cameras.

All pens were equipped with a liquid feeding trough and one drinking nipple. Four pens were selected for the experiment from the 12 pens in a room, each containing 22 pigs. The experimental phase started after placement of pigs in the pen at ~30 kg live weight and lasted for 15 days. The experiment was carried out in two periods (cold and warm seasons) giving different room temperatures, from 14°C in the first days as the batch started in the cold season up to 28°C in warm situations; the room setpoint temperature was 21°C during the days of the study.
Image processing
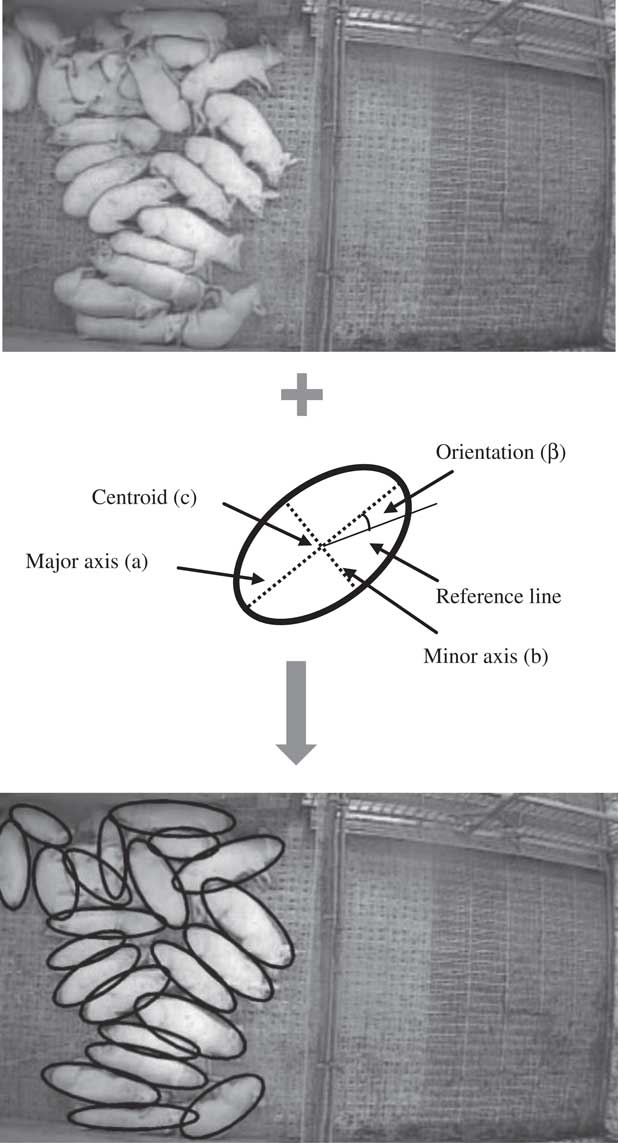
In this study, CCTV cameras (Sony RF2938, Board lens 3.6 mm, 90°; Visionhitech Co. Ltd, Gyeonggi-do, South Korea) were located directly above each pen, at 4.5 m from the ground, to get a top view. Cameras were connected via cables to a PC and video images from the cameras were recorded simultaneously for 24 h during the day and night and stored in the hard disk of a PC using Geovision software (GeoVision Inc., CA, USA) with a frame rate of 30 frames/s. The original resolution of an extracted image from the video was 640×480 pixels. In order to find the group lying pattern of pigs, image processing and the DT method were implemented in MATLAB® software (The MathWorks Inc., Natick, MA, USA), which is described in detail by Nasirahmadi et al. (Reference Nasirahmadi, Richter, Hensel, Edwards and Sturm2015). The direct least squares ellipse fitting method was applied to localize each pig in the image and ellipse parameters such as ‘major axis (a)’, ‘minor axis (b)’, ‘orientation (β)’ and ‘centroid (c)’ were determined for all fitted ellipses (Figure 2) (Nasirahmadi et al., Reference Nasirahmadi, Richter, Hensel, Edwards and Sturm2015). The perimeter, length of side of each triangle in the DT and ellipse features provided the data for computing the distance of each pig in a group to others and made it possible to calculate how closely pigs lie.
Application of the ellipse fitting technique to a group of lying pigs.

Lying pattern definition
By using the major and minor axis of each fitted ellipse (Figure 2), the overall lying pattern was determined as the following:
 $$\eqalignno{ & {\rm Overall} \,\,{\rm lying}\,\,{\rm pattern}\, {\rm (\,\%\,)\, {\equals}} \cr& \left ( {{{{\rm number}\,{\rm of}\,{\rm triangles}\,{\rm with}\,{\rm certain}\,{\rm pattern}} \over {{\rm number}\,{\rm of}\,{\rm all}\,{\rm triangles}}}} \right){\times}{\rm 100}$$
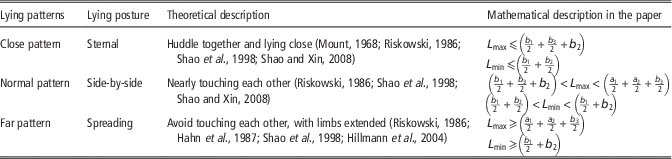
where the certain pattern was defined as ‘close pattern’, ‘normal pattern’ or ‘far pattern’ based on principles that have been reported previously for pigs’ lying postures in different temperatures (Table 1).
Group lying patterns of pigs with their subsequent mathematical description

L max=maximum length of side of triangle; L min=minimum length of side of triangle; b=minor axis of fitted ellipse; a=major axis of fitted ellipse.
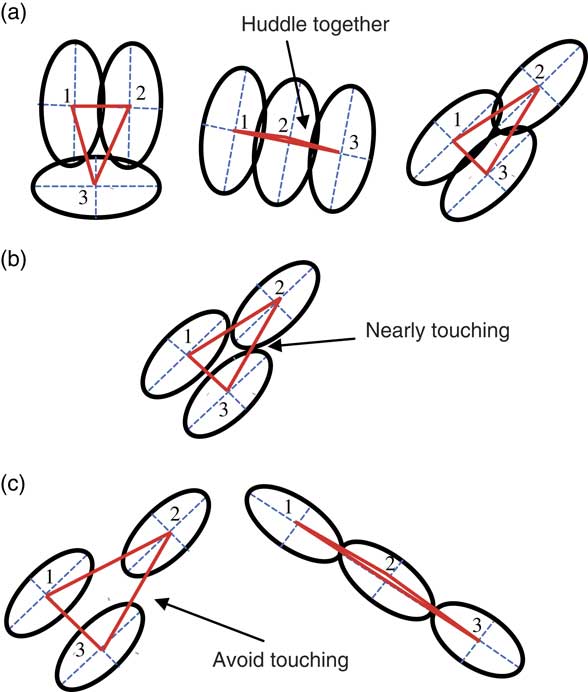
In cold conditions pigs crouch, sometimes shivering violently, and change their lying posture to support their body on their limbs and reduce conductive heat loss to the floor. They also huddle together to increase body contact with other pigs. In this study, we defined this as a ‘close pattern’; here the size of ellipses is considered almost uniform and the number for each pig in the model can be defined in any order. Based on the principles in Table 1, this category was recorded if three pigs presented a pattern like those shown in Figure 3a (all ellipses (pigs) or at least two of the three possible pairs closely touching each other). Therefore, in a close pattern, the maximum length of side of triangle (L
max) and minimum length of side of triangle (L
min) are equal to or less than
 $$\left( {{{b_{1} } \over 2}{\plus}{{b_{3} } \over 2}{\plus}b_{2} } \right)$$
and
 $$\left( {{{b_{1} } \over 2}{\plus}{{b_{2} } \over 2}} \right)$$
, respectively (Table 1).
Fitted ellipses in different lying patterns: (a) touching ellipses (black) with their parameters (blue) and a triangle of Delaunay triangulation (red) in cold situations (close pattern), (b) in normal situations (normal pattern) and (c) in warm situations (far pattern).

In warm conditions, pigs try to avoid touching each other, the limbs are stretched out and pigs lie extended on their side (Table 1). The image processing data showed patterns like those in Figure 3c, defined as ‘far pattern’. If three pigs are touching each other from head to head or head to tail (as sometimes happened in warm conditions), the L
max is greater than or equal to
 $$\left( {{{a_{1} } \over 2}{\plus}{{a_{2} } \over 2}{\plus}{{a_{3} } \over 2}} \right)$$
; furthermore, if three pigs do not touch or two partly touch and the third is far from the others (as happens in grouped pigs), the L
max is greater than or equal to
 $$\left( {{{a_{1} } \over 2}{\plus}{{a_{2} } \over 2}{\plus}{{b_{3} } \over 2}} \right)$$
. L
min in far patterns is greater than or equal to
 $$\left( {{{b_{1} } \over 2}{\plus}b_{2} } \right)$$
(Table 1).
In normal temperature conditions, pigs lie nearly touching each other and the resulting pattern is between the close and far patterns (Figure 3b), defined as ‘normal pattern’ (Table 1).
Artificial neural network development
An MLP was employed in MATLAB® software as the modelling network for classification. The MLP network applied here had four layers: an input layer, two hidden layers and an output layer. The number of neurons in the input layer was dependent on the number of features extracted from each triangle of the DT; in this study the perimeter (P), L
max and L
min of side of each triangle were calculated. Then the mean value of perimeter (MVP) of triangles, mean value of maximum lengths (MVL
max), mean value of minimum lengths (MVL
min) of side of triangles in each DT were considered as inputs for the ANN (three neurons). The output layer was equal to the number of categories; in this case we divided the room temperatures into three thermal categories, which were based on the room setpoint temperature: first for temperatures around (±2°C) the room set temperature (ARST: 19°C to 23°C), next for lower than the room set temperature (LRST: 14°C to 18°C) and third for those higher than the room set temperature (HRST: 24°C to 28°C). The categories LRST, ARST and HRST were represented with the sets of numbers 100, 010, 001, respectively. In order to simplify the problem with different ranges of values for the network, the data set was normalized within the range [0, 1] to achieve fast convergence and to ensure that all variables received equal attention during the process. The learning procedure for developing a neural network can be either supervised or unsupervised. The supervised learning algorithm used in this research was the back propagation algorithm (Chandraratne et al., Reference Chandraratne, Kulasiri and Samarasinghe2007). Before updating the weights once at the end of the epoch, this algorithm gets the average gradient of the error surface across all cases and minimizes the mean square error (MSE) between input layer values and output layer values. In order to achieve the optimum hidden layer, a trial and error procedure was used by trying various number of neurons and layers to build the network (Mashaly and Alazba, Reference Mashaly and Alazba2016), and the network that gave the lowest MSE of the verification subset was chosen. The two hidden layers of the selected network had different number of neurons, being 16 and 22, respectively. Lastly, the selected MLP network with 3-16-22-3 was used to evaluate the ability of this multivariable technique for classification. In this study, the MLP used a tansig function
 $\left( {y\,\,{\equals}\,\,{\rm tansig}\,(x)\,{\equals}\,{2 \over {1{\plus}e^{{{\minus}2x}} }}{\minus}1} \right)$
in the hidden layers and linear function (y=x) in the output layer. In general, data sets of 1800 observations with 600 observations (five temperatures in each category×120 frames for each temperature) for each of the three thermal categories were used. The ANNs were trained on the first subset (training set), and its performance was monitored using the second subset (validation set). In this method, the network stops the training before overfitting occurs, which a technique is automatically provided for all supervised networks in MATLAB Neural Network Toolbox™. Finally, the last subset (test set) was used to check the predictive performance of the network, as the data included in this subset were not used in the network development. Experimental data sets were randomly divided into training (70%; 1260 observations), validating (15%; 270 observations) and testing (15%; 270 observations) sets. For finding the classification performance, the sensitivity, specificity and accuracy (category-specific and the model’s overall performance) were computed based on the following definitions (Grzesiak et al., Reference Grzesiak, Zaborski, Sablik, Żukiewicz, Dybus and Szatkowska2010; Pourreza et al., Reference Pourreza, Pourreza, Abbaspour-Fard and Sadrnia2012):
 $${\rm Sensitivity}\,\,{\equals}\,{{{\rm TP}} \over {{\rm TP{\plus}FN}}}{\times}100$$
 $${\rm Specificity}\,\,{\equals}\,{{{\rm TN}} \over {{\rm TN{\plus}FP}}}{\times}100$$
 $${\rm Accuracy}\,\,{\equals}\,{{{\rm TP{\plus}TN}} \over {{\rm TP{\plus}FP{\plus}TN{\plus}FN}}}{\times}100$$
TP, samples of a specific category correctly classified as that category; FN, samples of a specific category incorrectly classified as other categories; TN, samples of other categories correctly classified as their categories; FP, samples of other categories incorrectly classified as the specific category. Assessment of the discrimination accuracy between different classes of individual models also involved the relative operating characteristic (ROC), which was computed in MATLAB® based on true positive and false negative rates (Pearce and Ferrier, Reference Pearce and Ferrier2000; Fawcett, Reference Fawcett2006) and can be used for assessment of binary classifiers (Barnes et al., Reference Barnes, Duckett, Cielniak, Stroud and Harper2010):
 $${\rm Sensitivity{\plus}false}\,{\rm negative}\,{\rm rate}\,{\equals}\,1$$
 $${\rm Specificity{\plus}false}\,{\rm positive}\,{\rm rate\,{\equals}\,1}$$
Equations (5 and 6) can be written as (Pearce and Ferrier, Reference Pearce and Ferrier2000)
 $$\left( {{w \over x}\,{\equals}\,1} \right){\plus}\left( {{v \over x}\,{\equals}\,1} \right)\,{\equals}\,1$$
 $$\left( {{w \over x}{\equals}\,0} \right){\plus}\left( {{v \over x}\,{\equals}\,0} \right)\,{\equals}\,1$$
where w is a predicted output greater or equal to the threshold probability and v a predicted output less than the threshold probability. In ROC, two values are calculated for each threshold: the true positive rate (the number of w, divided by the number of 1 target), and the false positive rate (the number of v, divided by the number of 0 targets) (Pearce and Ferrier, Reference Pearce and Ferrier2000). The area under the ROC curve (AUC) reflects the proportion of the total area of the unit square and ranges from 0.5 for models with no discrimination ability to 1 for models with best discrimination.
Results
Lying pattern
Table 1 shows the mathematical description of L max and L min obtained from the lying patterns. As the perimeter of each triangle is the sum of the length of sides (L) of each triangle, the P value (pixels) for each lying pattern is found as follows. In the close pattern
 $$P\,\,{\equals}\,\,L_{{{\rm max}}} {\plus}L_{{{\rm min}}} {\plus}L$$
 $$\buildrel {({\rm Table}\,{\rm 1}\,{\rm and}\,{\rm equation}\,{\rm (9))}} \over \longrightarrow P\,⩽ \left( {{{b_{1} } \over 2}{\plus}{{b_{3} } \over 2}{\plus}b_{2} } \right){\plus}\left( {{{b_{1} } \over 2}{\plus}{{b_{2} } \over 2}} \right){\plus}L$$
The maximum value of P happened when a triangle had two L max (isosceles) means
 $$L\,{\equals}\,L_{{{\rm max}}} \,(11) \buildrel {{{\rm equations}\,(10\,{\rm and}\,11)}} \over {-\!\!\!-\!\!\!-\!\!\!-\!\!\!-\!\!\!-\!\!\!-\!\!\!-\!\!\!-\!\!\!\longrightarrow} P\,⩽\left( {{{3b_{1} {\plus}5b_{2} {\plus}2b_{3} } \over 2}} \right)$$
In this study, by computing equation (12), the perimeter of each triangle to be considered as the close pattern gave P⩽200 (pixels).
In far pattern
 $$\buildrel {({\rm Table}\,1\,{\rm and}\,{\rm equation}\,(9))} \over {-\!\!\!-\!\!\!-\!\!\!-\!\!\!-\!\!\!-\!\!\!-\!\!\!-\!\!\!-\!\!\!-\!\!\!\longrightarrow} P\, ⩾ \left( {{{a_{1} } \over 2}{\plus}{{a_{2} } \over 2}{\plus}{{b_{3} } \over 2}} \right){\plus}\left( {{{b_{1} } \over 2}{\plus}b_{2} } \right){\plus}L$$
When triangle had two sides with L min value, so
 $$L\,{\equals}\,L_{{{\rm min}}} \quad (14)\quad \buildrel {{\rm equations}\,({\rm 13}\,{\rm and}\,14)} \over {-\!\!\!-\!\!\!-\!\!\!-\!\!\!-\!\!\!-\!\!\!-\!\!\!-\!\!\!-\!\!\!\longrightarrow} \quad P\ ⩾ {{a_{1} {\plus}a_{2} {\plus}2b_{1} {\plus}4b_{2} {\plus}b_{3} } \over 2}$$
The perimeter of each triangle in the far pattern, by calculation of equation (15), gave P⩾350 (pixels), with the normal pattern having perimeter values between these two, that is, 200<P<350 (pixels).
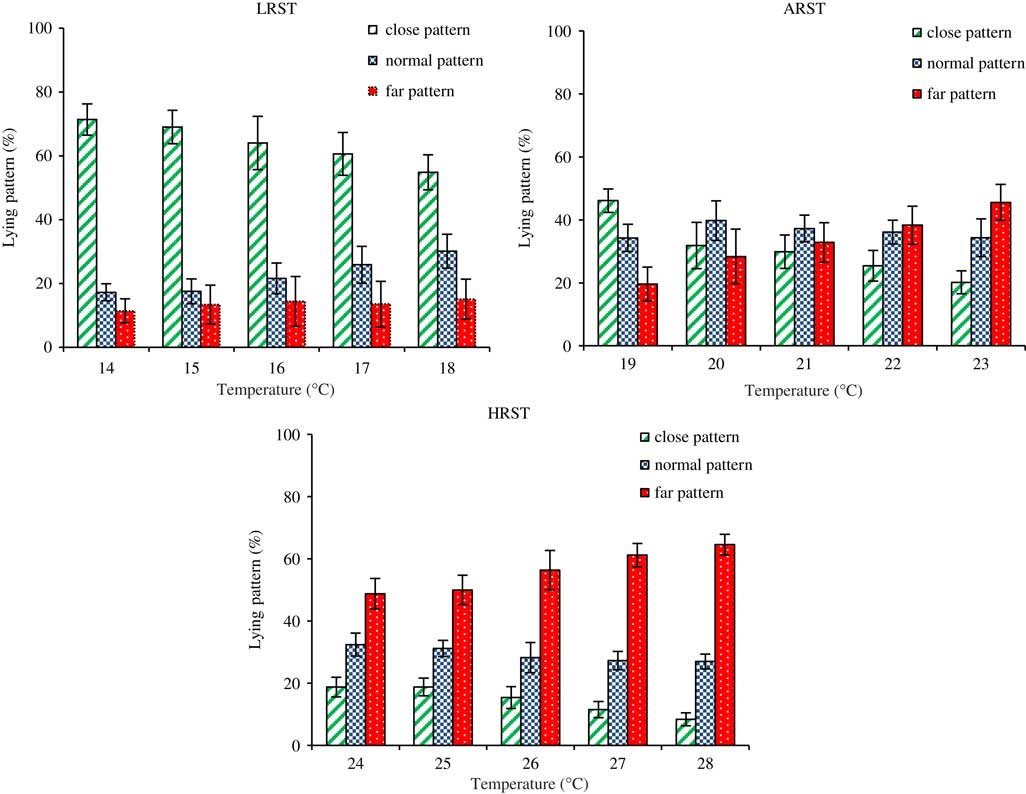
The three lying patterns for the mentioned thermal categories during this study, along with their temperature and SD bars, are shown in Figure 4. According to this figure, in the LRST category the percentage of close pattern declined from 71.4% to 54.8% as the temperature increased from 14°C to 18°C; the values for both normal and far pattern were increased from 17.2% to 30.1% and 11.4% to 15.1%, respectively. In the ARST category, with a temperature range of 19°C to 23°C, the percentage of close pattern showed a downward trend from 46.1% to 20.2%, whereas the far pattern showed an increase from 19.6% to 45.5%. As the temperature increased in the HRST category from 24°C to 28°C, the percentage of normal and close pattern declined from 34.4% to 27% and 18.8% to 8.4%, respectively. In this category, an increase of 4°C of temperature raised the far pattern by 16% (Figure 4).
The three lying patterns for each thermal category allocated with their SD bar. LRST=lower than room set temperature; ARST=room set temperature; HRST=higher than room set temperature.

Classification
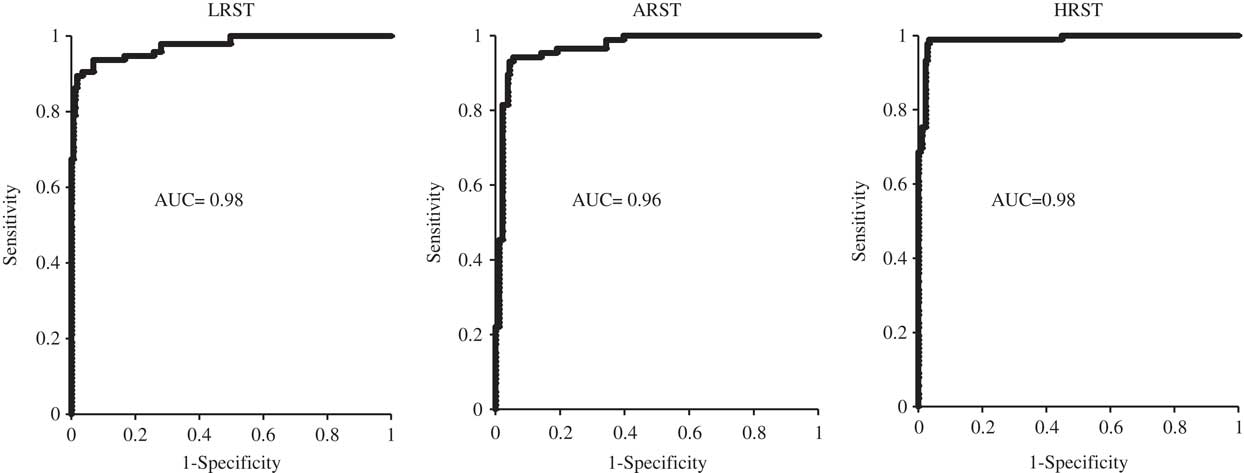
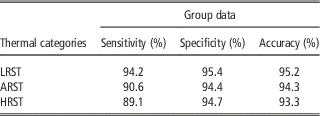
Table 2 shows the average, maximum and minimum values, SDs of the three extracted features (MVP, MVL max, MVL min) from each DT. According to the ANOVA results, the MVP, MVL max and MVL min differed significantly between thermal categories (all P<0.001). With the five temperatures in the range for the LRST category, the minimum value of each variable happened in the lowest temperature (14°C), whereas the maximum value was in the highest temperature (18°C). Furthermore, the same tendency was obtained for the other two thermal categories. The results obtained for the described MLP network showed that the selected neural network was able to correctly classify lying behaviours with overall accuracy 95.6% according to the different thermal categories, and with satisfactory sensitivity (from 89.1% to 94.2%), specificity (from 94.4% to 95.4%) and accuracy (from 93.3% to 95.2%), for the test set data (Table 3). Figure 5 presents the ROC curves for individual thermal categories, comprising both the sensitivity (equivalent to true positive rate) and complement of specificity to unity (equivalent to false positive rate). The AUC values obtained were 0.98 for the LRST, 0.96 for the ARST and 0.98 for the HRST test sets. The value of AUC represents the discrimination ability of a classifier (Grzesiak et al., Reference Grzesiak, Zaborski, Sablik, Żukiewicz, Dybus and Szatkowska2010) and the value for a realistic classifier should be >0.5, with the AUC range between 1 (best separation between the values) and 0.5 (no distributional differences between values) (Fawcett, Reference Fawcett2006).
The area under the curve (AUC) and the relative operating characteristic values of network test set. LRST=lower than room set temperature; ARST=room set temperature; HRST=higher than room set temperature.

Statistical data (average, minimum, maximum and SD) of the Delaunay triangulation features in different thermal categories

LRST=lower than room set temperature; ARST=room set temperature; HRST=higher than room set temperature; MVP=mean value of perimeters; MVL max=mean value of maximum length of triangles; MVL min=mean value of minimum length of triangles; ave=average; max=maximum; min=minimum.
All measures (MVP, MVL min and MVL max) differed significantly between temperature categories (P<0.001).
The artificial neural network analysis: sensitivity, specificity and accuracy for the test data set

LRST=lower than room set temperature; ARST=room set temperature; HRST=higher than room set temperature.
Discussion
Mathematical model of lying pattern
Results of pig lying patterns, described through the image processing techniques and using the DT features, showed that in the LRST category pigs at the lowest environmental temperature (14°C) adopted a body posture that minimized their contact with the floor and maximized contact with other pigs. As a result, the number of triangles with a perimeter of <200 pixels in the DT was higher, as a well as the percentage of close patterns. As the temperature increased in this category the number of huddling pigs declined, so the number of triangles with P⩽200 pixels decreased. On the other hand, in the HRST category, where the temperature range was between 24°C and 28°C, pigs lay down with their limbs extended in a fully recumbent position and tried to minimize their contact with pen mates. The number of triangles with perimeter of >350 pixels increased and the percentage of far patterns was higher than other patterns. The maximum value for far pattern in this group happened when the temperature was at the highest level (28°C), and the percentage of close pattern showed the lowest value in the study. This result is in agreement with other researchers (Shao and Xin, Reference Shao and Xin2008; Costa et al., Reference Costa, Ismayilova, Borgonovo, Viazzi, Berckmans and Guarino2014) who have reported that in higher temperatures pigs tended to spread out and in a cold situation they tried to huddle or touch each other. In the ARST category, because the situation was around the room setpoint temperature, pigs had more side-by-side patterns (Riskowski, Reference Riskowski1986; Shao et al., Reference Shao, Xin and Harmon1998) so that the percentage of triangles with 200<P<350 pixels was higher in this category. It needs to be considered that the value of P obtained from the DT features for different lying patterns depends on the age and size of pigs, so more study is needed for generalization of the method and determination of the values of P in relation to the size and age of pigs.
Classification model
It is generally difficult to develop a simple linear model to predict data with overlapping categories. Therefore, all three mentioned variables of the DT were assigned in the MLP network to identify the three thermal categories. As can be inferred from Table 3, the HRST category showed the lowest value of precision for the test data set, in which sensitivity was 89.1%, specificity was 94.7% and accuracy was 93.3%, whereas the values obtained for LRST were 94.2%, 95.4% and 95.2%, respectively. Shao et al. (Reference Shao, Xin and Harmon1998), who studied classification of swine thermal comfort using feed-forward network and binary image features (i.e. Fourier coefficients, moments, perimeter and area, combination of perimeter) in laboratory conditions (four chambers and ten pigs per chamber), obtained values of correctly classified samples of 78%, 73%, 86% and 90% for the test sets. Computing the mentioned binary image features in a commercial pig farm, with different pen structures, may increase the error of classification; for instance, some pigs tend to lie close to the walls, which makes the area or perimeter results inaccurate. Therefore, using a method for finding the centre of each pig and applying a precise mathematical method, the method used in this study, could increase the classification precision. In this study, the lower performance of ANN classification in HRST might be explained by the fact that, in higher temperatures, pigs increase the space they occupy and normally move to cooler places like the dunging area (Spoolder et al., Reference Spoolder, Aarnink, Vermeer, Riel and Edwards2012). As a result, the DT-extracted features could change more than in the usual situation. On the other hand, in the LRST condition, they huddle together more in an area which appears warmer to them, and the network could classify with better performance by using arranged DT features (Table 3). Developing a classifier with high performance could be a basic step for creating an automatic monitoring system for enhancing pigs’ welfare and, if the controller system of the environmental conditions can be based on the comfort behaviour of pigs, better welfare may be achieved (Shao et al., Reference Shao, Xin and Harmon1998). The technique presented in this paper allows classification of lying behaviour using an ANN on the basis of the DT features. As the experiment was run for a period of only 15 days, in pens with the same size and shape, the change in size of the pigs during this period was not great. Thus, further research is needed to model pigs with different sizes across a whole production batch, and pens with different structures should be considered in the model before making the method practicable for pig farms. The major advantage of applying a high performance classification system in commercial farm conditions is that the changes of lying behaviour in the different thermal categories, which mainly rely on the room set temperature, could be used in an automatic and continuous way with a large number of pigs and pens in non-laboratory situations. Changes in environmental temperature in pig farms result in alterations in body heat transfer and cause energy and meat production losses, so using an automatic image analysis and precise mathematical method can provide a less stressful situation for pigs and workers, and benefit economic outputs.
In the present study, the ventilation system in use was not capable of maintaining the room at a temperature around the setpoint temperature for periods in both cold and warm seasons. This illustrates the need to design more appropriate ventilation systems in commercial practice. However, a single room setpoint may not be the most appropriate for animals in different situations. Knowing the lying pattern of the pigs gives the possibility for farm managers to select the best room set temperature regarding their own animals and farm conditions. Connecting the proposed monitoring system to the room ventilation and potential heating or cooling system will be worthwhile to deliver better performance in an automated farm management system. As a result, more economic outputs and better animal welfare may be achieved.
Conclusions
In this study, it was shown that the developed multilayer network with a combination of DT features can be used in order to classify group lying patterns of pigs in different thermal categories with high sensitivity, specificity and accuracy (both specific and overall) in commercial pig farm conditions. Furthermore, the percentage of each defined lying pattern, obtained through calculating the perimeter of each triangle in the DT, changed significantly as the environmental temperatures increased. Using the proposed precise mathematical method for definition and classification of pigs lying behaviour could make an important contribution in the future to a fully automated system based on pig behaviour in commercial pig farm management. The proposed method is an important step towards improving animal welfare in commercial farm conditions with their changeable environmental parameters. However, this method needs further study for application of the data as an input for adjusting fan speed in rooms as an optimal method for controlling and adjusting the ventilation rate in a fully automated system.
Acknowledgements
The authors thank the Innovate UK project 101829 ‘Green Pigs’ and Midland Pig Producers for access to commercial pig facilities.