


1. Introduction
We shall consider the problem of determining the thermal properties of firn at Dome C, Antarctica, for use in mathematical models for heat transfer in the glacier. Such models are very valuable for understanding the dynamics and stability of glaciers (Reference RobinRobin 1955, Reference BogoslovskiyBogoslovskiy 1958, Reference Jenssen and RadokJenssen and Radok 1961, Reference Jenssen and Radok1963, Reference JohnsenJenssen 1977, Reference Weller, Schwerdtfeger and Busingerweller and Schwerdtfeger 1977, Reference WhillansWhillans in press), the effects of climate changes at the surface of the ice sheet, and the general process of heat transfer into the ice sheet. Accurate models could also be used to make reverse calculations from measured temperature profiles to derive past, decade-scale, climatic changes (Reference Budd, Jenssen and RadokBudd and others 1971, Reference Budd, Young and Austin1976, Johnsen 1975, Reference EwingEwing in press [b], Reference Ewing, Falk and NashedEwing and Falk in press) and to guide the choice of locations, techniques and needed accuracies for future field measurements.
The basic model equation that we will consider will be

for the temperature θ where ρ is the density, c is the specific heat, and K is the thermal conductivity of the firn or ice, and the subscript t denotes partial differentiation with respect to time. The v. ∇θ term models heat flow due to the physical transport of the firn. The term q is a measure of the heat generated internally. We shall concentrate on determining c and K, assuming that the other properties are fairly well understood.
As a first step in our modeling process, we shall consider a one-dimensional model equation to describe the temperature distribution as a function of depth z into the glacier. Then, for 0<z<D, we consider

where D is the thickness of the glacier. We make the physically motivated assumption that c and K change fairly slowly with depth, and we take small samples from firn cores in the field and determine the coefficients within each sample as a constant. We finally extrapolate the constants determined in this way to obtain spatially varying coefficients K and c.
The thermal conductivity obtained through our measurement process includes heat conduction through the ice matrix, vapor transfer, sensible heat transfer by convection, and possibly radiative processes. The relative importance of these mechanisms is not now known and our work must be considered as obtaining an “effective” thermal conductivity for the firn. Since our objective is to obtain error estimates for the coefficients determined, we developed a physical measurement apparatus which can produce the type of data necessary for a mathematical analysis of the problem. We shall describe the measurement apparatus, the techniques for obtaining the data, and some problems encountered with the “laboratory conditions” at Dome C. Next, we shall set up the mathematical model which requires the data we collect. We present results which show that the mathematical problem is well-posed, give estimates for the error incurred when the problem is solved using Inexact data, and then describe two different numerical solution techniques. The first method assumes that c is known and determines K, while the second determines estimates for both the specific heat and diffusivity simultaneously. We shall then discuss some data obtained by one of us (JFB) at Dome C, Antarctica, and present the numerical approximations and error estimates obtained through our procedure using this data.
2. Description of the Problem
In this section we shall describe the difficulties in obtaining accurate field measurements and how these difficulties motivated the techniques we have developed. We then describe the mathematical problem to be solved to obtain the desired thermal properties.
For most materials, in order to measure the thermal conductivity, one sets up an apparatus in a highly controlled laboratory setting which passes a large thermal gradient through a precisely measured sample of the material, allows the material to achieve thermal equilibrium, and then uses a steady-state temperature model to obtain the thermal properties. The process is usually repeated several times in order to obtain very precise values of the unknown properties.
The circumstances surrounding our measurement procedures are very different from those described above. First, exposure to the air and transport involving large temperature variations could dry out or melt the sample or radically change the thermal properties. Therefore the measurements must be made in the field instead of in a controlled laboratory environment. The “laboratory conditions” encountered at Dome C, Antarctica, were far from optimal. Temperatures of the “laboratory” were not within our control and varied diurnally, making it very difficult to obtain a static thermal equilibrium. Maintaining a constant voltage from the field batteries necessary for the heating and measuring process was also very difficult.
Next, a large temperature gradient placed across a thin firn sample would melt the sample and no further measurements could be made. Thus, a fairly low temperature gradient and a fairly thick sample are needed. Low thermal gradients are also required for conductivity measurements on saturated rocks at permafrost temperatures, as described in Reference KingKing (1979). The measurement apparatus used by Reference KingKing (1979) is similar to ours, but controlled laboratory conditions allowed thermal equilibrium to be attained and steady state models to be used. Since we could not allow thermal equilibrium to be reached at Dome C, we required a transient model in our measurement process.
In our experiments with firn samples, there are no transport terms or internal heat generation; thus, under the assumption that K is a constant within the sample, (1.2) can be written in the form

where D' is the thickness of the sample, and A = K(pc)−1 is the local diffusivity of the medium. The density and specific heat are assumed to be known constants in our first method. Therefore, the determination of a constant K is equivalent to the determination of the constant A. We can determine an initial temperature through the sample and can measure the boundary temperatures in time. This naturally leads to the mathematical problem: find a constant A>0 and θ = θ(z,t) satisfying

If A were known, the initial-boundary-value problem in (2.2) would determine a unique Θ = Θ(z,t). Since A is unknown, we shall over specify the boundary data by measuring the heat flux H at z = 0 and some time t = t*. We then add to (2.2) the condition that, for some t*ε(0,T),

The determination of a unique A from (2.2) and (2.3) for arbitrary data g1, g2, f0, and H is not possible. For example, if g1, g2 and f0 are 0, then H = 0 and there is no heat flow. Clearly any A>0 would then satisfy (2.2) and (2.3) with zero data. Thus our mathematical problem is not well-posed in the mathematical sense (Reference Douglas and JonesDouglas and Jones 1962, Reference CannonCannon 1964, Reference Cannon and ChateauCannon and du Chateau 1973, Reference FalkFalk 1978, Reference Ewing and FalkEwing and Falk 1979, Reference Ewing, Falk and Nashedin press, Reference Ewing, Falk, Bolzan and WhillansEwing and others 1981, Reference FalkFalk in press). We are thus faced with three major problems: (1) to find types of data f0, g1, g2, H, and assumptions on A which allow us to prove that a solution to (2.2) and (2.3) exists, is unique, and depends continuously upon the data, (2) to set up an experiment which can be performed in the field which will yield the data needed in (1), and (3) to do a complete error analysis and interpretation of the resulting model problem.
3. Description of the Measurement Apparatus and Procedure
We shall next describe the experimental apparatus and the experiment which was performed at Dome C, Antarctica, to yield our field data. The physical apparatus consists of a stack of control cylinders of lucite, the sample cylinder, and plates of copper containing thermistors. The stack is shown in Figure 1.
Cross-section of apparatus used to measure thermal conductivity of firn samples. Apparatus is shown buried in a shallow pit.

The apparatus was first tested in Antarctica dur ing the 1978–79 field season. By allowing the stack to remain in operation for up to 12 h to approach steady-state conditions, we determined that there was excessive heat loss from the sides of the stack and the data were then useless for the designed analysis. The stack was redesigned before the 1979–80 field season by including a thick styrofoam sleeve for better insulation around the stack. This reduced the heat loss from the sides of the stack to a very low level. Unfortunately, we were not able to run the experiment to steady-state during the 1979–80 field season to quantify this level closely.
The redesigned stack is well-insulated around the top and sides, and was set onto the ice floor of the measuring pit. The ice floor served as a heat sink, the heater served as a heat source, and the thermistors allowed the measurement of the time rate of change of the temperature through the stack. The thermistors allowed us to obtain temperature measurements as a function of time on both sides of the sample and on both sides of each lucite cylinder. Since the thermal properties of the lucite were known, we were able to solve initial boundary-value problems in the lucite and thus determine the heat flux at the ends of the sample and measure the total heat flow through the stack, which indicated any appreciable heat loss from the sides through the insulation. The stack was allowed to reach an essentially steady-state temperature distribution before the heater was turned on. The initial temperature was assumed to be linear through the sample and thus determined by the initial temperature measurements taken at the ends of the sample just prior to activating the heater. This thermal equilibrium also yields the following compatibility conditions on the data which are necessary for the numerical error estimates:

In order to obtain as strong a gradient as possible through the ice, and thus better error estimates as described in Section 4, we wanted g1(t) to rise rapidly and g2(t) to stay nearly constant or rise slowly. This was the motivation for using the ice-pit floor as a heat sink during the experiment.
The resistances of the thermistors (and thus the temperatures via calibrations of the thermistors) were measured together with an estimated error tolerance at uniform intervals of 1 min for the first hour and uniform intervals of 5 min for the duration of the experiment. The duration of the experiments ranged from 1 h 30 min to 2 h. The distance of the samples from the top of the core and their densities were also carefully measured in the field. For a more complete description of the measurement procedure and equipment, see Reference Ewing, Falk, Bolzan and WhillansEwing and others (1981).
4. The Mathematical Problem
In this section we shall present conditions which, if satisfied, allow us to show that a solution to our mathematical problem (2.2) – (2.3) exists, is unique, and depends continuously upon the data. We shall then give error estimates for the mathematical problem based on these assumptions.
We normalize our problem. Let z = 0 and z = 1 be the top and bottom of the sample, let g1 = g1(t) and g2 = g2(t) be the measured temperatures at the top and bottom of the sample, respectively, let H be the measured heat flux at the top at some time t*ε(0,T), and let f0 = f0(z) be the initial linear temperature distribution through the sample. We then obtain (2.2, 2.3) with D' replaced by 1 and

We shall seek A satisfying (2.2) and (2.3) and the additional physical bound

From the field experiment, we see that g1(t) increases much faster than g2(t). In particular, we have from our experimental data that for t* from (2.3)

Using Fourier series techniques, and techniques from Reference Carslaw and JaegerCarslaw and Jaeger (1959) and Reference CannonCannon (1964), we can obtain a solution, depending upon A, for (2.2) and (2.3) of the form for 0<z<l and 0<t<T,

where

Next, for αεℝ we define the continuous function

.

In Reference Ewing, Falk, Bolzan and WhillansEwing and others (1981), it was shown that for a ᾱε[A*, A*], and Q and θ defined above, we have

Thus for ᾱε[A*, A*] and data satisfying (4.2), Q is monotonically increasing and continuous. These facts allow us to obtain an existence and uniqueness theorem for our problem as in Reference Ewing, Falk, Bolzan and WhillansEwing and others (1981) for Hε[Q(A*), Q(A*)] and data satisfying (4.2). We next consider how this solution depends upon measurement errors in the problem. Let

Then assume H, g1, and g2 are obtained as H* 1 and g* 2 subject to measurement errors of the form

Also define Q*(α) as the analogue of Q from (4.5) for the problem with g1, g2 and H replaced by g* 1, g* 2 and H*.
Using the above notation, we obtain the following theorem which yields the continuous dependence of the solution of our problem upon the data. Theorem 4.1 If a ε[Q(A*), Q(A*)], A satisfies (2.2) and (2.3), and H* satisfies

then, for G from (4.7) and ε0, ε1 and ε1 ' from (4.9),

where

Proof: For details of the proof see Reference Ewing, Falk, Bolzan and WhillansEwing and others 1981).
5. Description of Numerical Methods
Before we discuss the method for numerically obtaining an approximate solution for (2.2) and (2.3), we describe how the numerical data were obtained. First the recorded resistance data from the thermistors were numerically converted to temperature data and smoothed very slightly, staying well within the error bars for the data (see Table I). This gave us g1 *and g2 * at 1 min intervals for the first hour with ε1 from (4.9.b) approximately 0.03°C. Then, in order to obtain H* for (4.9.a), a separate boundary-value problem was solved numerically within the top lucite region where the thermal properties of lucite were known.
A piecewise linear Galerkin spatial discretization was used with a fourth order in time backward differentiation multistep method (Reference EwingEwing in press [a], Bramble and Ewing in preparation•). A special start up procedure (Bramble and Ewing in preparation•) was required. The flux at the bottom of the lucite was then computed and used as H*, the flux at the top of the sample, in Equation (4.9a). The numerical results are presented in Table I. Computer programs are available at reasonable expense.
From Theorem 4.1, if we can find a diffusivity a'ε[A*,A*] such that Q*(a') is close to our calculated flux H*, then a' will be a good approximation to the unknown A. To determine such an a1 computationally, first find a1 and a2 ε[A*,A*] for which

Then pick sufficiently small error tolerance ε3 and perform an interval-halving routine using a1 and a2 to start. At each step of the interval-halving routine, pick the mid-point α of the active interval as a guess for A, numerically solve an initial-boundary value problem using α, g* 1, and g* 2, and then compare the calculated flux using α with H*. The numerical procedures used in each step of this interval-halving routine are the fourth order multistep Galerkin procedures used for the lucite problem. The routine is terminated when an is determined, satisfying

where ϕz(0,t*;a0) is the computed approximation of the derivative at z = 0 and t = t* of the problem of determining θ(z,t;a) satisfying:

The numerical scheme used satisfies the estimate

where (Reference EwingEwing in press [a], Bramble and Ewing in preparation*)

ε4 can be made very small with the proper choice of the spatial mesh size ∆z and temporal step size ∆t. Then, combining (5.2) and (5.4), we see that (4.10) is satisfied with a' = an and ε2 = ε3 + ε4. Using (4.11), we obtain

an error bound for the accuracy in our coefficient determination problem. (5.6) is not a “sharp” estimate, but merely an upper bound for the error.
NUMERICAL COMPUTATION OF g1, g2, AND H*

6. Intersecting Graph Techniques
So far, we have based our method for determining A (and thus K) upon the premise that we have a priori knowledge of the specific heat c. In many cases, we may not have accurate estimates of either the specific heat or the thermal conductivity. We next describe an Intersecting graph technique used for similar problems, by Reference Cannon and ChateauCannon and du Chateau (1973). We will obtain approximate pairs (K,c) for this more difficult problem.
Since we do not have a priori knowledge of c as before, we shall perform the same method with the flux measured at a fixed t = t* for a systematic sequence of values of c in the anticipated range. Each value of c will then determine a pair (c,K) through this procedure. If sufficiently many values of c are chosen at close Intervals, we will in effect determine the “graph” of the “function” K = K(c) for the fixed time, t*. For another choice of t = τ at some distance from t*, we can repeat the process with the same set of values for c to obtain a new “graph” of K = (c) for the same material. We hope that by taking radically different values of t we can obtain two curves with different properties. The true parameters (c,K) should He on the intersection of the curves determined in this way.
We emphasize that the determination of each “point” (c,K) in this method entails the full numerical method of section 5. Therefore, since several “points” are necessary to determine two curves and their intersection by graphical techniques, this procedure requires considerably more computer time than the previous method. However, if one is uncertain of the values of c, one should always use this method of “check” the proposed values.
7. Numerical Results from Dome C Data
In this section we shall present the numerical results obtained by applying our various methods to the data collected at Dome C, Antarctica. We then discuss data accuracies and corresponding error bounds. After presenting the results we shall compare them to previously known or assumed values of the various thermal properties under consideration and give our interpretation of the similarities and differences.
Only four samples were tested in our measurement apparatus at Dome C during the 1979–80 field season. On one of these test runs, the printer ran out of paper after twenty minutes and the run was aborted. The sample was later retested, but the data obtained were sufficiently anomalous that the results will not be presented. Thus the results of only three runs will be presented. The general data are given in Table II. The error in smoothing the data and the values of H* determined numerically are given in Table I.
As we have noted earlier, the basic numerical model described in section 5 required the specification of the specific heat of the sample. The temperature variations within all of the samples over the runs fell between the values of -29.9°C and -37.3°C. The first numerical results were obtained using an estimate for the specific heat of ice in this temperature range of 1.88 × 10³ J kg−1 K−1. The numerical results obtained using this value for specific heat and t* = 60 min are given in Table III. To start the numerical procedures, we used A* = 1.7 × 10⁻⁷ and A* = 1.7 × 10⁻⁶ in units of m2 s−1. As the procedures ran, better choices of A* and A* were obtained.
DOME C CONDUCTIVITY RUNS, 1979

CONDUCTIVITY RESULTS USING c = 1.88 × 10³ J kg−1 K−1 AND t* = 60 min

CONDUCTIVITY AND SPECIFIC HEAT RESULTS USING THE INTERSECTING GRAPH TECHNIQUE

Since we realized that the value of 1.88 × 10³ for c used in the numerical procedure was only an approximation based on the value for ice and since the specific heat depends to some extent upon density, we decided to use the intersecting graph technique described in section 6 on the same data to estimate both the specific heat and the thermal conductivity simultaneously. This procedure was carried out for each sample using t* = 60 min and τ = 90 min. The numerical results obtained by using the intersecting graph technique are presented in Table IV.
We note that the specific heats determined numerically from the field data were all somewhat higher than the specific heat of ice at the given temperature. The higher values of specific heat give lower values of diffusivity and conductivity. The values of thermal conductivity obtained here agree fairly well with the values obtained by Reference Dalrymple, Lettau, Wollaston and RubinDalrymple and others (1966), which are interpreted by Reference Weller, Schwerdtfeger and BusingerWeller and Schwerdtfeger (1977). We also note that the values of d1ffusivity in units of m2 a−1 presented in Table IV are very close to the value of 24.6 m2 a−1 obtained using a slight linearization of the model presented by Reference LaxLax(1979). The d1ffus1v1t1es obtained by using c = 1.88 × 10³ and presented in Table III, however, are much higher than the 24.6 m2 a−1 estimate. We also note that conductivities correlate fairly well with density for this very narrow range of samples. If this correlation were understood better and were shown to hold in more widely varying circumstances, It might be used to help model diffusivity more accurately over wide variations of densities.
We point out that although the diffusivities obtained from Table IV are close to the expected values, the specific heats, and thus the thermal conductivities, are somewhat higher than expected. We also note that the thermal conductivity of ice is in the range 2.1 to 0.92 W m−1 K−1, and we would expect the conductivity of firn to be somewhat lower.
Next, we briefly discuss error bounds for our methods. We emphasize again that the estimates obtained in (5.6) are not sharp, but are merely upper bounds. The mesh spacings ∆z and ∆t were taken such that ε4 ≈.01. Since determination of ε0 involves a numerical solution of an initial boundary-value problem we can argue as Ewing and others (1981) that

where, like ε4,

and g0(t) and g*1 0(t) are the true and the measured temperatures at the thermistor at the top of the top ludte control cylinder. It is very difficult to obtain the theoretical estimates for the size of the error between g0, g1, g2, and the measured (smoothed) data g* 0, g* 1, and g* 2. Estimates based on the size of the difference quotients and the smoothness of g0, g1, and g2 are, with our scalings,

and

Rough estimates of K1 and K2 from Equation 4.1 are

Thus, combining (7.1)–(7.4), we obtain

The error tolerance in the interval-halving routine was ε3 = 10−7. Thus (5.6) yields the estimate

We can then obtain an approximate error tolerance from an estimate on the size of G.
We shall present an estimate of G for the 4.8 m sample. Estimates for the other samples are obtained in an analogous fashion. For this sample

and

Thus, from (4.7) we see that

Then, combining (7.6) and (7.9), we obtain the bound on the error tolerance in m2 s−1 of

We emphasize that this is an upper bound for the error since (7.9) is a gross upper bound on 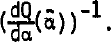

and (7.9) can be replaced by

For c = 2440 in the 4.8 m sample we use the results of the interval halving scheme to obtain the estimate

Combining (7.12) and (7.13) we obtain the estimate in m2 s−1

Our accuracy is basically limited by the data measurement accuracy and not by the mathematical and computational tools used. We also found that, although the numerical methods were somewhat complex, the results Indicated the stability of the methods by producing very smooth “curves” in the intersecting graph technique.
8. Acknowledgements
The authors would like to thank Bernard Cummiskey for extensive computational work on the methods described. This work was supported by US National Science Foundation grants DPP78-23834, MCS78-09525, MCS78-02737, DPP76-23428, and US Army contracts DAAG29-75-C-0024 and DAAG29-79-C-0120.



