Obesity and depression pose global major health concerns that impair quality of life and raise the risk for CVD and certain cancers, contributing substantially to worldwide mortality and morbidity rates(Reference Cao, Xu and Li1). A biological convergence underlying the cardiometabolic and mental disorders is driven through shared mechanisms including immune inflammation, oxidative stress and neuroendocrine dysregulation(Reference Milaneschi, Simmons and van Rossum2). Obesity may promote depressive symptoms through activating neuroinflammation via the release of proinflammatory adipokines, while depression may often lead to poor dietary choices, disrupt sleep patterns and reduce physical activities, consequently increasing the risk of weight gain(Reference Fulton, Décarie-Spain and Fioramonti3). Critically, the escalating prevalence of obesity-depression comorbidity and its associated mortality risk underscore the urgent need for further intervention strategies addressing these shared biological mechanisms.
Marine-derived n-3 polyunsaturated fatty acids (PUFA), EPA and DHA have attracted considerable attention for their promising potential in addressing both cardiometabolic and mood disorders(Reference Wu, Chen and Chang4,Reference Suneson, Söderberg Veibäck and Lindahl5) . However, evidence of population-based epidemiology regarding marine-derived PUFA in relation to obesity-depression comorbidity is limited. A previous cross-sectional study showed that the obese adolescents with higher levels of serum n-3 PUFA had lower odds of depressive symptoms(Reference Seabra da Silva, de Piano Ganen and Masquio6). In contrast, consensus regarding the effects of PUFA supplementation on obesity-related depressive symptoms remains elusive. One prior randomised controlled trial (RCT) in women with comorbid depression and overweight/obesity found that 12 weeks of n-3 PUFA supplementation (EPA 1080 mg/day plus DHA 720 mg/day) significantly reduced both depressive symptoms and body weight(Reference Keshavarz, Mostafavi and Akhondzadeh7). In contrast, another RCT among females with this obesity-depression comorbidity using a lower dose (EPA 620 mg/day plus DHA 545 mg/day) for 3 weeks failed to demonstrate similar benefits(Reference Tabasi, Mostafavi and Oreyzi8). These inconsistent findings may be mainly attributable to differences in treatment duration, dosage levels, the EPA:DHA ratio (3:2 v. 1·14:1) and depression assessment (DSM-5 diagnosis by a semi-structured review v. BDI-II).
The mechanisms underlying the benefits of n-3 PUFA on the comorbidity remain to be elucidated. Preclinical studies have demonstrated their potential benefits in counteracting mood disturbances induced by high-fat diets, with EPA appearing more effective than DHA in mitigating neuroinflammation linked to brain gliosis. These effects may involve enhanced serotonin neurotransmission, suppression of hyperphagia and attenuation of depressive behaviors(Reference Lin, Cheng and Liu9,Reference Demers, Roy and Machuca-Parra10) . Network Pharmacology (NP) has emerged as a transformative approach for elucidating key molecular and pathway-level mechanisms of dietary components(Reference Chen, Li and Chen11). By integrating systems biology, bioinformatics and pharmacology, NP provides a robust framework for addressing complex disease mechanisms and multidimensional interactions. Unlike traditional single-target pharmacology, NP examines intricate interplays within molecular networks and pathways involved in both disease progression and therapeutic interventions.
Given the comprehensive effect of marine fatty acids on clinical outcomes and inflammatory states, we used an integrated approach combining population-based epidemiology with NP to determine the relationship between serum-based biomarker of marine n-3 PUFA, inflammatory process and obesity-comorbid depression. Our epidemiology analysis utilised the data from National Health and Nutrition Examination Survey (NHANES) to investigate the association between serum n-3 PUFA and obesity-comorbid depression, while NP analyses further explored underlying mechanisms in this association. This integrative methodology facilitates the identification of molecular targets and provides profound insights into the biological mechanisms involved, potentially bridging gaps in previous research and enhancing understanding of marine n-3 PUFAs’ therapeutic potential in managing the complex interplay between obesity and depression.
Methods
Study participants
NHANES, administered by the Centers for Disease Control and Prevention, is a nationally representative, multistage, stratified sample cross-sectional survey conducted in the USA. It comprises both interview and physical examination, encompassing demographic, socioeconomic, dietary and health-related questions, as well as physiological measurements, laboratory tests and other data collected by highly trained medical personnel(Reference Johnson, Paulose-Ram and Ogden12). The design and methodology of NHANES are thoroughly documented and publicly available(13). The National Center for Health Statistics approved the ethical protocols for this survey, and all participants provided written informed consent. The NHANES data are publicly available at https://wwwn.cdc.gov/nchs/nhanes/default.aspx.
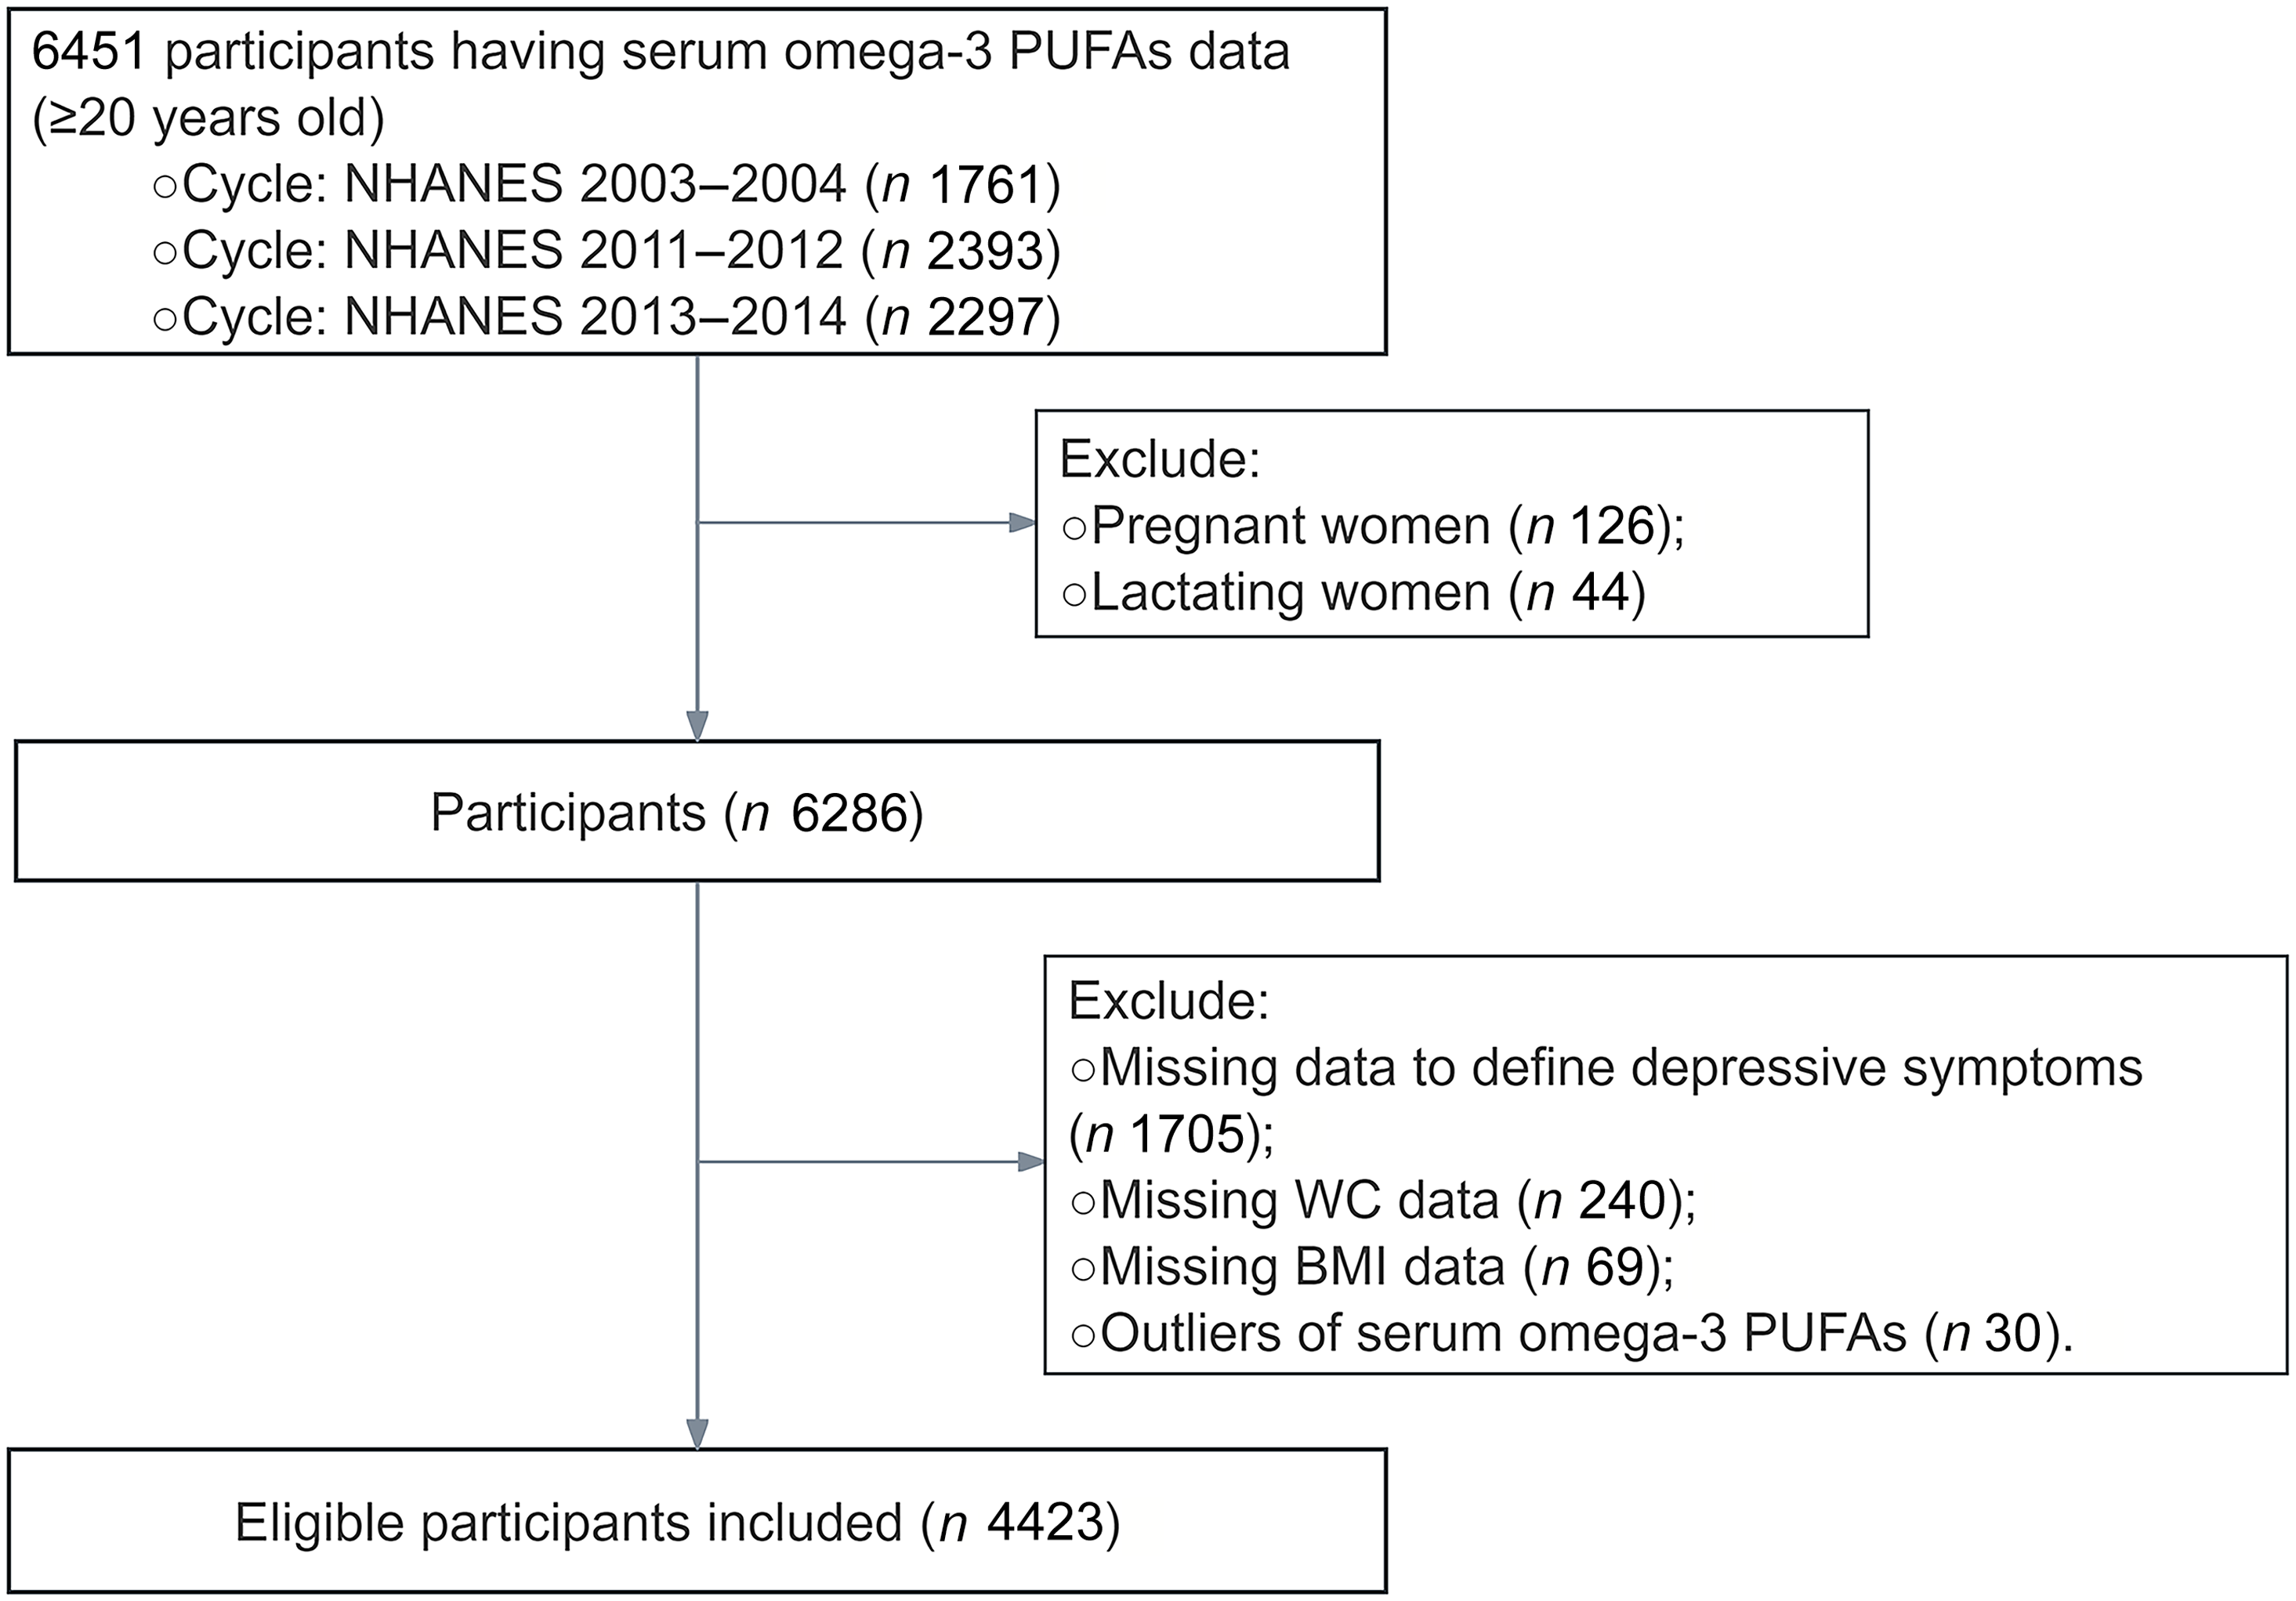
We performed a secondary analysis of data from the NHANES cycles of 2003–2004, 2011–2012 and 2013–2014. A total of 6,451 adults aged ≥ 20 years were enrolled, with available measurements for serum n-3 PUFA, specifically EPA, DPA and DHA. As outlined in the study flow chart (Figure 1), we initially excluded pregnant women (n 126) and lactating women (n 44). Subsequently, individuals with missing value for BMI (n 69), waist circumference (WC) (n 240) and depression assessments (n 1705) were excluded. Additionally, outliers for serum n-3 PUFA levels (n 30) were removed based on a range of mean ± 3 sd. After these exclusions, a total of 4,423 participants were included in the final analysis.
Flow chart for the selected participants in the current study.

Assessments of serum n-3 PUFA
Serum concentrations (μmol/L) of n-3 PUFA were measured using the gas chromatography (GC) as described previously from Lagerstedt et al.(Reference Lagerstedt, Hinrichs and Batt14) Total fatty acids were obtained through hexane extraction of the matrix (100 μL of serum), alongside an internal standard solution containing eighteen stable isotopically labelled fatty acids, used to account for recovery. Additional details on the distributions of serum n-3 PUFA levels are presented in Table S1 In this study, serum EPA, DPA and DHA were examined individually and in combination as total long-chain n-3 PUFA (EPA + DPA + DHA) in relation to obesity comorbid depressive symptoms. We analysed individual n-3 fatty acids because EPA, DPA and DHA may have distinct biological roles, and the relative contribution of each fatty acid to obesity-comorbid depressive symptoms remains unclear.
Ascertainment of obesity comorbid depressive symptoms
In accordance with the 2016 obesity guidelines issued by the American Association of Clinical Endocrinologists and the American College of Endocrinology, general obesity was defined as a BMI value ≥ 30 kg/m2 for USA adults, while central obesity was defined as a WC value ≥ 102 cm for males and ≥ 88 cm for females(Reference Garvey, Mechanick and Brett15). Depressive symptoms were assessed using the three approaches as bellow: (1) diagnosis from the Composite International Diagnostic Interview in NHANES 2003–2004; (2) total scores ≥ 10 on the Patient Health Questionnaire-9 in NHANES 2011–2012 and 2013–2014 or (3) the use of antidepressants. The Composite International Diagnostic Interview is a standardised diagnostic tool assessing Panic Disorder, Generalised Anxiety Disorder and Depressive Disorders, aligned with the diagnostic criteria of the International Classification of Diseases, Tenth Revision and the Diagnostic and Statistical Manual of Mental Disorders, Fourth Edition. The Patient Health Questionnaire-9 is a nine-item depression scale (0–27 range), with a Patient Health Questionnaire-9score ≥ 10 indicating major depressive symptoms(Reference Levis, Benedetti and Thombs16). In this study, general obesity comorbid depressive symptoms (GODS) and central obesity comorbid depressive symptoms (CODS) were defined as the co-occurrence of general or central obesity with depressive symptoms, respectively.
Determinations of inflammatory biomarkers
Candidate inflammatory indices were calculated using established formulae (Table S2). The inflammatory biomarkers included the lymphocyte:HDL ratio (LHR), monocyte:HDL ratio (MHR), neutrophil:HDL ratio (NHR), platelet:HDL ratio (PHR), Aggregate Index of Systemic Inflammation (AISI), Systemic Immune-Inflammation Index (SII), and Systemic Inflammation Response Index (SIRI).
Assessment of covariates
Unbalanced variables in participant characteristics, including demographic, lifestyle and concurrent disease factors, were adjusted as covariates. Demographic covariates comprised age, gender, ethnicity, marital status, education levels and poverty:income ratio. Lifestyle covariates included smoking status (smokers: lifetime use of ≥100 cigarettes)(Reference Tao, Liu and Ma17), drinking status (drinkers: ≥12 alcoholic beverages/year)(Reference Zhou, Zhao and Ma18) and leisure-time physical activity (low: <500 metabolic equivalent [MET] min/week; moderate: 500−1000 MET min/week; high: >1000 MET min/week)(Reference Piercy, Troiano and Ballard19). Concurrent diseases including trouble sleeping, hypertension, diabetes, dyslipidaemia, cancer and CVD, were assessed via self-reported physician diagnoses. Trouble sleeping was defined as a positive response to either, ‘Did you have a lot more trouble than usual sleeping for these two weeks?’ or ‘Have you ever told a doctor or other health professional that you have trouble sleeping?’. Hypertension was diagnosed as systolic blood pressure (SBP) ≥ 140 mmHg and/or diastolic blood pressure ≥ 90 mmHg, antihypertensive medication use, or physician diagnosis. Diabetes was defined as HbA1C ≥ 6·5 %, fasting plasma glucose ≥ 7 mmol/L, hypoglycaemic medication use or physician diagnosis. Dyslipidaemia was classified as total cholesterol > 200 mg/dL, TAG > 150 mg/dL, LDL-cholesterol> 130 mg/dL, HDL-hcholesterol ≤ 40 mg/dL, hypolipidaemic medication use or physician diagnosis. CVD included self-reported diagnoses of congestive heart failure, coronary heart disease, angina, myocardial infarction, or stroke.
Data analyses
Statistical analysis accounted for the complex multistage probability sampling design of the NHANES. Survey-weighted analyses incorporating sampling weights, strata, and primary sampling units were applied to obtain nationally representative estimates of the USA civilian non-institutionalised population according to NHANES analytic guidelines. The weights adjust for unequal probabilities of selection, oversampling and nonresponse. All statistical descriptions and estimates, including prevalence and regression coefficients, were calculated using appropriate NHANES examination or subsample weights depending on the variable of interest. When multiple NHANES cycles were combined, 2-year weights were recalculated by dividing by the number of combined cycles according to official guidelines. Categorical data were expressed as counts with weighted percentages, while continuous data with skewed distributions were described using weighted medians and interquartile ranges (25th, 75th percentile). To assess baseline differences according to n-3 PUFA tertiles, Pearson’s χ 2 test was employed for categorical variables, and Kruskal–Wallis test was applied for non-normally continuous variables.
In statistical analyses, skewed data were log-transformed prior to analysis, and the distributions of log-transformed data are presented in Figure S1. To ensure normality, the assumption of the log-transformed continuous data was further evaluated using the Kolmogorov–Smirnov test. To examine the association serum n-3 PUFA and general/central obesity comorbid depressive symptoms, multivariate-adjusted logistic regressions were performed to calculate OR and CI. Serum n-3 PUFA levels were modelled both categorically (as tertiles, with the lowest tertile as the reference) and continuously (per 1-sd increment). Three sequential models were constructed: model 1 adjusted for age, gender, race, poverty:income ratio, marital status and education level; model 2 additionally adjusted for smoking status and model 3, as the full model, adjusted for hypertension, diabetes, dyslipidaemia, CVD and cancer. To assess the potential trend across tertiles, P for trend was calculated by modelling tertiles as continuous variables. Subgroup analyses, stratified by age, gender, smoking status, drinking status, leisure-time physical activity, hypertension, diabetes, dyslipidaemia, CVD and cancer, were performed to explore potential effect modifications. To evaluate the effect modification by stratification variables, we added interaction terms (serum n-3 PUFA × strata) to the multivariable logistic models. Sensitivity analyses were conducted to assess the robustness of the findings by: (1) fitting the restricted cubic spline model with three knots at the 10th, 50th and 90th percentiles to assess potential non-linear relationships; (2) repeating the analyses after multiple imputation for missing values using the ‘mice’ package in R and (3) reanalysing the data after inclusion of participants with outlying PUFA levels.
In further descriptive and exploratory network pharmacology (NP) analyses, targets of DHA were retrieved from the Comparative Toxicogenomics Database, the Drugbank, SuperPred and SwissTargetPrediction databases(Reference Davis, Wiegers and Sciaky20–Reference Daina, Michielin and Zoete23). Pathological targets for obesity were identified by screening the GeneCards, Online Mendelian Inheritance in Man, Therapeutic Target Database and DisGeNET databases using the keyword ‘obesity’(Reference Stelzer, Rosen and Plaschkes24–Reference Piñero, Bravo and Queralt-Rosinach27). Similarly, targets for depression were extracted from the GeneCards, Online Mendelian Inheritance in Man, Therapeutic Target Database, DisGeNET and Menda databases using the keywords ‘depression’, ‘depressive symptoms’ and ‘major depressive disorder’(Reference Pu, Yu and Liu28). Targets from the GeneCards database were refined through three sequential filtering steps in obesity or four steps in depression. At each step, targets below the median relevance score were excluded to progressively narrow down the list to a manageable size. Gene names were standardised using the UniProt website. Common targets shared among DHA, obesity and depression were identified using an interactive online tool for generating the Venn diagrams. Additional details regarding the databases used for target identifications are listed in Table S3.
The STRING database was employed to construct the protein–protein Interaction network, setting the confidence score threshold to ≥0·4 and limiting the analysis to ‘Homo sapiens’(Reference Szklarczyk, Gable and Nastou29). The network was visualised in Cytoscape software (version 3.7.2) by importing a TSV file generated from the STRING. The top ten core targets linked to the comorbidity were identified using the degree algorithm of CytoHubba plugin(Reference Zhang, Zhou and Ma30). Subsequently, the common targets shared between DHA and the comorbidity were analysed in R software, in which the ‘clusterProfiler’ package was utilised for Gene Ontology enrichment analysis, encompassing biological processes, cellular components and molecular functions, as well as Kyoto Encyclopedia of Genes and Genomes (KEGG) pathway analysis(Reference Wu, Hu and Xu31). To facilitate interpretation, the top twenty KEGG pathways and the top fifteen Gene Ontology terms were visualised using a bioinformatics website, and the results were ranked according to their false discovery rate, which represents the adjusted P values after controlling for multiple hypothesis testing.
To validate the predictive mechanism underlying the anti-inflammatory effects of n-3 PUFA, we assessed the correlation between serum DHA levels and key inflammatory biomarkers using the datasets from NHANES. To account for the complex sampling design of NHANES, weighted analyses were performed using the ‘survey’ package in R software. Two-tailed hypothesis tests were conducted, with a P value < 0·05 indicating statistical significance. All data analyses were performed using R software (version 4.4.1; R Foundation for Statistical Computing).
Results
Characteristics of participants
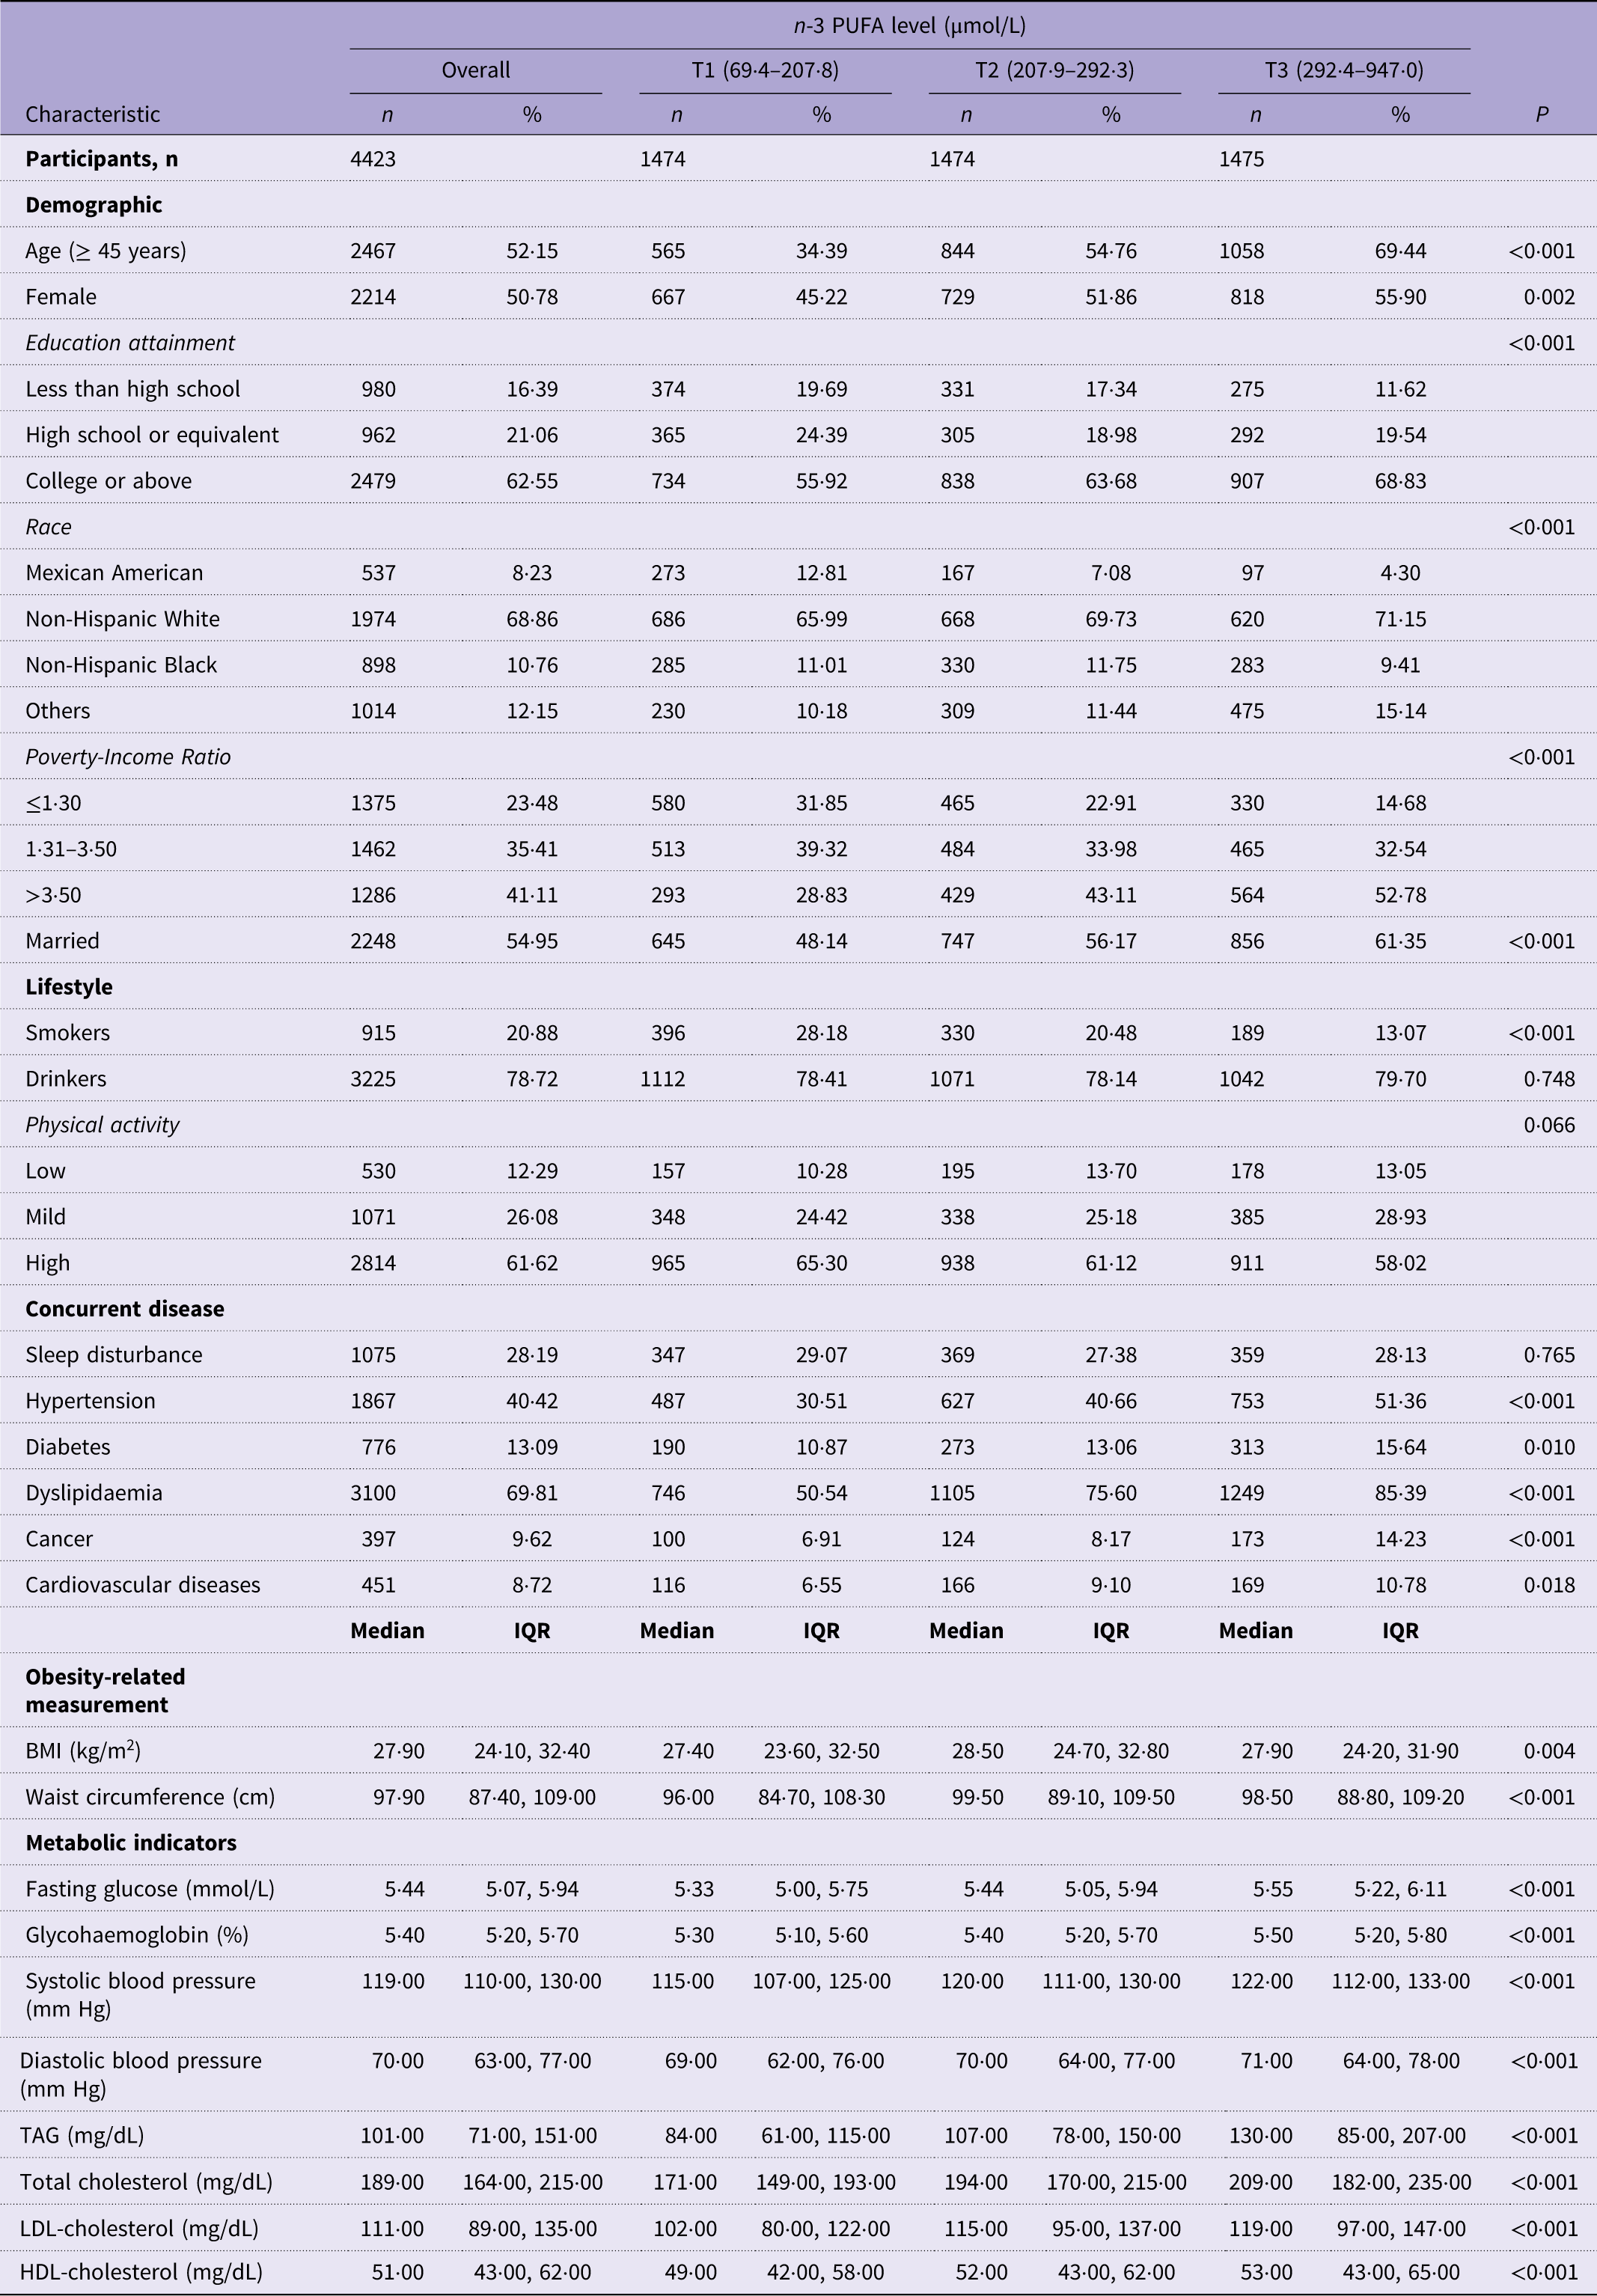
Among a total of 4423 participants (1650 cases of general obesity, 2467 cases of center obesity and 920 depressed individuals), 442 cases of GODS and 661 cases of CODS were identified, with a weighted prevalence of 10·0 % (95 % CI: 9·1 %–10·9 %) and 14·9 % (95 % CI: 13·9 %–15·9 %), respectively. Baseline characteristics according to tertiles of serum n-3 PUFA levels are presented in Table 1. Participants in the highest tertile were more likely to be older, female, highly educated, non-Hispanic White, married and non-smokers. They also had higher poverty:income ratios and a greater prevalence of hypertension, diabetes, dyslipidaemia, CVD and cancer than those in the lower tertiles. In contrast, alcohol consumption, leisure-time physical activity and sleep disturbance did not differ significantly across tertiles.
Characteristics of study participants according to the tertiles of serum n-3 PUFA levels *

Table 1. Long description
The table presents characteristics of 4423 study participants categorized by tertiles of serum n-3 PUFA levels. It includes demographic information, lifestyle factors, concurrent diseases, obesity-related measurements, and metabolic indicators. The table is divided into four main sections: Demographic, Lifestyle, Concurrent disease, and Obesity-related measurement. Each section contains multiple rows with specific characteristics and their corresponding values across three tertiles (T1, T2, T3). For example, the Demographic section includes age, sex, education attainment, race, and poverty-income ratio. The Lifestyle section covers smoking, drinking, and physical activity. The Concurrent disease section lists sleep disturbance, hypertension, diabetes, dyslipidaemia, cancer, and cardiovascular diseases. The Obesity-related measurement section includes BMI, waist circumference, and various metabolic indicators like fasting glucose, glycohemoglobin, systolic and diastolic blood pressure, TAG, total cholesterol, LDL-cholesterol, and HDL-cholesterol. Each characteristic is presented with its overall percentage or median value, followed by specific values for each tertile.
IQR, interquartile range; T, tertiles; HDL, high-density lipoprotein; LDL, low-density lipoprotein.
* Data are presented as median (25th, 75th percentile) for skewed continuous variables and count (percentage) for categorical variables; P values were determined using Kruskal–Wallis test for the skewed continuous data and Pearson’s χ 2 test for the categorical data.
Serum n-3 PUFA and obesity comorbid depressive symptoms
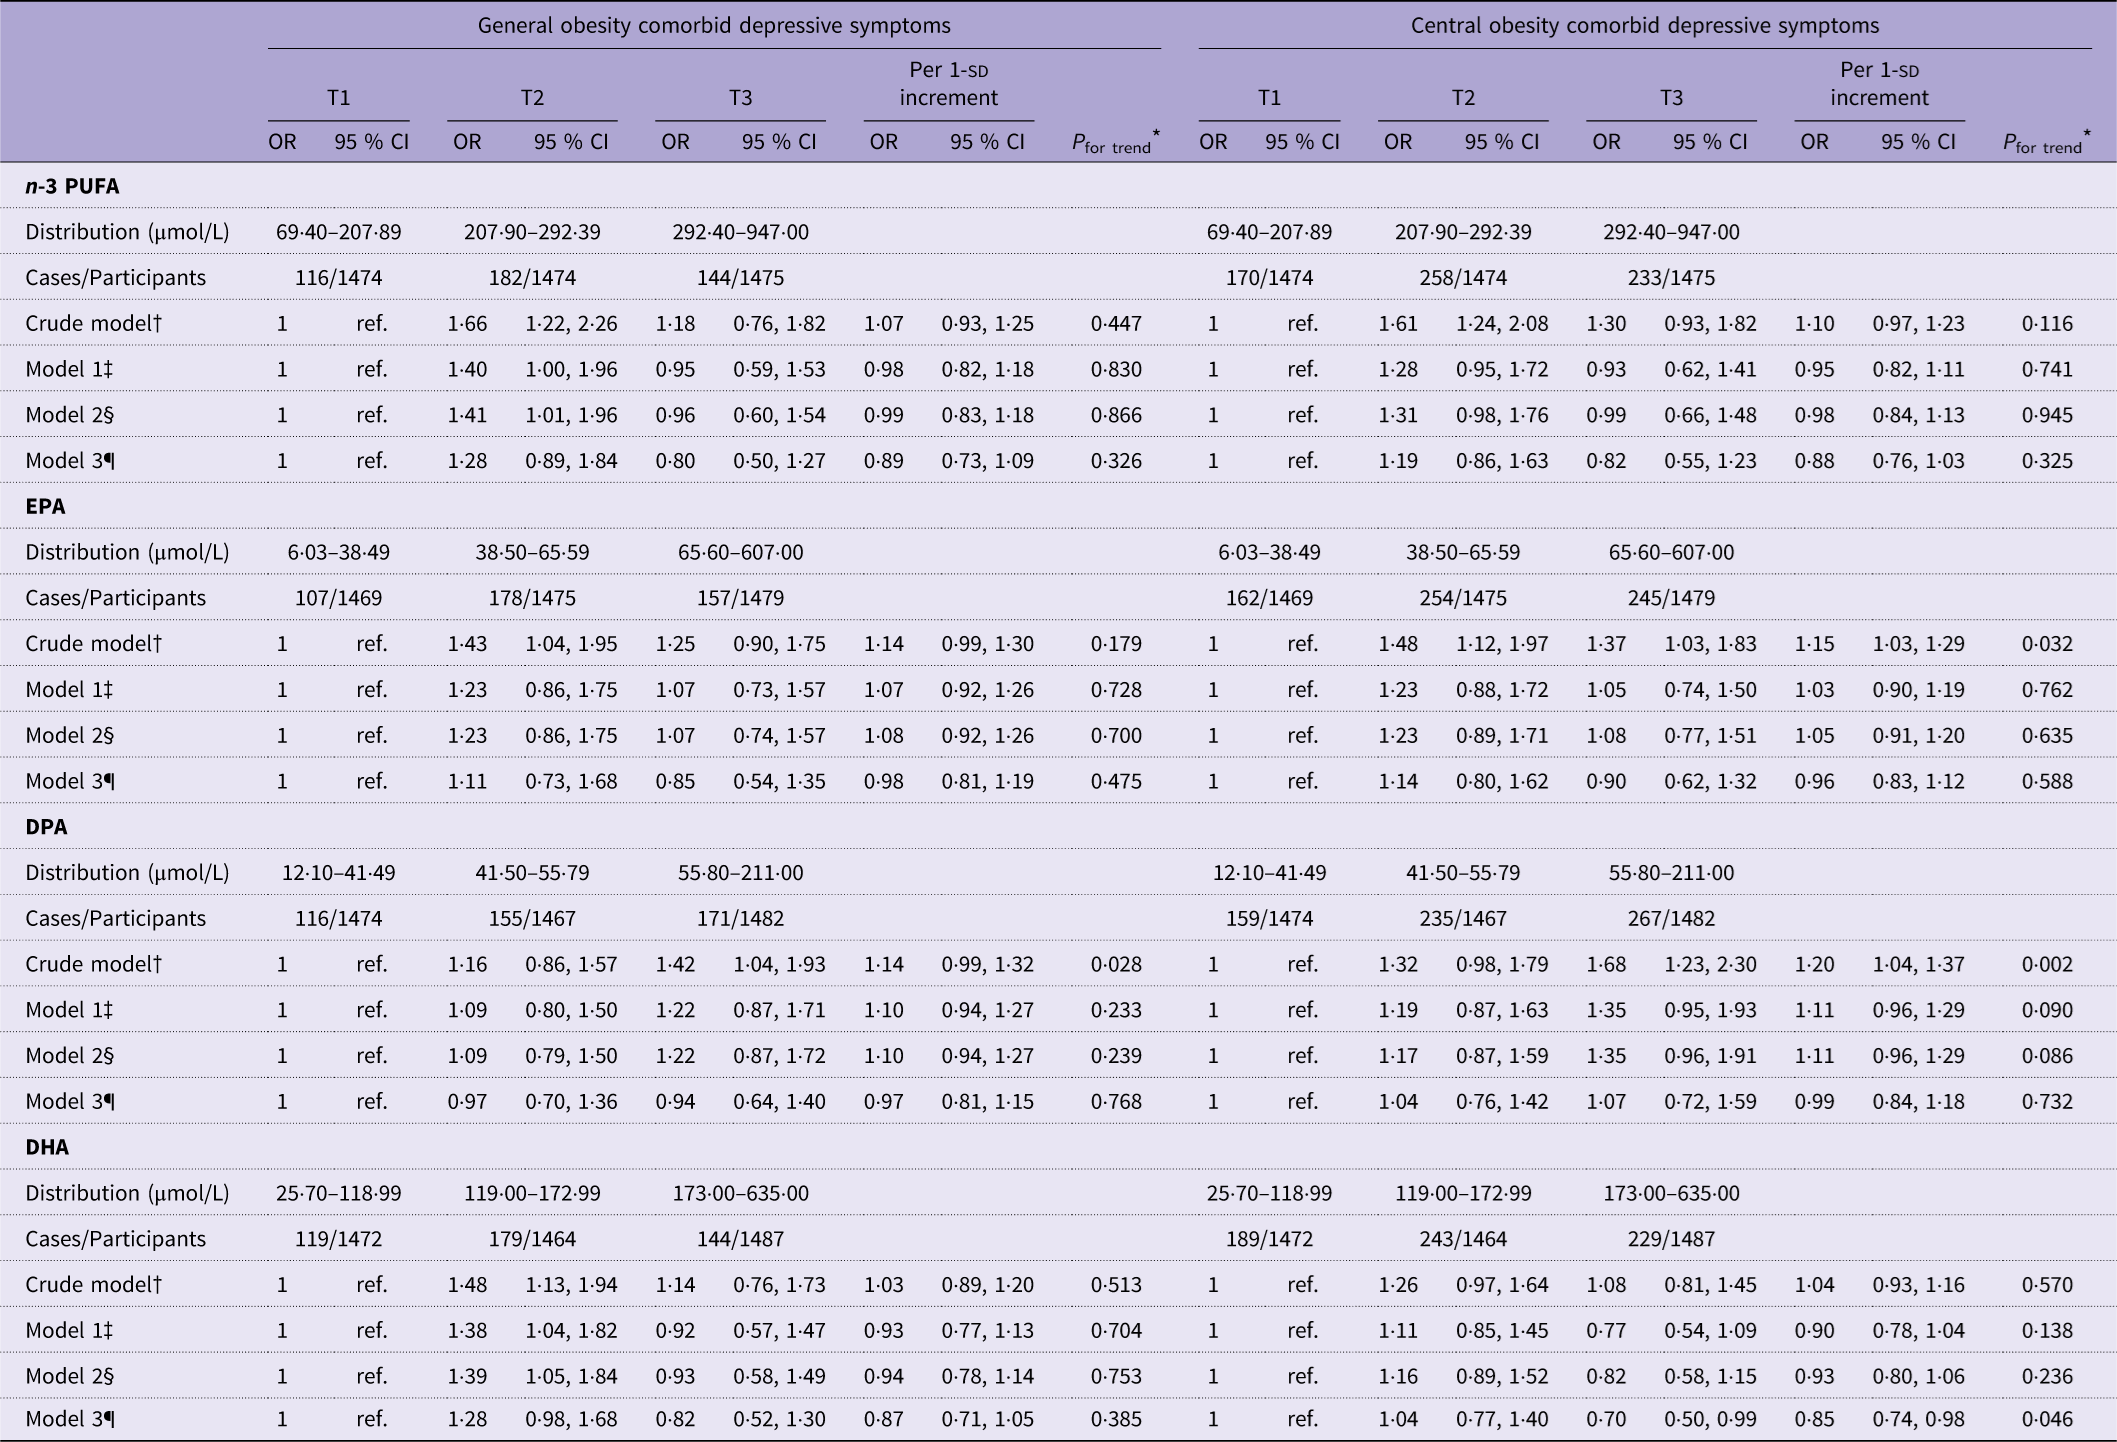
Multivariate-adjusted association of serum fatty acid levels with obesity comorbid with depressive symptoms is shown in Table 2. Per 1-sd increase in n-3 PUFA levels did not statistically result in decreased odds of GODS (OR: 0·89, 95 % CI: 0·73–1·09) and CODS (OR: 0·88, 95 % CI: 0·76–1·03). A lower odd of CODS was found at higher levels of DHA (OR T3 v. T1:0·70, 95 % CI: 0·50–0·99, P for trend = 0·046), with a 15 % reduction for per 1-sd increase in the levels of DHA (OR: 0·85, 95 % CI: 0·74–0·98). Neither EPA nor DPA showed significant associations with obesity-depression comorbidity, including both GODS and CODS.
Association of serum n-3 fatty acids with obesity comorbid depressive symptoms

Table 2. Long description
The table presents the association of serum n-3 fatty acids with general obesity comorbid depressive symptoms (GODS) and central obesity comorbid depressive symptoms (CODS). It includes data for n-3 PUFA, EPA, DPA, and DHA across different distribution levels and models. The table has 16 rows and 18 columns, with column headers including OR, 95% CI, and P_for_trend for each distribution and model. Row labels include distribution levels in micromoles per liter (µmol/L) and cases/participants. Notable trends include the lack of significant association between n-3 PUFA levels and both GODS and CODS, while DHA shows a lower odd of CODS at higher levels. EPA and DPA do not show significant associations with obesity-depression comorbidity.
T, tertiles.
* P for trend was calculated by modelling tertiles as continuous variables.
† Crude model: Unadjusted.
‡ Model 1: Adjusted for age, gender, race, education level, poverty:income ratio and marital status.
§ Model 2: Model 1 plus smoking.
¶ Model 3: Model 2 plus hypertension, diabetes, dyslipidaemia, CVD and cancer.
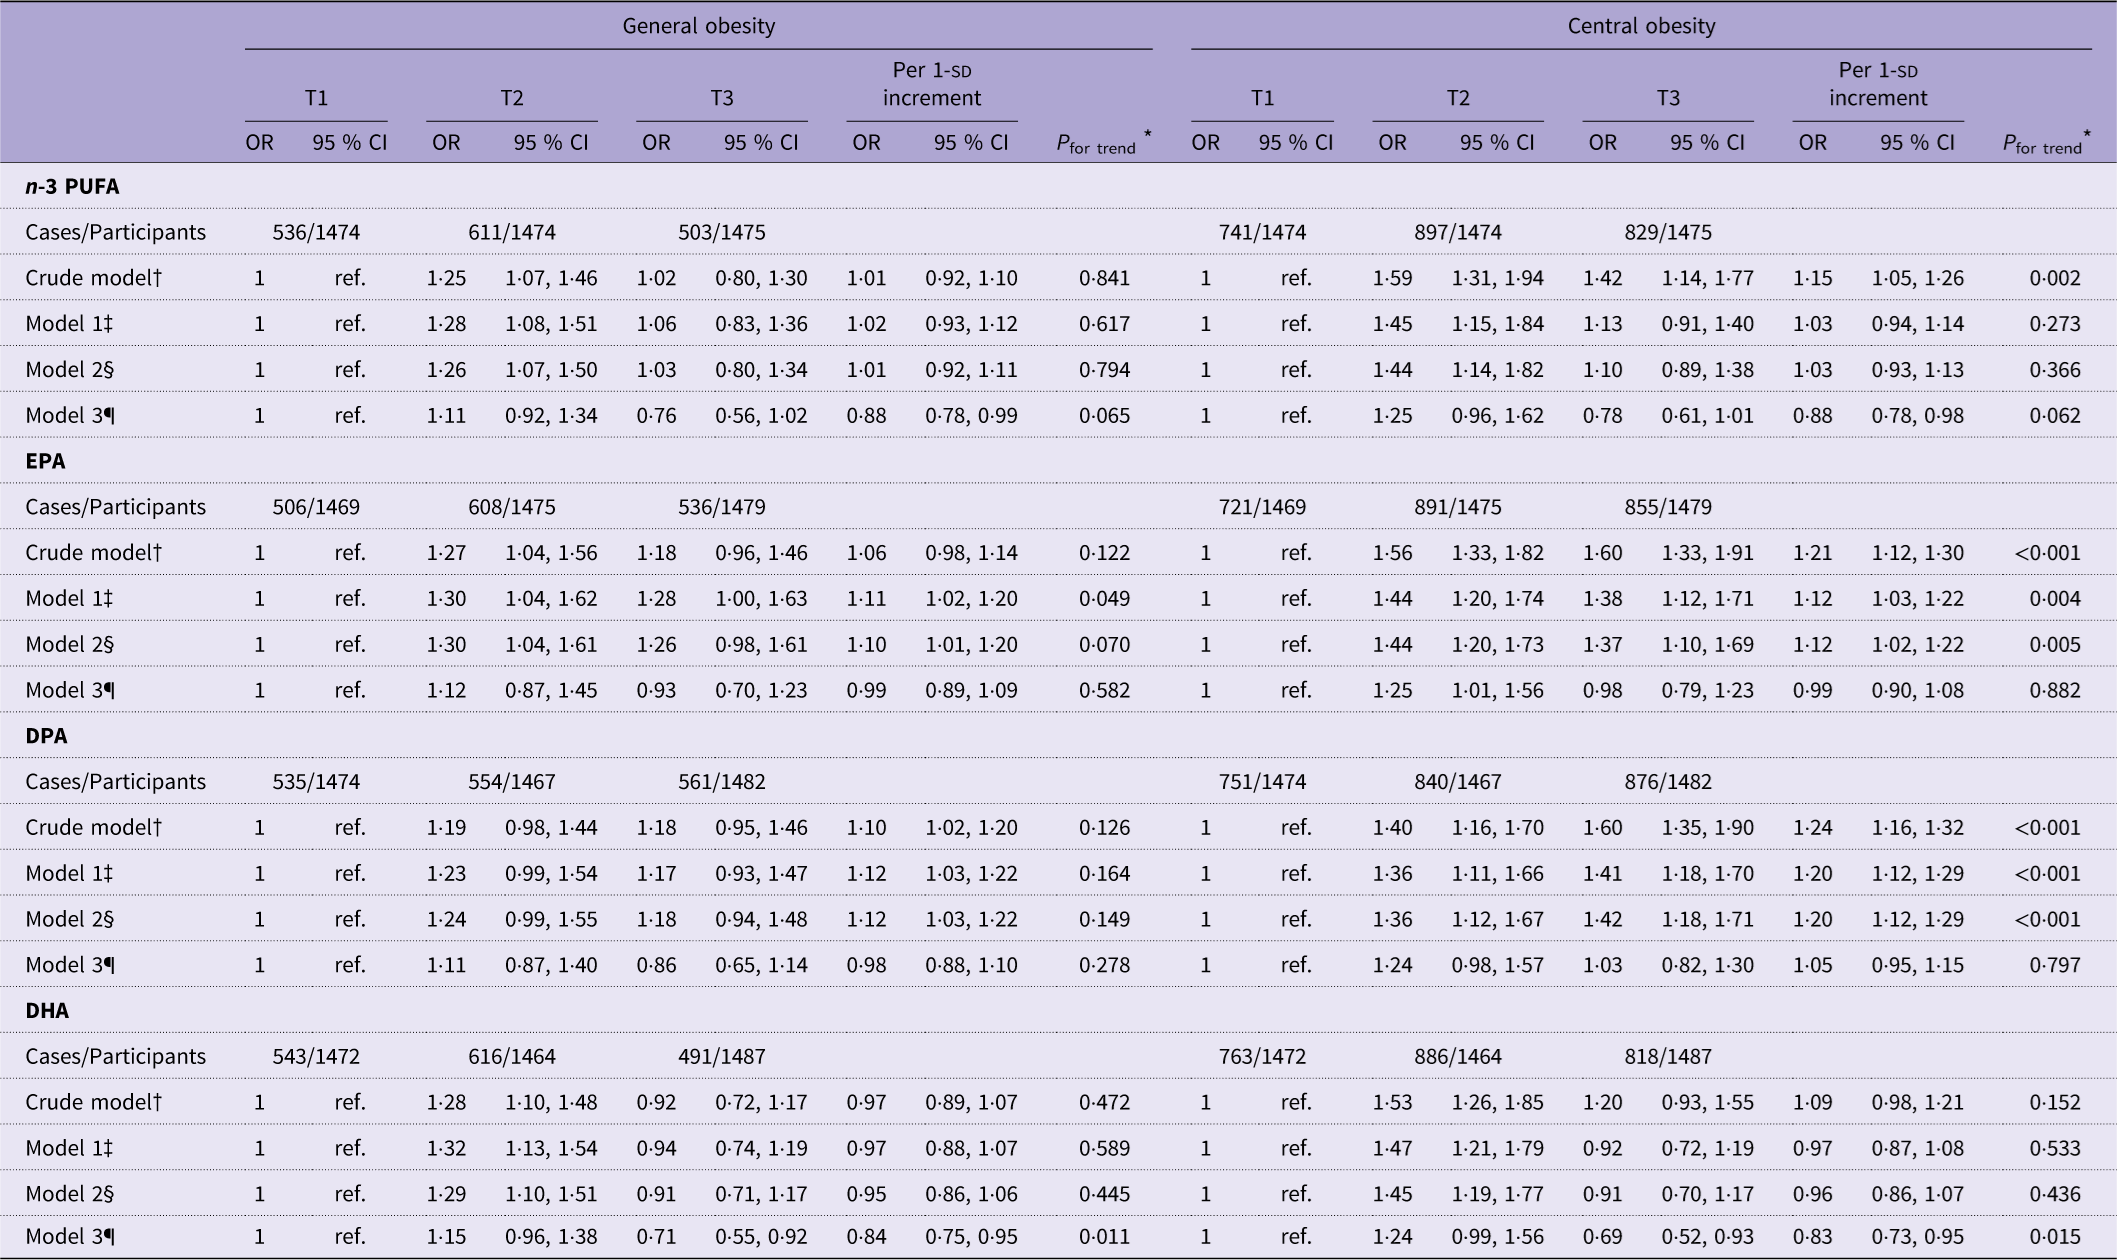
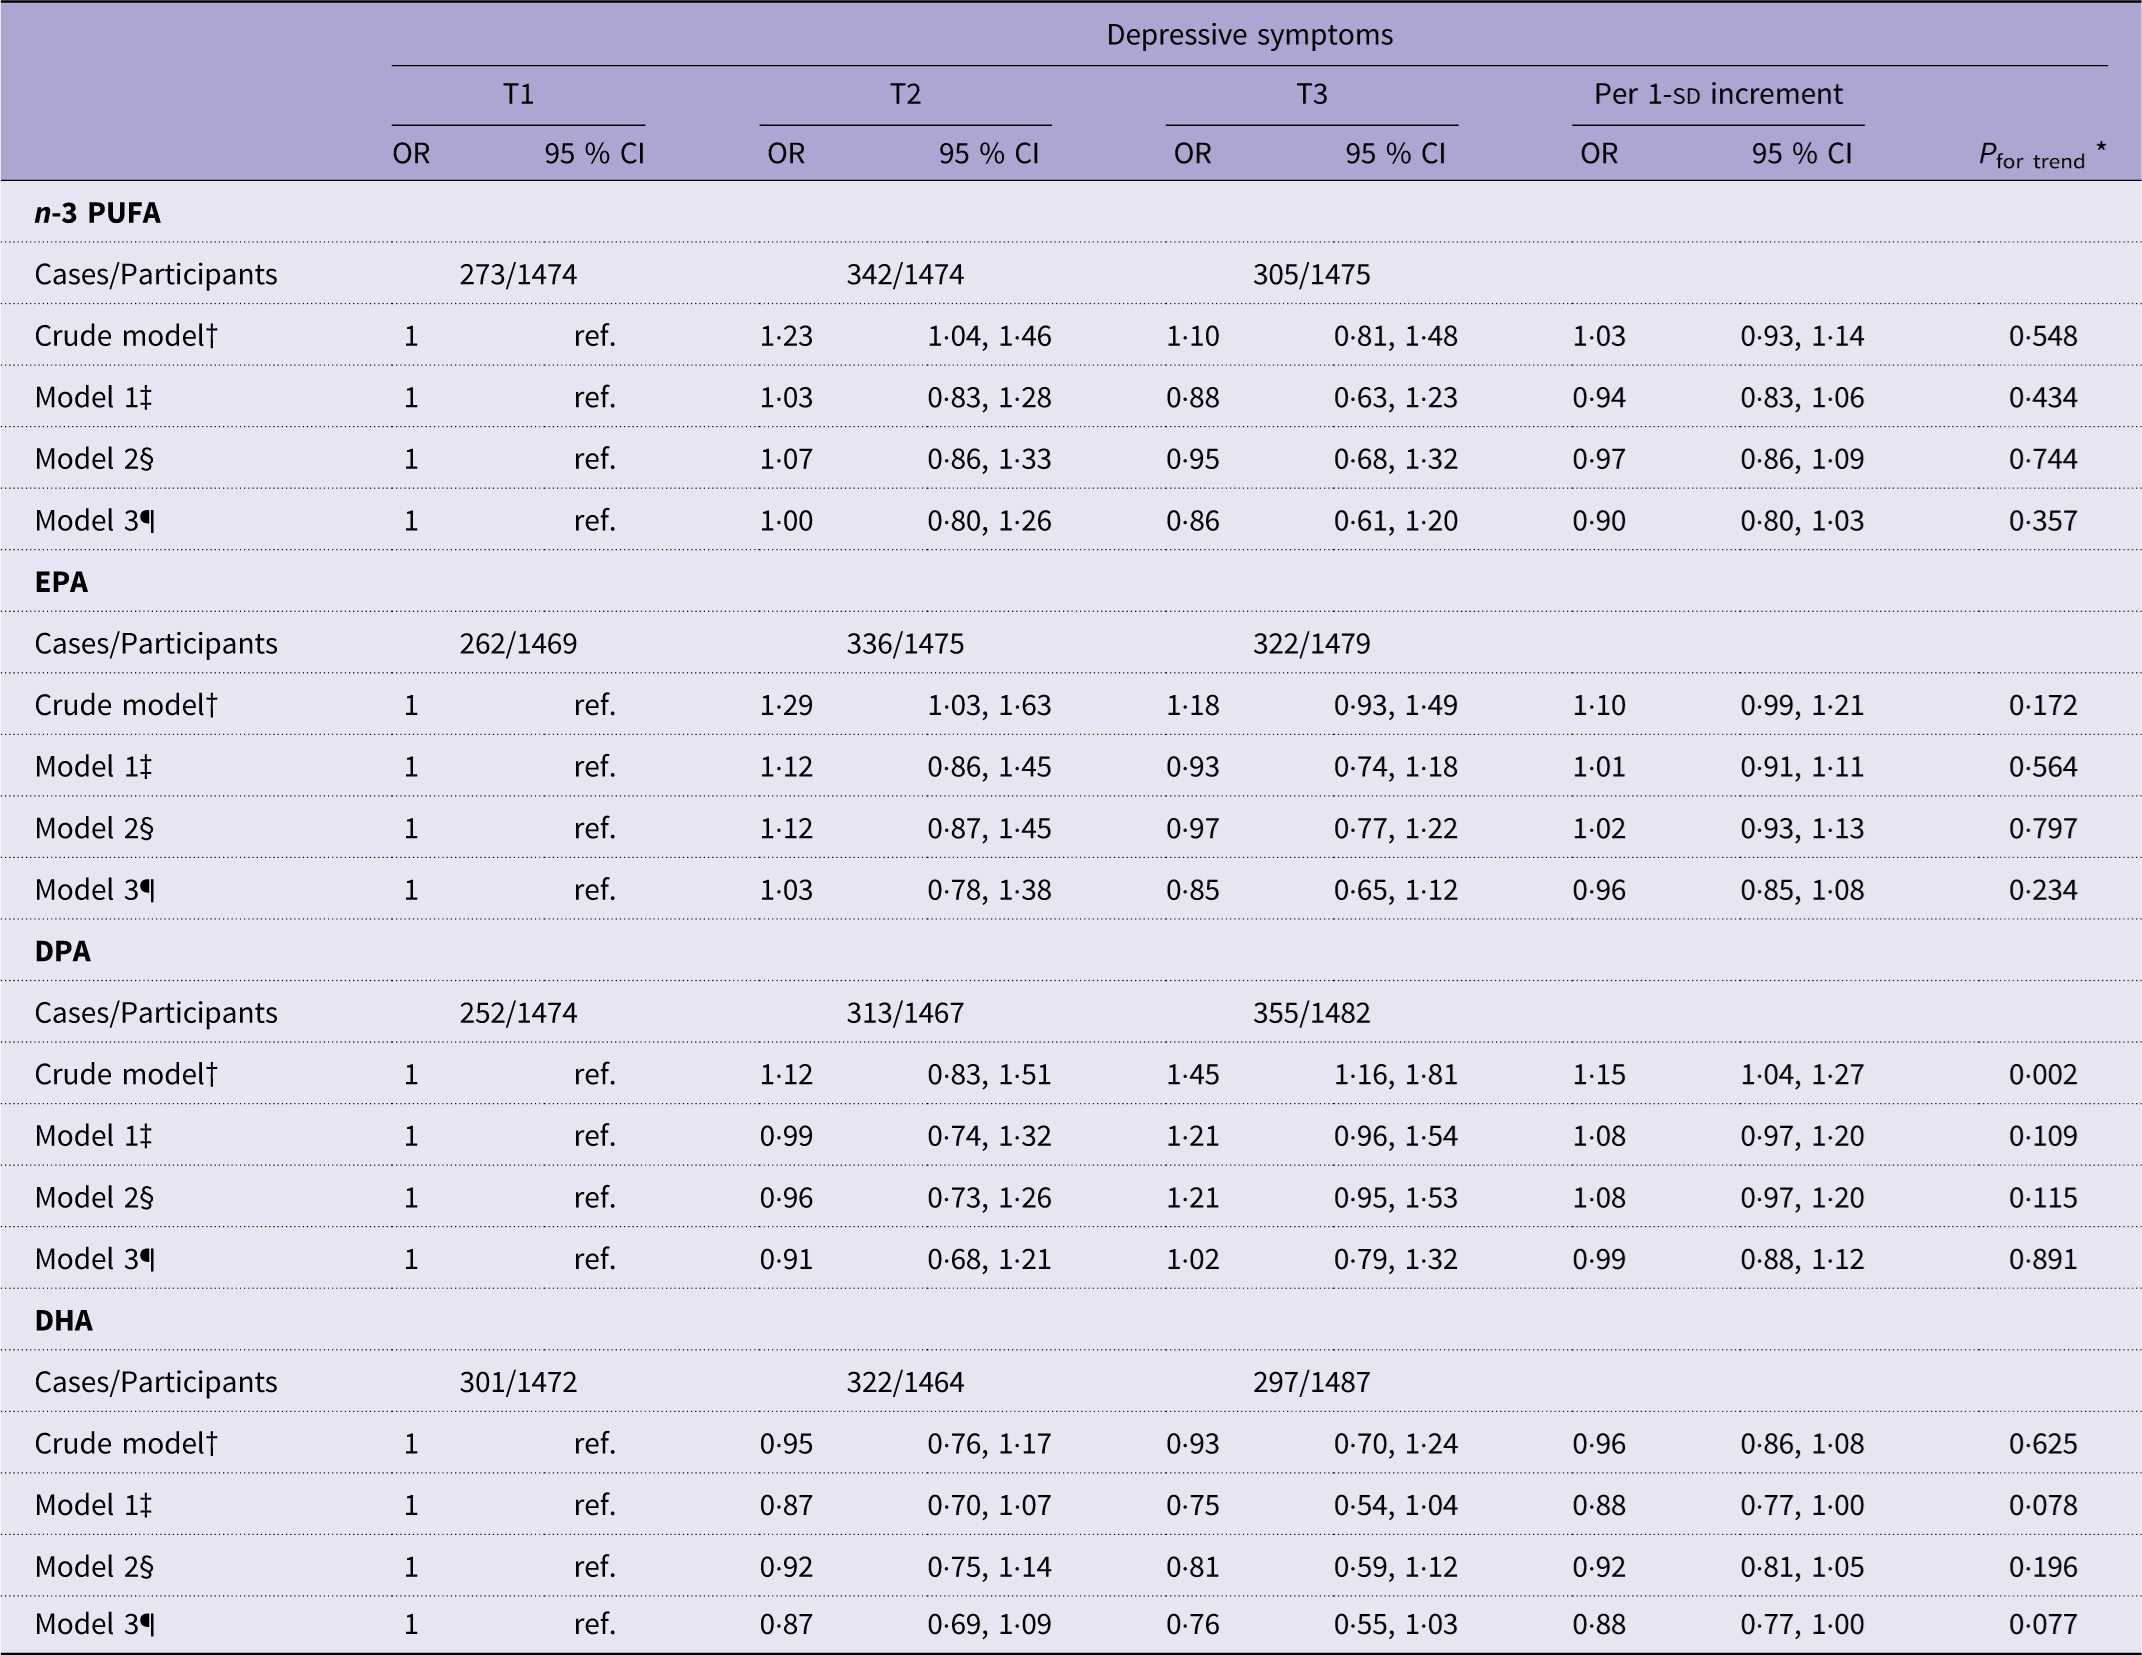
As for obesity outcomes (Table 3), each 1-sd increment in serum n-3 PUFA levels were associated with reduced odds of general obesity (OR: 0·88, 95 %CI: 0·78–0·99) and central obesity (OR: 0·88, 95 %CI: 0·78–0·98). The associations were significant for DHA alone, with OR values of 0·84 (95 % CI: 0·75–0·95) for general obesity and 0·83 (95 % CI: 0·73–0·95) for central obesity. Moreover, each 1-sd increment in DHA levels would result in a 12 % reduction of depressive symptoms (OR: 0·88, 95 %CI: 0·77–1·00). Total serum n-3 PUFA, DPA and EPA had no significant associations with depressive symptoms (Table 4).
Association of serum n-3 fatty acids with obesity

Table 3. Long description
The table presents data on the association of serum n-3 fatty acids with general and central obesity. It includes odds ratios (OR) and 95% confidence intervals (CI) for different models and increments. The table is divided into sections for n-3 PUFA, EPA, DPA, and DHA, with cases and participants listed for each. Each section includes crude models and adjusted models (Model 1, Model 2, Model 3). The table shows OR and CI values for T1, T2, T3, and per 1-sd increment for both general and central obesity. Notable trends include the association of DHA with reduced odds of general and central obesity.
T, tertiles.
* P for trend was calculated by modelling tertiles as continuous variables.
† Crude model: Unadjusted.
‡ Model 1: Adjusted for age, gender, race, education level, poverty:income ratio and marital status.
§ Model 2: Model 1 plus smoking.
¶ Model 3: Model 2 plus hypertension, diabetes, dyslipidaemia, CVD and cancer.
Association of serum n-3 fatty acids with depressive symptoms

Table 4. Long description
The table presents data on the association of serum n-3 fatty acids with depressive symptoms. It includes four main sections: n-3 PUFA, EPA, DPA, and DHA. Each section lists the number of cases and participants, followed by odds ratios (OR) and 95% confidence intervals (CI) for different models (Crude model, Model 1, Model 2, Model 3) at three time points (T1, T2, T3), and per 1-sd increment. Row 1: n-3 PUFA, Cases/Participants: 273/1474, 342/1474, 305/1475. Crude model: OR 1, ref., 1.23 (1.04, 1.46), 1.10 (0.81, 1.48), 1.03 (0.93, 1.14). Model 1: OR 1, ref., 1.03 (0.83, 1.28), 0.88 (0.63, 1.23), 0.94 (0.83, 1.06). Model 2: OR 1, ref., 1.07 (0.86, 1.33), 0.95 (0.68, 1.32), 0.97 (0.86, 1.09). Model 3: OR 1, ref., 1.00 (0.80, 1.26), 0.86 (0.61, 1.20), 0.90 (0.80, 1.03). Row 2: EPA, Cases/Participants: 262/1469, 336/1475, 322/1479. Crude model: OR 1, ref., 1.29 (1.03, 1.63), 1.18 (0.93, 1.49), 1.10 (0.99, 1.21). Model 1: OR 1, ref., 1.12 (0.86, 1.45), 0.93 (0.74, 1.18), 1.01 (0.91, 1.11). Model 2: OR 1, ref., 1.12 (0.87, 1.45), 0.97 (0.77, 1.22), 1.02 (0.93, 1.13). Model 3: OR 1, ref., 1.03 (0.78, 1.38), 0.85 (0.65, 1.12), 0.96 (0.85, 1.08). Row 3: DPA, Cases/Participants: 252/1474, 313/1467, 355/1482. Crude model: OR 1, ref., 1.12 (0.83, 1.51), 1.45 (1.16, 1.81), 1.15 (1.04, 1.27). Model 1: OR 1, ref., 0.99 (0.74, 1.32), 1.21 (0.96, 1.54), 1.08 (0.97, 1.20). Model 2: OR 1, ref., 0.96 (0.73, 1.26), 1.21 (0.95, 1.53), 1.08 (0.97, 1.20). Model 3: OR 1, ref., 0.91 (0.68, 1.21), 1.02 (0.79, 1.32), 0.99 (0.88, 1.12). Row 4: DHA, Cases/Participants: 301/1472, 322/1464, 297/1487. Crude model: OR 1, ref., 0.95 (0.76, 1.17), 0.93 (0.70, 1.24), 0.96 (0.86, 1.08). Model 1: OR 1, ref., 0.87 (0.70, 1.07), 0.75 (0.54, 1.04), 0.88 (0.77, 1.00). Model 2: OR 1, ref., 0.92 (0.75, 1.14), 0.81 (0.59, 1.12), 0.92 (0.81, 1.05). Model 3: OR 1, ref., 0.87 (0.69, 1.09), 0.76 (0.55, 1.03), 0.88 (0.77, 1.00).
T, tertiles.
* P for trend was calculated by modelling tertiles as continuous variables.
† Crude model: Unadjusted.
‡ Model 1: Adjusted for age, gender, race, education level, poverty:income ratio and marital status.
§ Model 2: Model 1 plus smoking.
¶ Model 3: Model 2 plus hypertension, diabetes, dyslipidaemia, CVD and cancer.
Subgroup analyses
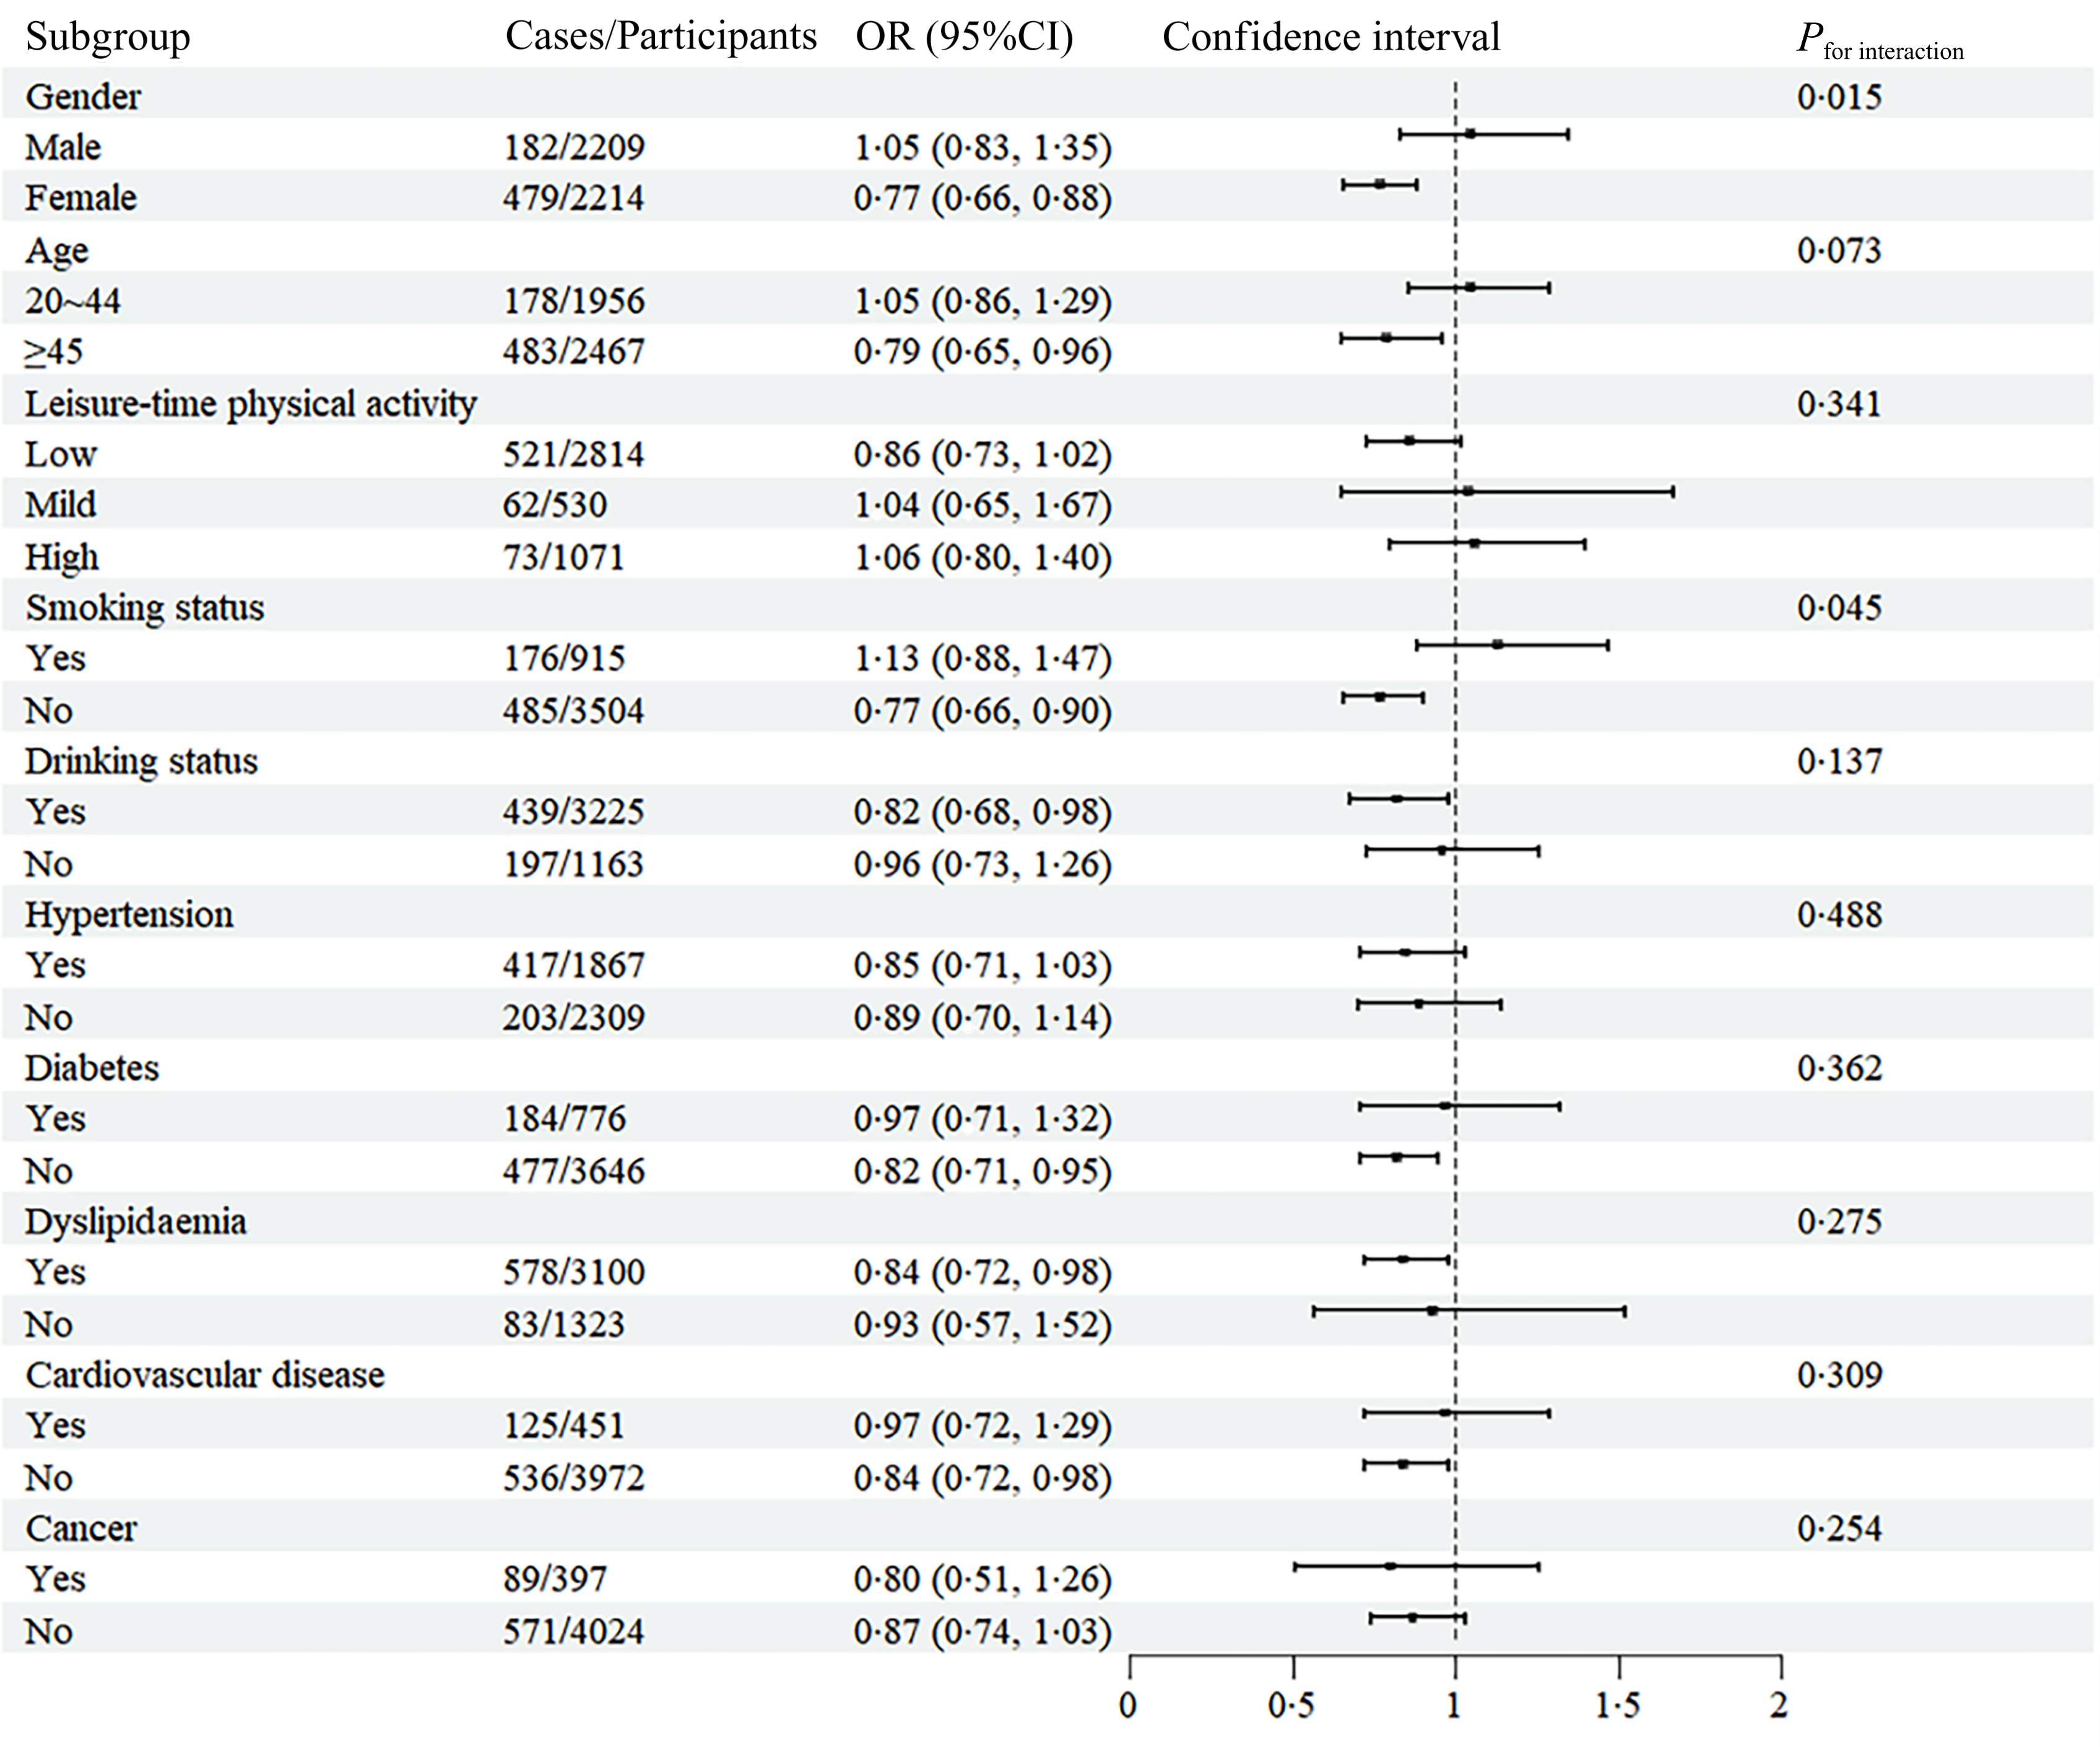
Results of stratified analyses examining the association of n-3 PUFA with GODS were presented in Figures S2 and S3, with no significant associations in all of subgroups analysed. n-3 PUFA had a significant association with CODS in female (OR: 0·82, 95 % CI: 0·69–0·96), the middle-aged and elder (OR: 0·79, 95 % CI: 0·64–0·97) and non-smokers (OR: 0·80, 95 % CI: 0·67–0·96), with a statistically modified effect by age (P for interaction = 0·009; Figure S4). Similarly, DHA was significantly associated with a lower odds of CODS in female (OR: 0·77, 95 % CI: 0·66–0·88), the middle-aged and elder (OR: 0·79, 95 % CI: 0·65–0·96), non-smokers (OR: 0·77, 95 % CI: 0·66–0·90), drinkers (OR: 0·82, 95 % CI: 0·68–0·98), non-diabetes (OR: 0·82, 95 % CI: 0·71–0·95) and dyslipidaemia (OR: 0·84, 95 % CI: 0·72–0·98), with a statistical modification by sex and smoking status (P for interaction = 0·015 and 0·045, respectively; Figure 2).
Subgroup analysis of the association between serum DHA and central obesity comorbid with depressive symptoms. Association estimates are presented as OR with 95 % CI per 1-sd increment in serum DHA levels. All models were adjusted for age, gender, race, education attainment, poverty:income ratio, marital status, smoking status, history of hypertension, diabetes, dyslipidaemia, CVD and cancer.

Sensitivity analyses
In the weighted restricted cubic spline regression analyses (Figure S5), graphical figure displayed a statistically linear relationship between serum n-3 PUFA levels and odds of CODS (P for nonlinearity = 0·160; Figure S5-E). The consistent negative linear trend was observed for DHA (P for nonlinearity = 0·266; Figure S5-H), whereas EPA demonstrated a nonlinear trend association (P for nonlinearity = 0·045; Figure S5-F). For general and central obesity outcomes, marine n-3 PUFA, EPA and DHA showed nonlinear trend associations (Figure S6). In contrast, DHA only showed a significant and linear association with depressive symptoms (P for nonlinearity = 0·464; Figure S7-D). These findings remained robust following multiple imputations (Tables S4–S6), with each 1-sd increase in DHA levels associated with a 17 % reduction in the odds of CODS (OR: 0·83, 95 % CI: 0·72–0·96; P for trend = 0·031; Table S4). Similar results were obtained in sensitivity analyses that included participants with outliers of PUFA levels (Tables S7–S9).
Predicted mechanisms of network pharmacology analysis
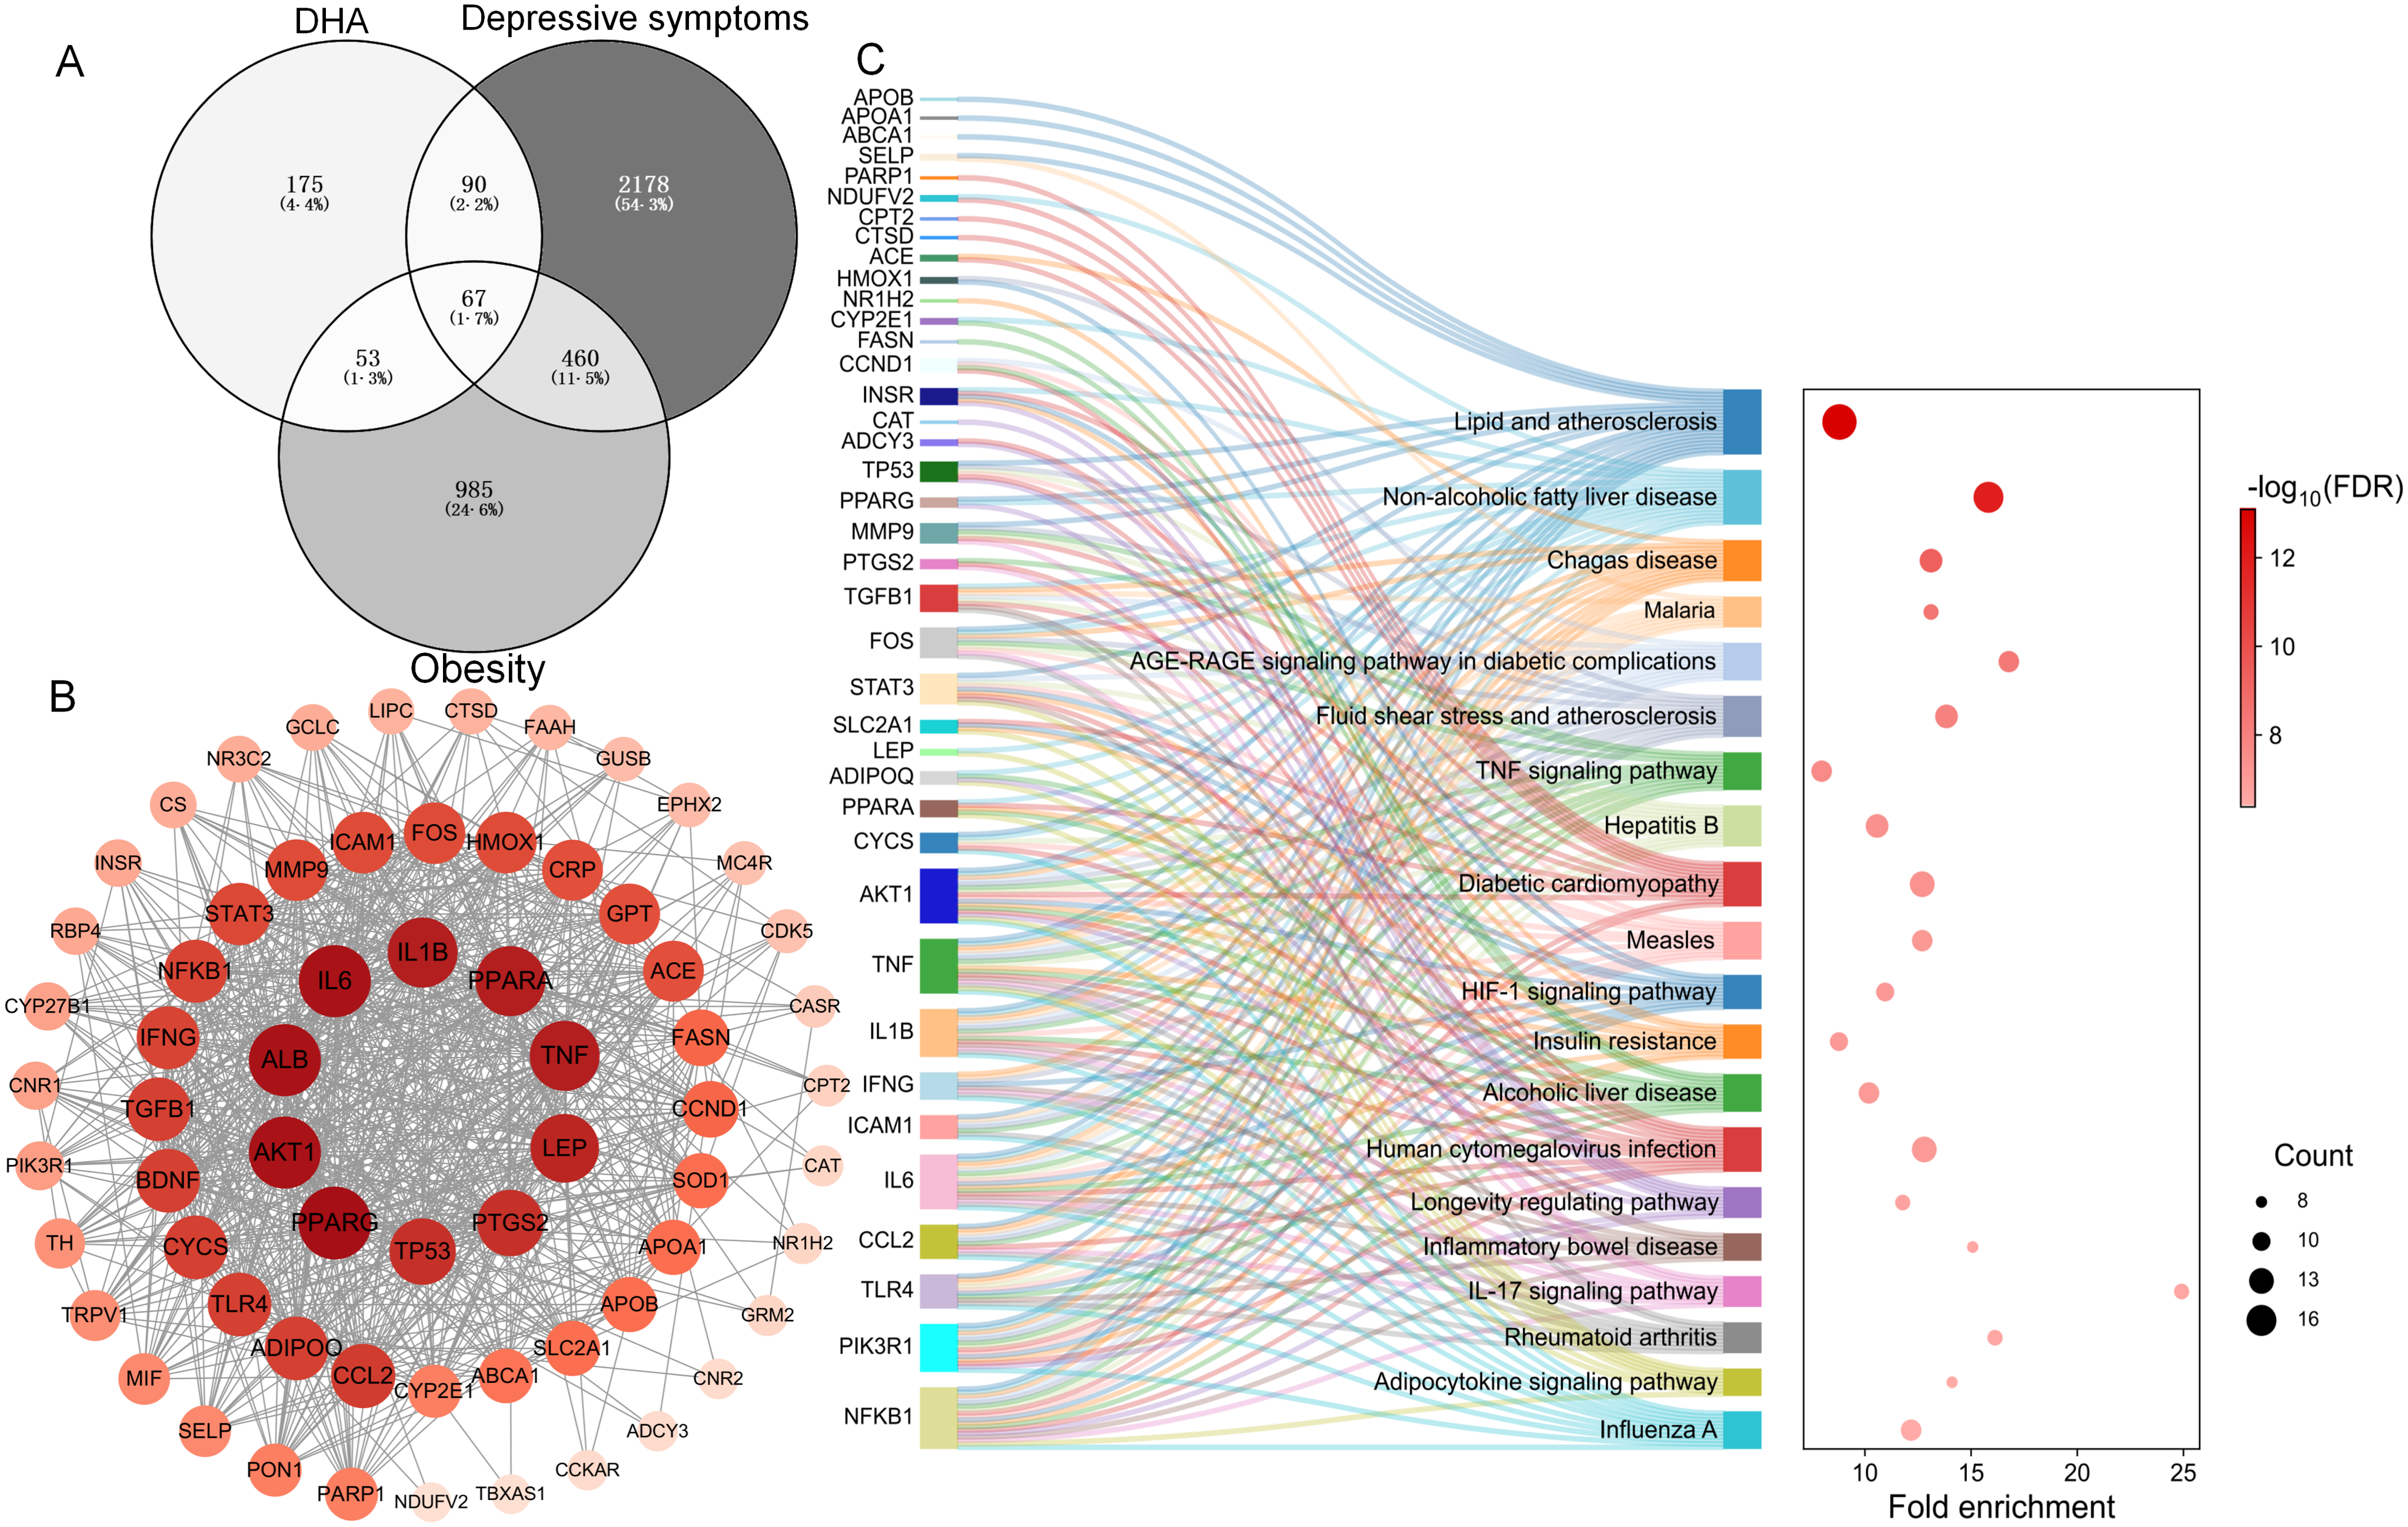
A comprehensive network pharmacology analysis was performed to explore potential mechanisms underlying the protective association of DHA with the comorbidity. After deduplication, we identified 385 DHA-related target genes, 1565 obesity-related genes, and 2795 depression-related genes, with sixty-seven overlapping targets identified as prospective therapeutic candidates (Figure 3A). Analyses of the STRING database identified sixty-six proteins for the PPI network constructions. Following removal of one non-interacting protein, the final network comprised sixty-five nodes (protein targets) and 757 edges (functional interactions) (Figure 3B). Network centrality analysis revealed ten high-connectivity hub genes (PPARG, AKT1, ALB, IL6, IL1B, PPARA, TNF, LEP, PTGS2 and TP53; Table S10) that form critical network nodes. These molecular hubs functionally converge on metabolic regulation (PPARG, PPARA, LEP, AKT1), inflammatory response (IL6, IL1B, TNF and PTGS2) and cellular homeostasis (TP53, ALB).
Network pharmacology analysis of DHA in obesity-comorbid depression. (A) Venn diagram displaying the overlap of potential molecular targets of DHA, obesity and depression. (B) Protein–protein interaction (PPI) network for the common targets between DHA, obesity and depression. Nodes represent proteins encoded by protein-coding genes, while edges indicate functional or physical interactions between proteins. Node degree is defined by the number of connections, with node size, label size and colour intensity (redder color) increasing with higher degree values. (C) KEGG pathway enrichment of shared targets. Significance was assessed using Fisher’s exact test with Benjamini–Hochberg false discovery rate correction. Fold enrichment represents the ratio of input gene proportion in a pathway to that of all annotated human genes. Bubble size reflects gene count, and color intensity (redder color) indicates –log10 (FDR), with higher values indicating greater enrichment. KEGG, Kyoto Encyclopedia of Genes and Genomes.

Functional enrichment analysis revealed fifteen top enriched Gene Ontology terms (Figure S8), systematically categorised into three principal domains of cellular organisation and function. Biological processes category demonstrated significant enrichment in metabolic regulation pathways, including small molecule metabolism and lipid localisation/storage, as well as nutrient sensing mechanisms involving peptide hormone response and insulin regulation. These processes work in concert to maintain metabolic homeostasis, particularly in glucose regulation and fatty acid metabolism. Cellular component terms localised these activities to specific subcellular structures, identifying plasma lipoprotein particles, membrane microdomains (rafts), vesicle lumens and neuronal cell bodies as key anatomical sites of action. Molecular function category revealed the precise biochemical mechanisms involved, including nuclear receptor activity (particularly PPAR family members), ligand-activated transcription factor binding, RNA polymerase II-specific DNA binding and peptide/hormone interaction domains.
KEGG analysis identified the top twenty significantly enriched pathways (Figure 3C), providing mechanistic insights into DHA’s therapeutic potential for obesity-comorbid depression. According to the false discovery rate-adjusted significance, the most prominent pathways included lipid and atherosclerosis, TNF, hypoxia-inducible factor-1, insulin resistance and IL-17 signalling pathways. The pathways collectively highlighted DHA’s multifaceted role in addressing the metabolic inflammation and neural dysregulation underlying the comorbidities of obesity and depression.
Inflammatory biomarker analyses
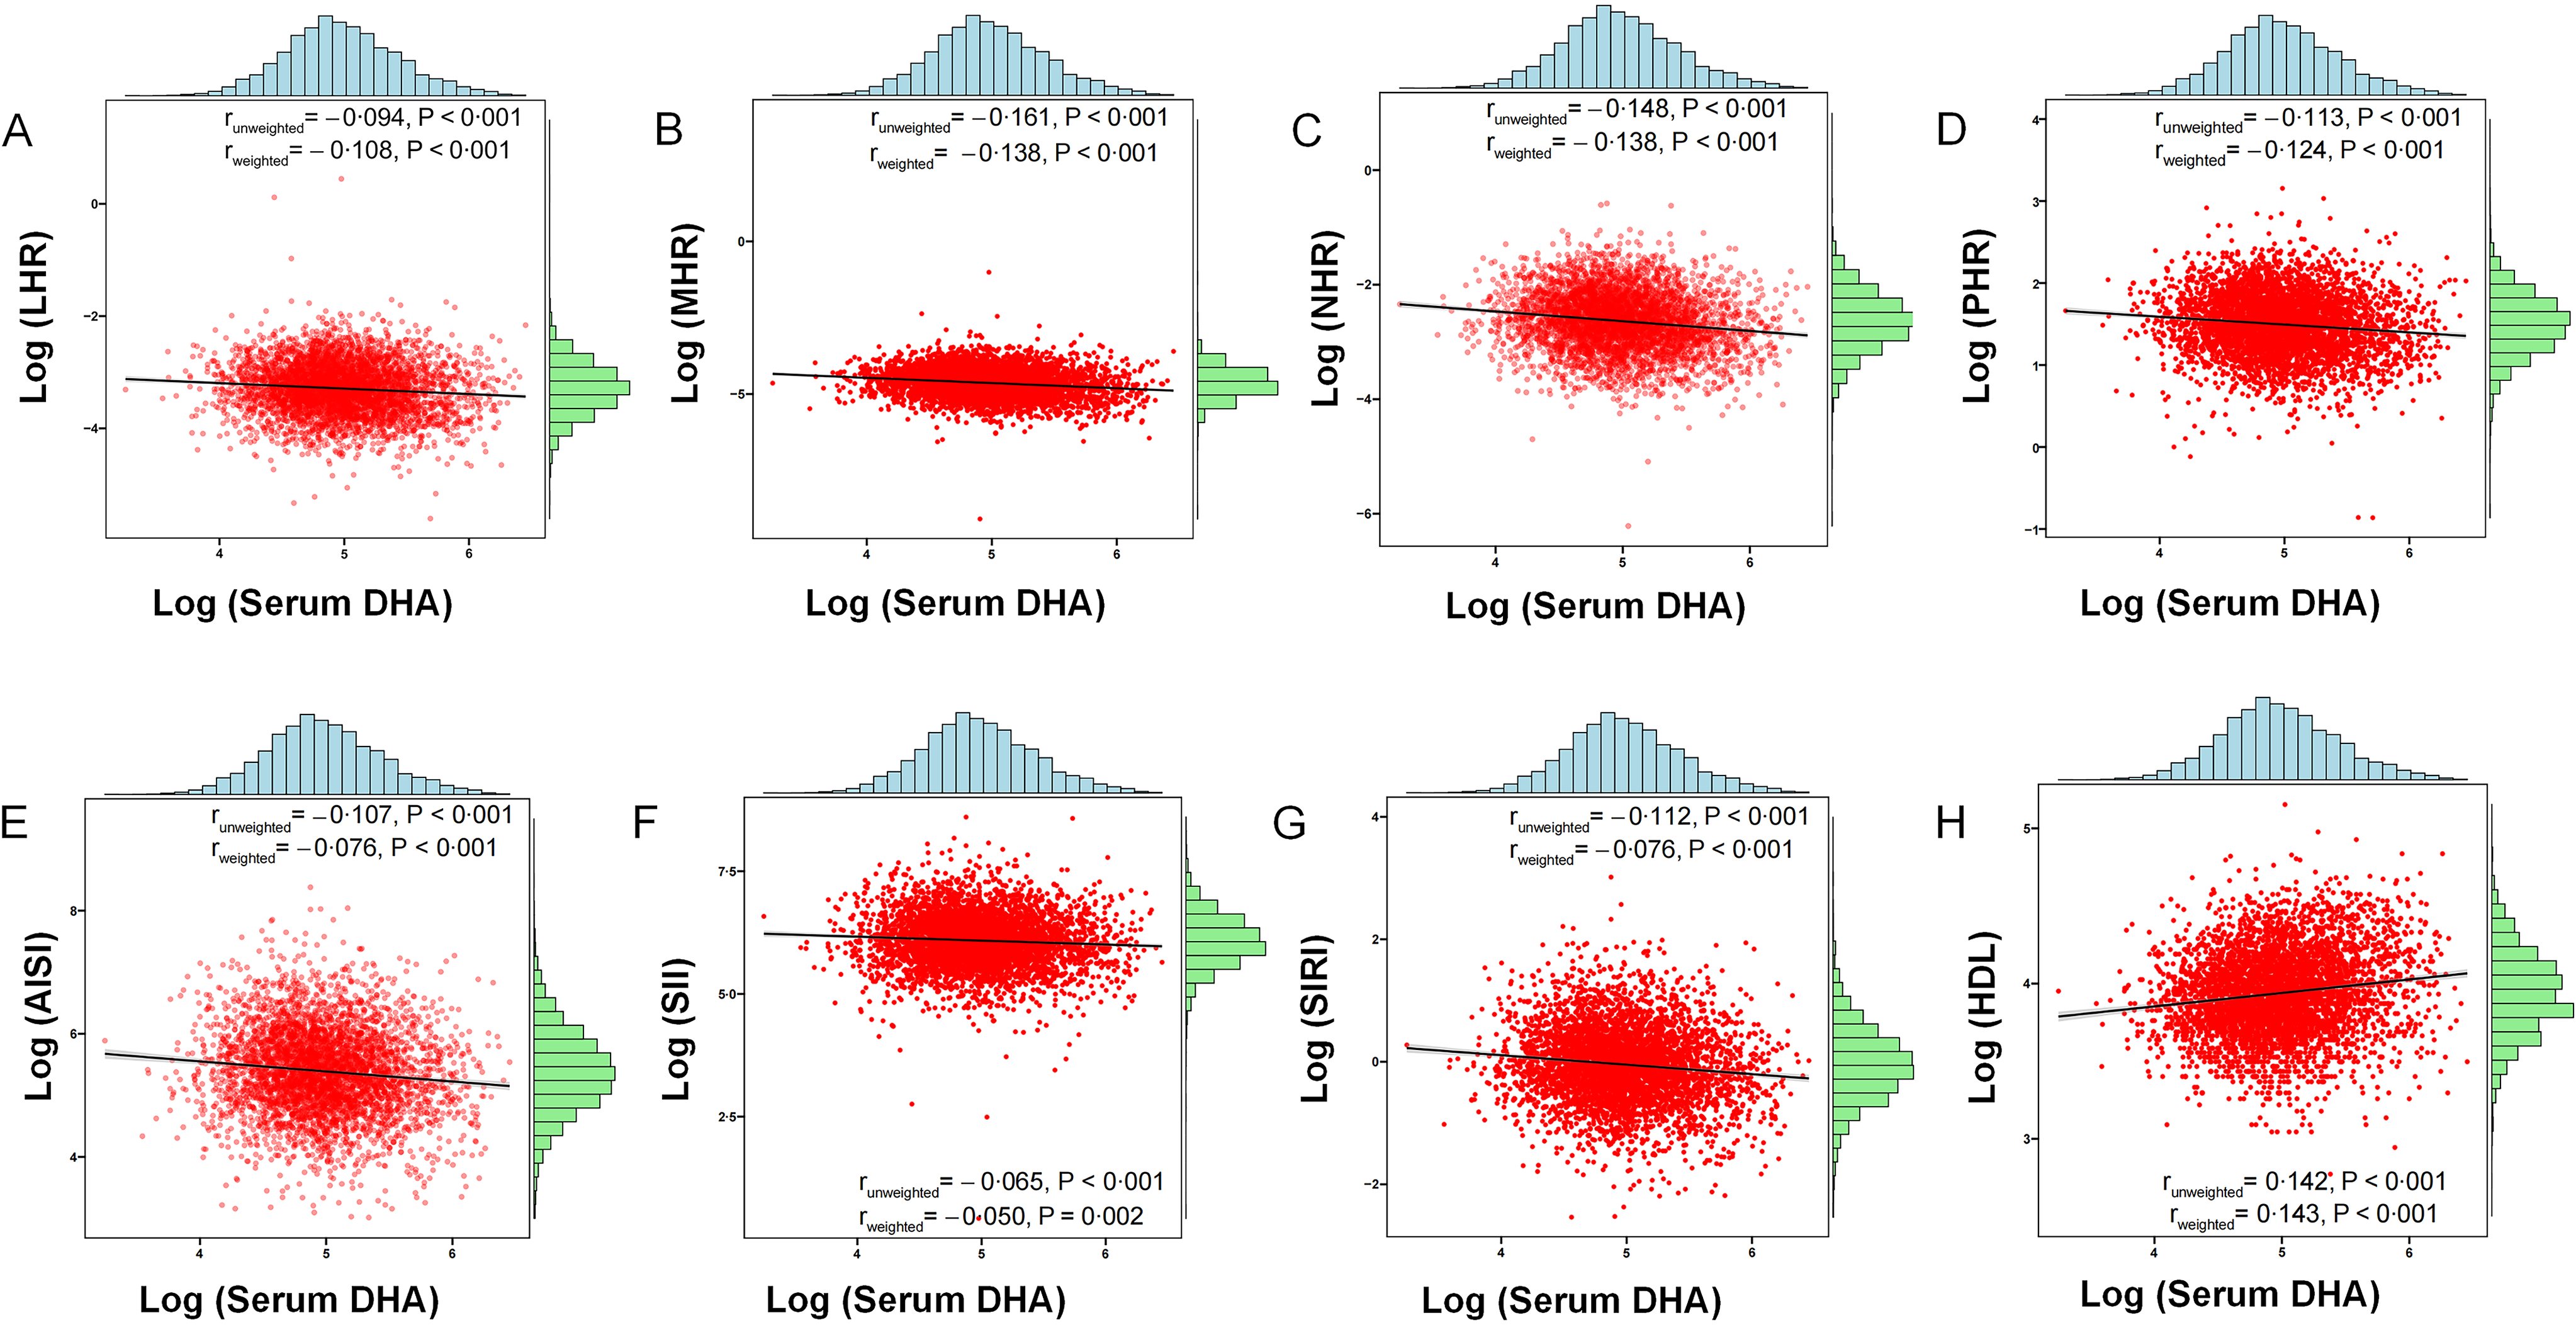
Unweighted and weighted correlations with candidate immuno-inflammatory indices are presented in Figure 4. Weighted correlational analyses revealed that serum DHA levels were significantly associated with reduced systematic inflammation, evidenced by negative correlations with lymphocyte:HDL ratio (r: −0·108, P < 0·001), MHR (r: −0·138, P < 0·001), NHR (r: −0·138, P < 0·001), platelet:HDL ratio (r: −0·124, P < 0·001), AISI (r: −0·076, P < 0·001), SII (r: −0·050, P = 0·002), SIRI (r: −0·076, P < 0·001) and positive relations with HDL-cholesterol (r: 0·143, P < 0·001). The correlations between serum DHA and peripheral blood cell subsets are presented in Figure S9.
Unweighted and weighted Pearson correlations between serum DHA and candidate immune-inflammatory biomarkers. (A) Lymphocyte:HDL ratio (LHR), (B) monocyte:HDL ratio (MHR), (C) neutrophil:HDL ratio (NHR), (D) platelet:HDL ratio (PHR), (E) the aggregate index of systemic inflammation (AISI), (F) systemic immune-inflammation index (SII), (G) systemic inflammation response index (SIRI), (H) HDL.

Figure 4. Long description
Eight scatter plots show the correlation between Log (Serum DHA) and different immune-inflammatory biomarkers. Each plot includes a regression line and histograms on the axes. Panel A: Scatter plot of Log (LHR) versus Log (Serum DHA) with unweighted and weighted Pearson correlation values. Panel B: Scatter plot of Log (MHR) versus Log (Serum DHA) with unweighted and weighted Pearson correlation values. Panel C: Scatter plot of Log (NHR) versus Log (Serum DHA) with unweighted and weighted Pearson correlation values. Panel D: Scatter plot of Log (PHR) versus Log (Serum DHA) with unweighted and weighted Pearson correlation values. Panel E: Scatter plot of Log (AISI) versus Log (Serum DHA) with unweighted and weighted Pearson correlation values. Panel F: Scatter plot of Log (SII) versus Log (Serum DHA) with unweighted and weighted Pearson correlation values. Panel G: Scatter plot of Log (SIRI) versus Log (Serum DHA) with unweighted and weighted Pearson correlation values. Panel H: Scatter plot of Log (HDL) versus Log (Serum DHA) with unweighted and weighted Pearson correlation values.
Discussion
This is the first population-based epidemiological study combined with NP prediction, to examine the association between serum n-3 PUFA and obesity comorbid depression and to explore the potential mechanisms underlying this association. Our major findings of epidemiology analyses showed higher DHA levels were associated with a lower odd of CODS. Mechanistic exploration through NP identified DHA’s involvement in key immune-inflammatory pathways such as TNF, hypoxia-inducible factor-1 and IL-17 signalling pathway. Furthermore, these mechanistic predictions were further supported by a significant inverse correlation between DHA levels and inflammation-related indices, potentially reinforcing its potential as a protective marine-derived lipid in the complex comorbidity.
In our multivariable-adjusted analysis, n-3 PUFA did not demonstrate significant inverse associations with central obesity-depression comorbidity in the overall participants. This lack of overall association may be partly explained by population heterogeneity and unaccounted baseline metabolic and inflammatory imbalances that may have masked their benefits in this multifactorial comorbidity. However, protective associations emerged in specific females and in middle-aged to older adults. The sex-specific effect may be attributable to oestrogen-mediated modulation of lipid metabolism and inflammatory signalling(Reference Hwang, Kim and Lee32), as oestrogen is known to interact synergistically with n-3 PUFA in regulating adipocyte function and neuroendocrine responses(Reference Parker, Cohn and O’Connor33). Meanwhile, the age-dependent pattern may reflect the progressive pathophysiology of metabolic dysregulation and chronic low-grade inflammation, which becomes more established with advancing age, thereby potentially amplifying the relative beneficial associations for marine n-3 PUFA in these individuals(Reference Franceschi, Garagnani and Parini34). Collectively, our observation of marine n-3 PUFA’ cardiometabolic and mental health benefits may be influenced by the demographic and physiological factors, with the observed effects potentially weakened when different population groups are analysed together. Future studies may prioritise elucidating the molecular interplay between sex hormones, ageing-related pathways and single marine n-3 PUFA to inform targeted nutritional interventions for obesity-depression comorbidity.
Another major finding of our study was that serum DHA levels showed a significant inverse association with obesity, which might have great benefits towards comorbid depressive symptom with obesity. To date, little to no evidence is available concerning DHA supplements alone and the metabolic-mental comorbidity. Similar with our observation, accumulative evidence from prior epidemiology studies presented the beneficial association between serum n-3 PUFA and depression(Reference Chen, Wang and Zheng35,Reference Horikawa, Otsuka and Kato36) . Nevertheless, evidence from randomised controlled trials (RCT) remains inconsistent. A 12-week RCT reported significant reductions in depressive symptoms and waist circumference (WC) in women with obesity–depression comorbidity following supplementation with 1080 mg/d EPA and 720 mg/d DHA(Reference Keshavarz, Mostafavi and Akhondzadeh7). In contrast, no significant improvement in depressive symptoms was observed in overweight individuals with depression receiving lower-dose PUFA supplementation (620 mg/day EPA and 545 mg/day DHA)(Reference Tabasi, Mostafavi and Oreyzi8). These discrepant findings may be attributed to differences in participant characteristics, including obesity and depression phenotypes, as well as variations in dosage and EPA/DHA composition. In mice model of depressive-like behaviour induced by a saturated high-fat diet, marine n-3 PUFA alleviated metabolic and exerted antidepressant effects, accompanied by favourable changes in brain lipid composition(Reference Demers, Roy and Machuca-Parra10), substantially reinforcing the observed positive findings. Although evidence of RCT remains heterogeneous, meta-analyses suggest that antidepressant effects of n-3 PUFA supplementation are more consistently observed with EPA-predominant formulations(Reference Liao, Xie and Zhang37). Different from the results of the previous studies, our favourable association with this metabolic-mental disorder may have partially explained by a stronger anti-adipogenic effects from DHA, specifically its superior capacity to suppress adipose tissue accumulation(Reference Ruzickova, Rossmeisl and Prazak38,Reference Tang, Floyd and Cai39) and to promote white adipose tissue browning(Reference Zhuang, Lu and Shou40). A 12-week RCT of seventy-two participants with diabetes reported a significant reduction in WC following DHA-enriched fish oil supplementations compared with controls(Reference Toupchian, Sotoudeh and Mansoori41). Similarly, a trial of eighteen hypertriglyceridaemia subjects observed decreases in BMI and WC with n-3 PUFA interventions(Reference Peña-de-la-Sancha, Muñoz-García and Espínola-Zavaleta42). This aligns with our population-based data, which reported a significant inverse association between DHA levels and the odds of obesity. Collectively, the prior evidence and our findings underscore that higher intake of n-3 fat to enhance DHA level may confer a dual benefit for obesity and obesity-related depression.
The findings of our mechanistic explorations through NP further revealed that the DHA’s benefits for obesity-related depression were potentially implicated with cardiometabolic dysfunction and multiple inflammatory pathway enrichments such as TNF, hypoxia-inducible factor-1 and IL-17 signalling. PPI network analysis identified PPAR-γ and PPAR-α as primary targets of DHA in modulating obesity-related lipid metabolism. DHA activates PPAR-γ to enhance insulin sensitivity and suppress pro-inflammatory cytokines, while activates PPAR-α to enhance fatty acid oxidation, lower TAG and mitigate systemic inflammation(Reference Kimura, Takahashi and Lin43). Moreover, DHA inhibits toll-like receptor 4 translocation to lipid rafts, thereby suppressing toll-like receptor 4/NF-κB signaLling cascades and downstream inflammatory cytokine productions(Reference Hwang, Kim and Lee32,Reference Puglisi, Hasty and Saraswathi44) . In hippocampal tissues, DHA may reduce the levels of IL-6, IL-1β and TNF-α by modulating IL-17/Th17 signalLing, as demonstrated in depressive-like mouse models(Reference Hu, Zeng and Yang45,Reference Wang, Balvers and Hendriks46) . DHA also can target the hypoxia-inducible factor-1 signalling pathway, which regulates cellular responses to hypoxia by inducing genes involved in reactive oxygen species clearance, thereby mitigating inflammation and apoptosis(Reference Palazon, Goldrath and Nizet47). Finally, the NP results were partially validated in our additional analyses. Emerging evidence highlights monocytes, neutrophils, and lymphocytes – integrated with HDL as novel biomarkers such as MHR, NHR, lymphocyte:HDL ratio and SII – as reflective of metabolic dysfunction and oxidative stress in chronic low-grade inflammation(Reference Wei, Wang and Li48). In our additional correlation analyses, serum DHA levels showed significant inverse correlations with reduced inflammation, as indicated by peripheral blood cell subsets and their combinations with HDL-cholesterol. In supportive of the validation results, a cohort study reported that DHA intakes and plasma-based biomarker were inversely correlated with neutrophils, monocytes, and platelets(Reference He, Huang and Wang49). Similarly, erythrocyte DHA levels were found to be inversely correlated with estimated inflammatory indices such as AISI, SII. These prior results align with our present correlational analysis, collectively supporting the potential inflammation mechanism of actions underlying the DHA’s dual role in addressing metabolic disorder and neuroinflammation.
Several possible limitations need to be acknowledged when our findings were interpreted. First, this study is a cross-sectional design, inherently limiting the ability to draw causal inferences. Future prospective studies are needed to validate the observed associations. Second, NP identified potential DHA’s targets and relevant pathways in attenuating the obesity-depression comorbidity; however, this requires additional in vivo and in vitro experiment validations. Our correlational analyses using estimated inflammatory indices provide partial support but should be interpreted cautiously, without robust laboratory confirmation. Third, depression was evaluated using two different self-reported scales (the Composite International Diagnostic Interview and the Patient Health Questionnaire-9), which may introduce measurement variability. However, both instruments are well validated and widely used in NHANES. Fourth, although we used multiple adjustments in statistical models to balance confounder variables, possibility of residual bias cannot be ruled out. Fifth, serum fatty acids were used because erythrocyte membrane data were unavailable at the time of our current analysis. Serum levels reflect recent n-3 status only and are susceptible to short-term dietary changes, whereas erythrocyte membrane levels may indicate a longer-term intake. Future studies using erythrocyte-based n-3 indices are warranted. Finally, as this study was conducted among US population, the findings may not fully extend to other ethnic or geographic groups. Further research in diverse populations is warranted.
Conclusion
Higher levels of serum DHA were significantly associated with reduced odds of central obesity comorbid with depressive symptoms in US adults. Additionally, network pharmacology analysis descriptively suggested that anti-inflammatory mechanisms may partially underlie this association. As the evidence from integrative epidemiology with bioinformatics, this highlights the potential of marine-derived n-3 PUFA, particularly DHA in prevention and management of obesity comorbid depression. Further RCTs are needed to validate their efficacy in alleviating this complex comorbidity.
Supplementary material
For supplementary material/s referred to in this article, please visit https://doi.org/10.1017/S0007114526108198
Data availability statement
The original data used in this manuscript are from the National Health and Nutrition Examination Survey (NHANES), which is available to the public through the Centers for Disease Control and Prevention (CDC) website. The specific datasets from the 2003–2004, 2011–2012 and 2013–2014 cycles can be downloaded at https://wwwn.cdc.gov/nchs/nhanes/default.aspx.
Acknowledgements
We thank all study participants and research staff for their valuable time and commitment to this study.
Author contributions
Gexin Gao: Methodology-Equal, Writing – original draft-Equal; Enyu Lou: Data curation-Equal, Visualisation-Equal, Writing – original draft-Equal; Ya Chen: Data curation-Equal, Visualisation-Equal, Writing – original draft-Equal; Haoran Zhang: Formal analysis-Equal, Writing – review & editing-Equal; Heng Lan: Formal analysis-Equal, Writing – review & editing-Equal; Jungu Jin: Formal analysis-Equal, Validation-Equal; Yu-Hsin Chen: Formal analysis-Equal, Writing – review & editing-Equal; Halliru Zailani: Formal analysis-Equal, Writing – review & editing-Equal; Ayesha Zafar Iqbal: Formal analysis-Equal, Writing – review & editing-Equal; Wei Chen: Software-Equal; Qingxi Jiang: Software-Equal, Validation-Equal; Jia Li: Formal analysis-Equal, Writing – review & editing-Equal; Kuan Pin Su: Supervision-Equal, Writing – review & editing-Equal; Bo Yang: Conceptualisation-Equal, Methodology-Equal, Supervision-Equal, Writing – review & editing-Equal.
Financial support
This work is supported by the Programs Foundation of the Wenzhou Medical University of Zhejiang Province, China (grant number 89217015), the Scientific Technician Funding of Wenzhou Science and Technology Bureau (grant number X20210055), the Basic Medicine Funding of Wenzhou Science and Technology Bureau (grant number Y20180195) and by the 2017 Chinese Nutrition Society (CNS) Nutrition Research Foundation – DSM Research Fund (grant number 95017008), the Scientific Technician Funding of Wenzhou Science and Technology Bureau (grant number Y20240120), Zhejiang Provincial Higher-Education Teaching Reform Project (grant number JGBA2024311), the National Undergraduate Innovation and Entrepreneurship Training Program (grant number 202410343009), the Science and Technology research Plan of Jinhua city, China (grant number 2022-3-114) and the Zhejiang Provincial Natural Science Foundation of China (grant numbers LMS26H260002). The funders have no role in study design, data collection and analysis or publication of the manuscript.
Competing interests
The authors declare that they have no competing interests.
Ethical statement
All NHANES protocols were approved by the NCHS Research Ethics Review Board (Protocol #98- 12, Protocol #2011-17, Continuation of Protocol #2011-17) and informed consent was obtained at participant enrollment.