





1. Introduction
One of the most ubiquitous fluid flow phenomena in fluid mechanics involves the motion of two immiscible fluids on a solid surface. Examples range from the sliding of water drops on windowpanes and the spreading of droplets on paper in ink-jet printing to the coating industry where a thin film of a liquid is deposited on a solid surface. A common theme in all these problems is the presence of a three-phase contact line at the intersection of the three phases (typically solid, liquid and gas). The value of the contact angle, often measured in the liquid phase, determines the wettability of the surface. In static systems on smooth substrates, the value of the contact angle is related to the surface energies of the three surfaces and is given by Young's law. But when the contact line is in motion, the problem becomes significantly more complex. First, the problem ceases to be in thermodynamic equilibrium, thus, the dynamic contact angle,  $\theta _d$, deviates from the static equilibrium contact angle,
 $\theta _e$. Second, application of the standard no-slip boundary condition at the solid surface leads to a stress singularity at the contact line (Huh & Scriven Reference Huh and Scriven1971) that leads to a logarithmic divergence in the dissipation as one approaches the contact line (Bonn et al. Reference Bonn, Eggers, Indekeu, Meunier and Rolley2009). Third, the interface shape departs from the static shape and needs to be determined simultaneously along with the flow field. Surprisingly, despite the singularity, Huh & Scriven (Reference Huh and Scriven1971) (HS71 hereafter) shows that the flow fields away from the contact line are well defined and depend only on the contact angle of the wedge flow and the viscosity ratio.
Over the last few decades, several important advances have been made to deal with the above issues in the viscous limit, i.e. where the inertia of the fluid is negligible. Such a limit is obtained either by using very viscous fluids or by restricting the domain of interest to regions very close to the contact line such that the local Reynolds number (ratio of inertia to viscous forces) remains small. These viscous theories (Blake & Haynes Reference Blake and Haynes1969; De Gennes Reference De Gennes1985; Cox Reference Cox1986; Shikhmurzaev Reference Shikhmurzaev1993), derived in the limit  $Re \ll 1$ and
 $Ca \ll 1$, aim to relate the dynamic contact angle,
 $\theta _d$, to the contact line velocity. The singularity at the moving contact line is relieved by incorporating additional physics at the moving contact line. In particular, Cox (Reference Cox1986) introduced slip at the contact line, divided the flow into three regions as shown schematically in figure 1, and used matched asymptotic techniques to match the ‘inner’ slip-dominated region to a geometry dependent ‘outer’ region using an ‘intermediate’ region. This results in a simple model for the dynamic contact angle,
 $\theta _d$, as a function of the capillary number,
 $Ca=\mu _{oil}U/\gamma$, the viscosity ratio,
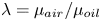 $\lambda =\mu _{air}/\mu _{oil}$, and the ratio of the slip length to a characteristic scale of the outer region,
 $\epsilon = l_s/L$. For drops sliding down an incline, the characteristic outer scale,
 $L$, is a typical size of the drop whereas for plate advancing experiments,
 $L$ could be taken to be the capillary length. More recent models, such as the interface formation model of Shikhmurzaev (Reference Shikhmurzaev1997), are similar to Cox's model in one key aspect. In all these models, the flow field in the intermediate region is identical to HS71's solution. Hence, a careful test of HS71's solution will also serve to test the intermediate region in Cox's model and several other similar models. Using careful experiments, it should be possible to determine the nature of the flow at a length scale much smaller than the scale of the outer region that is likely to correspond to the intermediate region shown in figure 1.
Different regions of the flow near a moving contact line as per Cox (Reference Cox1986).

Many simple theoretical slip models have been proposed to alleviate the singularity at the moving contact line. Dussan V. (Reference Dussan V.1976) explored various models for slip along the moving plate and showed that the flow fields are the same and independent of the exact nature of the slip model when viewed at the ‘meniscus’ length scale, i.e. at a length scale far away from the slip length scale. Sheng & Zhou (Reference Sheng and Zhou1992) employed three phenomenological slipping models and determined the flow using numerical techniques. In recent years, Kirkinis & Davis (Reference Kirkinis and Davis2013, Reference Kirkinis and Davis2014) employed an algebraic slip model with perfect slip at the contact line and no-slip at a finite distance away from the contact line and obtained the flow fields in the ‘inner region’ of the flow. This approach was further refined and extended by Febres & Legendre (Reference Febres and Legendre2017) for a two-fluid system. In the above two approaches, an extra complex parameter,  $n$, is introduced in the streamfunction similar to what was employed by Moffatt (Reference Moffatt1964), and
 $n$ is determined by solving an eigenvalue problem. Unfortunately, there appear to be infinitely many possibilities for
 $n$ each of which result in a different flow field making it difficult to directly test the results against experiments. Theoretical models have been developed for the dynamic interface shape, for example, Dussan V., Ramé & Garoff (Reference Dussan V., Ramé and Garoff1991) extended Cox's model by incorporating the static shape in the outer region. A more direct approach was used by Chan et al. (Reference Chan, Srivastava, Marchand, Andreotti, Biferale, Toschi and Snoeijer2013) and Chan et al. (Reference Chan, Kamal, Snoeijer, Sprittles and Eggers2020) who derived a differential equation for the dynamic meniscus incorporating slip at the moving wall. Kulkarni, Fullana & Zaleski (Reference Kulkarni, Fullana and Zaleski2023) recently obtained theoretical expressions for the streamfunction using a variety of new slip boundary conditions. Some of the above theoretical models are discussed in detail in § 3.
While a great number of experimental studies have focused on testing the relationship between the dynamic contact angle and the capillary number, there are relatively few studies focusing on the flow fields and the interfacial speeds. In an early experimental study, Dussan V. & Davis (Reference Dussan V. and Davis1974) studied the motion of highly viscous liquid drops (honey and glycerol,  $\lambda \ll 1$) and showed that the large-scale motion in the vicinity of the advancing contact line is of the ‘rolling type’, i.e. the fluid particles at the interface approach the contact line and then roll beneath the drop. Hoffman (Reference Hoffman1975) carried out systematic measurements of the dynamic contact angle by studying motion in a horizontal capillary tube with five different fluids and showed the existence of a universal relationship between the dynamic contact angle and the capillary number. Dussan V. et al. (Reference Dussan V., Ramé and Garoff1991) carried out controlled dipping of a tube inside a liquid bath and measured the shape of the interface. They amended the model of Cox by incorporating the interface shape from the outer solution allowing them to theoretically match the interface shape with experiments over a wide range of length scales. Le Grand, Daerr & Limat (Reference Le Grand, Daerr and Limat2005) carried out experiments with silicone oil and polydimethylsiloxane (PDMS) drops and focused on the shape of the drop moving down an incline. They also compared the dynamic contact angles with various models published in the literature. All the above studies focus on the variation of the dynamic contact angle with speed. Chen, Ramé & Garoff (Reference Chen, Ramé and Garoff1997) carried out tube-advancing experiments in highly viscous liquids (PDMS) and obtained flow fields using particle image velocimetry (PIV) techniques. All their experiments were carried out at moderate to high
 $Ca$ and at obtuse angles, i.e.
 $\theta _d > 90^{\circ }$. To compare the flow fields with the fixed wedge theory of HS71's theory, Chen et al. (Reference Chen, Ramé and Garoff1997) allowed the angle to vary along the interface and incorporated this angle in the solution of HS71's theory. It has to be noted that this solution, referred to as the ‘modulated wedge solution (MWS)’, is not an exact solution of the biharmonic equation in a curved wedge.
To the best of our knowledge, there are no systematic experiments at low  $Re$ and low
 $Ca$ with
 $\theta _d < 90^{\circ }$ where direct comparison with theory has been carried out. This regime is usually difficult to achieve in experiments with advancing drops since drops usually assume a contact angle greater than
 $90^{\circ }$ before moving down an incline unless specialized coatings are applied on the surface of the substrate, as was the case in Rio et al. (Reference Rio, Daerr, Andreotti and Limat2005). To overcome this difficulty, we use plate advancing experiments with a glass plate dipped into a bath of silicone oil at controlled speeds. As per the theoretical framework of HS71, the problem is fully determined by just two parameters: the viscosity ratio,
 $\lambda$, and the dynamic contact angle,
 $\theta _d$. Figure 2 shows the parameter regime explored in the present work and the shaded region corresponds to the region of parameter space where the dynamic contact angle is acute. The solid curve in figure 2 indicates a critical viscosity ratio from HS71 theory where the interface remains motionless. As per the theory of HS71, in the shaded region, all fluid particles at the interface approach an advancing moving contact line. This has been shown to be true in several studies for advancing contact lines, except that all the earlier studies are for
 $\theta _d > 90^{\circ }$. The present study fills this gap in the literature by conducting systematic experiments for advancing contact lines with
 $\theta _d<90^{\circ }$, thus providing valuable data against which numerical models can be tested. Furthermore, the interfacial velocity from the present study can also be directly used as boundary conditions in numerical models to alleviate the singularity at the dynamic contact line.
Operating regime map in the viscosity ratio  $\lambda$ and dynamic contact angle
 $\theta _d$ plane. The solid black curve represents the theoretical prediction of HS71 for critical viscosity ratio,
 $\lambda _c$, corresponding to a motionless interface. All symbols correspond to experimental data points for fluids with different viscosities. Streamfunction plots will be shown later in the paper for data points shown with a black dot. The shaded region corresponds to
 $\theta _d < 90^{\circ }$ and
 $\lambda \lesssim 1$, a largely unexplored region of parameter space in the literature for advancing contact lines.

The paper is organized as follows. In § 2 we describe the experimental set-up and flow visualization techniques employed. A review of earlier theoretical work is discussed in § 3 along with the derivation of the MWS suitable for the present geometry. Key results, which include flow fields obtained from PIV experiments, determining the interface shape and interface speeds, and comparison with theoretical predictions are discussed in § 4. We conclude the paper in § 5 with a brief discussion of key outcomes and future directions.
2. Experimental set-up and data analysis
The experimental set-up used in the current study is shown schematically in figure 3. A thin glass plate with dimensions  $75\,{\rm mm}\times 25\,{\rm mm} \times 1\,{\rm mm}$ was dipped into an acrylic tank of dimensions
 $100\,{\rm mm}\times 100\,{\rm mm} \times 27\,{\rm mm}$ at a constant speed. A motorized traverse with a stepper motor was used to vary the speed of the plate from
 $100\,\mathrm {\mu }{\rm m}\,{\rm s}^{-1}$ to
 $2\,{\rm cm}\,{\rm s}^{-1}$. A DM542 digital microstepper driver was connected to a computer through a data acquisition system from National Instruments. To ensure that a contact line is present in all the experiments, we only allowed the plate to dip into the liquid bath. This restricts our experiments only to advancing cases. To prevent contamination, the glass plate and the tank were thoroughly cleaned with isopropyl alcohol followed by distilled water, and dried before each experiment. The meniscus was illuminated using a thin laser sheet (thickness of approximately 0.5 mm) that was created by a combination of biconvex and cylindrical plano-convex lenses from a 532 nm 2W diode laser. We placed a spherical biconvex lens and two cylindrical plano-convex lenses at distances of 25 mm, 235 mm and 335 mm from the laser. The focal lengths of the lens are 150 mm, 75 mm and 100 mm. The flow was seeded with polyamide particles of an average diameter of
 $5\,\mathrm {\mu }{\rm m}$ for all the experiments. To ensure that the particles faithfully follow the flow, we require the Stokes number to be very small. The Stokes number (
 $St$), defined as the ratio of particle relaxation time scale (
 $t_p$) to flow time scale, i.e.
 $St=t_p/(l_c/U)$, ranged from
 $2\times 10^{-10}$ to
 $2.2\times 10^{-6}$ over the entire range of velocities. The particle relaxation time based on the density and diameter of the particle,
 $t_p = \rho _p d_p^2/(18 \mu _{oil})$, was always less than
 $0.2\,\mathrm {\mu }{\rm s}$. All PIV images were captured using a Photron Fastcam Nova S9 high-speed camera connected to a macro lens with the camera being placed perpendicular to the laser sheet. The images were captured at frame rates ranging from 10 fps to 1000 fps depending on the speed of the plate. To ensure that the surface level of the fluid did not increase when the plate was dipped into the liquid bath, a programmable syringe pump was employed to withdraw fluid at a prescribed flow rate from the bottom of the tank. In all the experiments the interface shape and the flow settled into a steady state after a short transient. Only the PIV images after this initial transient were processed. The steady nature of the flow allowed us to also generate streakline images, and a sample image obtained from the experiment is shown in figure 4. The absence of crossings in the streaklines indicates that the flow is indeed steady (also see supplementary material available at https://doi.org/10.1017/jfm.2024.486 for a sample transient image).
A schematic of the PIV experimental set-up with the following key components: (i) rectangular tank, (ii) glass slide, (iii) motorized traverse mechanism with DC power source and controller, (iv) laser with controller and power source along with associated optics to produce a thin laser sheet, (v) camera with a macro lens, (vi) programmable syringe pump used to maintain a constant liquid level.

A streakline image for 500 cSt silicone oil at  $Re = 3.92 \times 10^{-4}$ and
 $Ca = 4.19 \times 10^{-3}$. The glass plate, represented by a grey vertical slab is immersed in a liquid bath at constant speed. The blue solid curve represents the interface between the liquid and air, whereas the red arrow represents the direction of the flow in the liquid phase.

A digital delay generator was used to synchronize the laser and the high-speed camera. The field of view of the high-speed camera with the macro lens varied from  $4.2\,{\rm mm} \times 4.2\,{\rm mm}$ to nearly
 $8\,{\rm mm} \times 8\,{\rm mm}$ with a spatial resolution in the range of
 $4\,\mathrm {\mu }{\rm m}\,{\rm pixel}^{-1}$ to nearly
 $8\,\mathrm {\mu }{\rm m}\,{\rm pixel}^{-1}$. Preprocessing of the images was performed prior to the PIV analysis, including average background subtraction, image equalization and masking. The particle images were analysed using a multigrid, window-deforming PIV algorithm. In addition, since the flow is steady, an ensemble PIV correlation was employed to improve the signal-to-noise ratio in a small interrogation window (typically
 $8\text { pixels} \times 8\text { pixels}$).
As shown in figure 2, the primary goal of this paper is to investigate advancing contact angles with dynamic contact angle  $\theta _d < 90^{\circ }$. This was most easily achieved with the immersion of a glass plate into a bath of silicone oil at low speeds. The properties of the silicone oils used in the experiments are given in table 1. The wetting properties of the glass substrates were also characterized by measuring the static advancing and receding angles with the help of a contact angle meter (Kruss DSA25S). As clearly evident in table 2, the static hysteresis in all the experiments was found to be very small.
Properties of the fluids used in the experiments.

Characterizing the hysteresis for silicone oils on glass substrates.

 $^{a}$Since there is an overlap in the error bars in the receding and advancing angles, only the mean value of the hysteresis is reported.
To determine the interface location and shape, several particle images were combined and the locus of particle streaks at the interface are considered to be representative of the interface itself. The interface angle was determined by fitting a two-term exponential function to the interface data points in the form
 \begin{equation} p(x) = c_1 e^{c_2 x} + c_3 e^{c_4 x}, \end{equation}
which resulted in an excellent fit for all experiments with an  $R$-square value always above
 $0.99$. The local angle along the interface was then determined from this fit. Dynamic contact angles for various capillary numbers shown in figure 5 were compared with the classical study of Hoffman (Reference Hoffman1975). Despite the differences in the geometry between the present study and that of Hoffman, the collapse of all contact angle data in the two experiments shows that the relation between dynamic contact angle and capillary number is universal. Fitting the Cox–Voinov model of the form
 $\theta _d^3-\theta _e^3 = A\,Ca$, the data of Hoffman (Reference Hoffman1975) results in the value of the slope as
 $A\approx 81.1$, which is very close to the value 78.7 in the present experiments. More information about comparison with dynamic contact angle models is available in the supplementary material.
Variation of dynamic contact angle,  $\theta _d$, with an adjusted capillary number,
 $Ca + F(\theta _e)$. Here
 $F(\theta _e)$ represents the shift factor that compensates for the effect of static contact angle in terms of
 $Ca$. The shift factor is calculated considering
 $\theta _d = \theta _e$ and the corresponding value of
 $Ca$ is assigned to
 $F(\theta _e)$. All the markers in black are taken from Hoffman (Reference Hoffman1975) and those in red (
 , red) represent present data obtained using different grades of silicone oil.

In the next section we discuss the theoretical basis for the comparison of flow fields from experiments with models.
3. Theoretical background
The earliest theoretical models for moving contact lines were aimed at developing a local model valid only in the vicinity of the contact line. A schematic of such a ‘local’ framework is shown in figure 6(a) where the dynamics is governed by the Stokes equations for  $r \ll L$ with
 $L$ being the macroscopic length scale in the problem. Huh & Scriven (Reference Huh and Scriven1971) were among the first to develop a simple model of a moving contact line assuming the interface to be flat and employing the no-slip condition on the moving wall. Their study showed the presence of a singularity in the shear stress at the contact line. Nevertheless, their model predicts flow fields in both phases that have regular and smooth behaviour away from the contact line. A key prediction in the HS71 model is that the higher viscosity fluid exhibits a rolling motion and the lower viscosity fluid exhibits a split-streamline motion. This means that the fluid particles at the interface move towards the moving contact line in an advancing contact line problem as shown in figure 6(b).
(a) Cylindrical polar coordinate system  $(r,\theta )$ used in HS71 for flow in a flat wedge separating two immiscible fluids, A and B, with a constant wedge angle
 $\phi$, caused by a plate moving at constant speed
 $U$. (b) Typical flow pattern predicted by HS71's theory when
 $\lambda \ll 1$. The arrow at the interface represents the direction of motion of fluid particles along the interface. When fluid B undergoes a ‘rolling’ motion, fluid A exhibits a ‘split-streamline’ motion with the splitting streamline shown by a dashed line. (c) Coordinate system for a wedge with a curved interface with angle
 $\beta$ varying along the interface.

To relieve the HS71 singularity, slip models (Cox Reference Cox1986; Kirkinis & Davis Reference Kirkinis and Davis2013, Reference Kirkinis and Davis2014; Febres & Legendre Reference Febres and Legendre2017) were subsequently developed. Cox (Reference Cox1986), in a seminal paper, developed an asymptotic model by dividing the flow into three regions: an outer region where the interface shape is affected by the geometry of the problem, a slip-dominated inner region in the vicinity of the moving contact line and an intermediate region merging these two regions as shown in figure 1. The model of Cox (Reference Cox1986) is valid in the limit of  $Re \ll 1$ and
 $Ca \ll 1$ where
 $Re = \rho U L/\mu$ and
 $\mu$ is typically taken to the viscosity of the more viscous phase. This restriction on
 $Re$ ensures that the flow in the intermediate and inner regions is always in the viscous regime. By ‘intermediate’ region we refer to regions of interest that are smaller than the macroscopic length scale,
 $L$:
 $l_s \ll l_i < L$. Sibley, Nold & Kalliadasis (Reference Sibley, Nold and Kalliadasis2015) noted that distinct inner and outer regions exist with an intermediate region sandwiched between the two, consistent with figure 1, if the following conditions hold:
 \begin{equation} r_{outer} \gg L \mathrm{e}^{{-}1/|Ca|} \quad \text{and} \quad r_{inner} \ll l_s \mathrm{e}^{1/|Ca|} \quad \implies \quad \left|Ca \ln \left(\frac{l_s}{L}\right)\right| \ll 2. \end{equation}
Here,  $r_{inner}$ and
 $r_{outer}$ define the radial extent of the intermediate region between the inner and outer regions as shown in figure 1. The slip length,
 $l_s$, is typically in nanometres, thus, the above condition will always be satisfied if the capillary number is kept small, typically less than or equal to
 $10^{-2}$. This ensures that there is a distinct and wide intermediate region in the experiments.
3.1. Models for flow fields
In our experiments the geometry resembles that of a wedge formed between a vertically moving plate and a curved interface. Our aim is to compare flow fields from experiments in this geometry with well-known models in the literature. Following the seminal work of Moffatt (Reference Moffatt1964) who determined the flow in a wedge formed between two flat plates, HS71 determined the flow in a wedge formed between a moving plate and a flat interface, and was subsequently amended by Chen et al. (Reference Chen, Ramé and Garoff1997) to incorporate the effects of a curved interface.
3.1.1. Fixed wedge solution
The ‘local’ solution developed by HS71 assumes the interface to be flat as shown in figure 6(a). The flow in the vicinity of the moving contact line is governed by the biharmonic equation for the streamfunction Moffatt (Reference Moffatt1964),
 \begin{equation} \nabla^4 \psi = 0, \end{equation}
where the velocity components are defined as
 \begin{equation} v_r = \frac{1}{r}{\frac{\partial\psi}{\partial\theta}}, \quad v_{\theta} ={-}{\frac{\partial\psi}{\partial r}}. \end{equation}
The solution of the biharmonic equation can be assumed to be of the form (Moffatt Reference Moffatt1964; Huh & Scriven Reference Huh and Scriven1971)
 \begin{equation} \psi(r,\theta) = r(a \sin \theta + b \cos \theta + c \theta \sin \theta + d \theta \cos \theta). \end{equation}
Using conditions of no-slip, no-penetration on the moving solid surface, continuity of tangential velocity and tangential stress at the interface (no Marangoni effects), the streamfunction reduces to
 \begin{equation} \psi(r,\theta;\phi) = rf(\theta,\phi) = rU\left(\frac{\phi\sin\theta - \theta\sin\phi \cos(\theta -\phi) }{\phi - \sin\phi \cos\phi}\right). \end{equation}
In the above expression the gas above the liquid is assumed to be passive, i.e.  $\lambda = 0$. It can be easily shown that the shear stress obtained from the above expression diverges like
 $1/r$ as
 $r\rightarrow 0$. In the HS71 framework, the interfacial velocity,
 $v_i^{HS}$, is identically equal to the radial velocity and is independent of the radial location along the interface and is given by
 \begin{equation} v_i^{HS} = v_r(r,\phi) = U \left(\frac{\phi \cos \phi - \sin \phi}{\phi - \sin \phi \cos \phi}\right). \end{equation}
In experiments the interface is always curved due to the presence of external forces such as gravity that induces a mean curvature to the interface. To facilitate a comparison of the streamfunction with experiments, we modify (3.5) for a curved interface. The recipe for doing this was first given by Chen et al. (Reference Chen, Ramé and Garoff1997).
3.1.2. Modulated wedge solution
If the interface is curved, shown schematically in figure 6(c), with the interface angle at any radial position given by  $\beta (r)$, then the streamfunction in (3.5) can be modified by replacing the constant angle
 $\phi$ with a variable angle
 $\beta (r)$:
 \begin{equation} \psi(r,\theta;\beta(r)) = rf(\theta,\beta) = rU\left(\frac{\beta\sin\theta - \theta\sin\beta \cos(\theta -\beta) }{\beta - \sin\beta \cos\beta}\right). \end{equation}
This solution, also used by Chen et al. (Reference Chen, Ramé and Garoff1997), is referred to as the MWS. The above solution is identical to the leading-order solution in the intermediate region given by Cox (Reference Cox1986). As one approaches the contact line, the modulated wedge angle  $\beta$ approaches the fixed wedge angle
 $\phi$. Therefore, as
 $r \rightarrow 0$, the expressions (3.5) and (3.7) become identical. This allows us to make a three-way comparison between the HS71 solution, the MWS and experiments.
The function  $\beta (r)$ can be obtained from experiments and inserted into (3.7) to obtain the streamfunction everywhere in the fluid domain. The radial and tangential velocities can also be easily computed as
 \begin{gather} v_r(r,\theta;\beta) = \frac{\partial f}{\partial\theta}, \end{gather}
 \begin{gather}v_{\theta}(r,\theta;\beta) ={-}f - r\frac{\partial f}{\partial \beta}\frac{\partial \beta}{\partial r}. \end{gather}
Using the expression for  $f(\theta,\beta )$ from (3.7), we have
 \begin{gather} \frac{v_r(r,\theta;\beta)}{U} = \frac{\beta \cos\theta + \theta \sin \beta \sin (\theta - \beta) - \sin \beta \cos (\theta-\beta)}{\beta - \sin\beta \cos\beta}, \end{gather}
 \begin{gather} \frac{v_{\theta}(r,\theta;\beta)}{U} = \frac{-\beta \sin\theta + \theta\sin \beta \cos (\theta-\beta)}{\beta - \sin\beta \cos\beta} \nonumber\\ + r\frac{{\rm d}\beta}{{\rm d}r} \left(\frac{2\sin^2\beta(\beta \sin\theta - \theta\sin\beta \cos(\theta-\beta))}{(\beta - \sin\beta \cos\beta)^2} - \frac{\sin\theta -\theta \cos(2\beta - \theta)}{\beta - \sin\beta \cos\beta}\right). \end{gather}
The velocity at the interface can be obtained in terms of radial and angular velocity components by setting  $\theta = \beta$ in (3.10) and (3.11),
 \begin{equation} v_i^{MWS} = v_r(r,\beta) \cos(\alpha-\beta) + v_{\theta}(r,\beta) \sin(\alpha-\beta), \end{equation}
where  $\alpha (r)$, shown in figure 6(c), is a measure of the slope of the interface and is related to
 $\beta (r)$ by the expression
 \begin{equation} \alpha(r) = \beta(r) + \tan^{{-}1}\left(r{\frac{{\rm d}\beta}{{\rm d}r}}\right). \end{equation}
After simplification, the expression (3.12) reduces to
 \begin{equation} v_i^{MWS} = \frac{U}{\cos(\alpha - \beta)}\left(\frac{\beta \cos \beta - \sin \beta}{\beta - \sin \beta \cos \beta}\right). \end{equation}
At the contact line,  $\alpha =\beta =\phi$. Equation (3.14) reduces to the HS71 solution in (3.6) as
 $r\rightarrow 0$. But for other radial positions, the interfacial speed
 $v_i^{MWS}$ will no longer be the same as
 $v_i^{HS}$ but will increase in magnitude while moving away from the contact line and then becomes constant as the change in the difference (
 $\alpha -\beta$) becomes small.
The expression for interface shape, expressed in terms of  $\beta (r)$, can fully describe the flow field using the streamfunction (3.7). In the next section we apply analytical models and show how interface shapes in the intermediate and outer regions can be compared against experiments.
3.2. Models for complete interface shape
In the present problem there are three main forces at play: viscous forces, surface tension and gravity. Inertia is negligible if the Reynolds number is kept small as is the case in the present study. Far away from the plate, surface tension and gravity are in balance with each other leading to the formation of a static meniscus. However, near the plate, viscous forces created due to the moving plate cannot be ignored. In steady state, viscous forces balance surface tension in the vicinity of the moving contact line. The subtle balance of the three forces and the extent of the static effects is dictated by the value of  $Ca$. In the low
 $Ca$ limit, viscous effects remain confined to very small regions near the moving wall while the interface shape away from the wall is dictated by the balance of surface tension to gravity. The deviation of the dynamic meniscus from the static meniscus can be referred to as viscous deformation. Hence, in the low
 $Ca$ limit, viscous deformation is small while it is large in the moderate to high
 $Ca$ limit.
In most theoretical models the apparent contact angle is related to the equilibrium contact angle and the hydrodynamics of the flow. In the case of the Cox–Voinov relationship (see the review of Snoeijer & Andreotti (Reference Snoeijer and Andreotti2013) for more details), we have
 \begin{equation} \theta_{ap}^3 = \theta_e^3 + 9 Ca \ln\left(\frac{L}{l_s}\right), \end{equation}
where  $L$ is the outer (macroscopic length) that is equal to the capillary length in the present study and
 $l_s$ represents an inner (microscopic) length over which the singularity is regularized (also see figure 1). According to such theoretical models, as one approaches the contact line from the intermediate to the inner region, the interface rapidly bends to meet the equilibrium contact angle at the wall. This rapid change in shape of the interface to satisfy the equilibrium contact angle is referred to as viscous bending. Unlike viscous deformation that can be observed in experiments, viscous bending is beyond the reach of experiments. Even if viscous bending exists in real flows, it exists only over very small length scales, typically in the range of nanometres to fractions of micrometres from the wall. A simple estimate for the scale of the inner region can be obtained by letting the equilibrium contact angle be very small, i.e.
 $\theta _e \rightarrow 0$. In this case, the Cox–Voinov relationship can be used to estimate the length of the inner region as
 \begin{equation} l_s \sim L \exp{\left(\frac{-\theta_{ap}^3}{9 Ca}\right)}. \end{equation}
The above length scale is also a simple estimate for the length scale of viscous bending. For  $\theta _{ap} = {\rm \pi}/3$, we obtain
 $l_s/L \approx 2.8 \times 10^{-6}$ when
 $Ca = 0.01$, while it is 0.88 when
 $Ca=1$. Using
 $L = l_c = 1500\,\mathrm {\mu }{\rm m}$, it is evident that viscous bending persists over a length of
 $4.3\,{\rm nm}$ to
 $1300\,\mathrm {\mu }{\rm m}$ for the above range of
 $Ca$.
The above discussion clearly shows that there is a large variation in the length scale between the inner and outer regions in the low  $Ca$ limit. Distinct models have been developed to account for the variation of interface shape. The first model relies on developing a composite solution for the interface shape by using the Cox model. This composite solution is parameterized by a single scalar parameter that is determined by matching the solution to experiments. The second approach uses a generalization of lubrication equations and reduces the problem to a system of coupled differential equations.
Recall that in the three-region framework of Cox (Reference Cox1986), the inner slip-dominated region is matched to an outer region via an intermediate region. Since the inner region is often beyond the resolution of any experiment, a direct comparison of interface shape with the Cox model with experiments is likely to result in poor agreement. To improve the prediction of interface shape over all length scales, it is necessary to incorporate the effect of the outer region that may be dominated by other forces such as gravity. Dussan V. et al. (Reference Dussan V., Ramé and Garoff1991) precisely carried out such an extension, referred to as the DRG model hereafter.
In the DRG model the problem of finding the full interface shape is reduced to a search for a single algebraic parameter, termed  $\omega _0$. In the absence of motion, an interface deforms near the plate forming a static meniscus of characteristic length
 $l_c$, the capillary length. According to the classical three-layer model of Cox (Reference Cox1986), the interface shape in the intermediate region is given by
 \begin{equation} g(\alpha)\sim d_0 + Ca\ln(r/l_c), \end{equation}
where the function  $g(x)$ is given by
 \begin{equation} g(x) = \int^x_0 \frac{t - \cos t \sin t}{2\sin t} \,{\rm d}t. \end{equation}
The viscosity ratio,  $\lambda$, has been assumed to be negligible in the above expression for simplicity, though it can be included as per the full Cox model without any difficulty. Following Cox (Reference Cox1986), matching the solutions between the intermediate region and the inner region (see figure 1), we obtain
 \begin{equation} d_0 = g(\theta_{e}) + Ca\ln(l_c/l_s), \end{equation}
where  $l_s$ is the slip length and
 $\theta _{e}$ is the microscopic contact angle. Combining (3.17) and (3.19), we obtain
 \begin{equation} g(\alpha) = g(\theta_{e}) + Ca\ln(r/l_s). \end{equation}
Similarly, by matching the outer to the inner solution (see Dussan V. et al. Reference Dussan V., Ramé and Garoff1991), we obtain
 \begin{equation} d_0 = g(\omega_0), \end{equation}
where  $\omega _0$ plays the same role as the apparent contact angle. Dussan V. et al. (Reference Dussan V., Ramé and Garoff1991) showed that
 $\omega _0$ can be determined by matching the interface shape from the analytical model with experimental data. In the outer region the interface shape is dictated by the shape of the static interface such that it matches the solution in the intermediate region. For example, the shape of a static meniscus would be determined not only by the far-field boundary conditions where the slope of the interface vanishes but also by a boundary condition on the plate. In the same way, the outer solution will have to be parameterized by an ‘effective’ contact angle boundary condition that is equal to
 $\omega _0$. This is shown schematically in figure 7(a). Let us assume that the interface shape in the outer ‘static’ region assumes the form
 \begin{equation} \theta_s(r) = f_0\left(\frac{r}{l_c};\omega_0\right), \end{equation}
where  $\theta _s(r)$, shown in figure 7(a), is a local slope estimated along the static interface. The exact form of
 $f_0$ for a two-dimensional static meniscus is given in § 4.1. Matching the intermediate solution (3.17) to (3.21), we obtain an expression for the interface angle given by
 \begin{equation} g(\alpha)=g(\omega_0) + Ca\ln\left(\frac{r}{l_c}\right). \end{equation}
The composite DRG solution is obtained by adding the static and Cox solutions, i.e. (3.22) and (3.23), to give
 \begin{equation} \alpha(r) = g^{{-}1}\left[g(\omega_0)+Ca\ln\left(\frac{r}{l_c}\right)\right] + \left({\theta_s(r)} - \omega_0\right). \end{equation}
The parameter,  $\omega _0$, can be interpreted as an empirical parameter that can be evaluated by matching (3.24) with an experimentally obtained interface shape.
(a) The geometrical set-up for the DRG model with the outer solution,  $h_s(x)$ making an angle
 $\omega _0$ at the moving wall and
 $\theta _e$ is the microscopic contact angle in the inner region as per Cox (Reference Cox1986). (b) The dynamic meniscus in the GLM framework with
 $\alpha (s)$ being the local angle along the curved interface,
 $s$ is the arc length measured from the contact line,
 $h(x)$ is the position of the interface measured from the moving plate.

An alternative approach to obtain the full interface shape was proposed by Snoeijer and coworkers. This is a simple and direct approach involving the generalized lubrication equations used in free-surface flows even for problems with large interface slopes (Snoeijer Reference Snoeijer2006; Chan et al. Reference Chan, Srivastava, Marchand, Andreotti, Biferale, Toschi and Snoeijer2013, Reference Chan, Kamal, Snoeijer, Sprittles and Eggers2020). This is achieved by expanding the Stokes equations about flow in a wedge with a constant wedge angle (Huh & Scriven Reference Huh and Scriven1971), perturbed around  $Ca\ll 1$, i.e. variations of the interface slope are assumed to be slow. The model is described in terms of two coupled differential equations for the interface shape,
 $h(s)$, and local interface angle,
 $\alpha (s)$, as shown schematically in figure 7(b), and given by
 \begin{gather} {\frac{{\rm d}^2\alpha}{{\rm d}s^2}} = \frac{3 Ca}{h(h+cl_s)} f(\alpha,\lambda) - \frac{1}{l_c^2}\cos(\alpha), \end{gather}
 \begin{gather}{\frac{{\rm d}h}{{\rm d}s}} = \sin(\alpha), \end{gather}
where  $s$ is the arc length along the interface and
 $c$ is a constant chosen to match with the slip region. For small contact angles (
 $\theta _e\ll 1$) and free-surface flows (
 $\lambda =0$), one can take
 $c=3$ (Chan et al. Reference Chan, Kamal, Snoeijer, Sprittles and Eggers2020). In the limit of
 $\lambda =0$, the function
 $f(\alpha,\lambda )$ is given by
 \begin{equation} f(\alpha,0)={-}\frac{2\sin^3(\alpha)}{3(\alpha-\sin(\alpha)\cos(\alpha))}. \end{equation}
Integrating (3.25) and using  $Ca\ll 1$, Snoeijer (Reference Snoeijer2006) showed that the structure of (3.20) can be recovered. In contrast to the method of matched asymptotics involving matching solutions from distinct regions (Cox Reference Cox1986; Dussan V. et al. Reference Dussan V., Ramé and Garoff1991), the generalized lubrication model (GLM) in (3.25) gives a full description of the interfacial profile in a more convenient way. For the present experiments, the GLM equations are solved using the following boundary conditions on the moving plate and the far field:
 \begin{equation} \alpha(s=0)=\theta_e;\quad \alpha(s\to\infty)=\frac{\rm \pi}{2}, \quad h(s=0)=0. \end{equation}
Detailed comparisons of the interface shape from the above two models with experiments are discussed in § 4.1.
4. Results
The results are broadly divided into three parts. First, in § 4.1 we extract the interface shape from experiments and compare it against theoretical models. Second, in § 4.2 we extract flow fields from the experiments and compare them against the modulated wedge flow solutions described in § 3.1.2. Finally, the velocity at the interface is compared against theoretical models in § 4.3.
4.1. Interface shape
Interface shape has a direct bearing on the flow on either side of it; therefore, it is necessary to investigate models for interface shapes carefully, as is done below.
For the DRG model (refer to § 3.2 for more details), we require knowledge of interface shape in the outer static region. For the present problem of a flat plate vertically advancing into a liquid bath, the interface shape can be written analytically in terms of the local interface angle,  $\theta _s(r)$, where the subscript
 $s$ refers to the static solution. The static shape, written in parametric form, is given by
 \begin{equation} {\theta_s(r)} = \frac{\rm \pi}{2} - \tan^{{-}1}\left(\frac{{\rm d}h_s}{{\rm d}{\kern0.9pt}x}\right), \end{equation}
where  $x$ and
 $h_s$ are the vertical and horizontal coordinates of the static interface with the origin at the contact line as shown in figure 7(a) such that
 $x \in [0,x_0]$. An analytical solution for the full nonlinear Young–Laplace equation is readily available and can be written as
 \begin{equation} h_s(x) = l_c \left[\cosh^{{-}1}\left(\frac{2l_c}{x_0-x}\right) - \cosh^{{-}1}\left(\frac{2l_c}{x_0}\right)\right] \!-\! \left(4 l_c^2 - (x_0-x)^2\right)^{1/2} \!+\! \left(4l_c^2-x_0^2\right)^{1/2}, \end{equation}
where
 \begin{equation} x_0 = \sqrt{2}l_c \left(1-\sin\omega_0\right)^{1/2}. \end{equation}
Instead of prescribing the static contact angle at  $x=0$, we set the angle to be
 $\omega _0$, an empirical parameter whose value is determined by iteratively minimizing the root-mean-square error between the interface shape predicted by the DRG model, (3.24), and the experimental interface shape. The outcome of this procedure is shown in figure 8 where the static (outer) solution (4.1), the Cox (intermediate) solution (3.23) and the DRG solution are compared against experimental data. The composite DRG solution follows the Cox model near the contact line and the static solution in the outer region. The deviation of the Cox model, especially near the contact line occurs due to the viscous effects near the wall. This deviation in Cox's model occurs to the second term in (3.23), which is not evident in the experiments. The DRG model closely follows the experiments except near the contact line, clearly due to the influence of Cox's model in the inner region. The static solution, even when parameterized by the angle
 $\omega _0$, does not follow the experiments near the contact line. This deviation of the static solution with experiments can be referred to as viscous deformation. Note that viscous deformation is distinct from viscous bending. In the case shown in figure 8, the viscous deformation is close to
 $1000\,\mathrm {\mu }{\rm m}$, which is clearly comparable to the length scale of the outer solution. Such large viscous deformations are consistent with similar values reported by Ramé & Garoff (Reference Ramé and Garoff1996).
Comparison of interface shape obtained in the experiments against the DRG solution, Cox's intermediate solution and the static (outer) solution. This solution corresponds to the interface between air and 500 cSt silicone oil with  $Re=2.61 \times 10^{-3}$ and
 $Ca = 2.79\times 10^{-2}$. Here
 $\omega _0$ is obtained by fitting the DRG model to experiments and is approximately
 $78.8^{\circ }$.

Figure 9 shows a comparison of the DRG model with the experimental interface shapes for 500 cSt, 100 cSt and 10 cSt silicone oils. At low  $Ca$, as is the case with 10 cSt oil, the agreement between the DRG model and experiment is very good. The agreement becomes less favourable at higher
 $Ca$ due to the pronounced deviation in the solution of Cox that directly effects the DRG solution. The extent of this deviation in interface shape predicted by Cox's theory appears to range from a few microns at low
 $Ca$ and increases to about
 $400\,\mathrm {\mu }{\rm m}$ for 500 cSt oil. The variation of fitting parameter
 $\omega _0$ in each of the cases shown in figure 9 can also be predicted using the model equation (3.21). For small to moderate angles, the function
 $g(\theta ) \approx \theta ^3/9$. This simplifies (3.21) to the form
 \begin{equation} \omega_0^{3} \approx \theta_e^3 + 9 Ca\ln\left(l_c/l_s\right). \end{equation}
The equilibrium angle  $\theta _e$ is the static advancing angle given in table 2. For small equilibrium angles, i.e.
 $\theta _e \ll 1$, the above expression further simplifies to
 \begin{equation} \omega_0^3 \sim 9Ca\ln\left(l_c/l_s\right). \end{equation}
If  $l_c$ and
 $l_s$ are nearly constant, as is the case in the present study for silicone oils of different viscosities, (4.5) predicts that
 $\omega _0$ has a
 $Ca^{1/3}$ dependence on the capillary number. Figure 10 displays the relationship between
 $\omega _0$ and
 $Ca$, consistent with the scaling in (4.5).
Comparison of interface shapes from the experiments with DRG model for four different cases. ( $\triangledown$, blue) 500 cSt silicone oil with
 $Ca=2.79\times 10^{-2}$,
 $\omega _0 \approx 78.8^{\circ }$; (
 $\boldsymbol {\times }$, cyan) 500 cSt silicon oil with
 $Ca=1.4\times 10^{-2}$,
 $\omega _0 \approx 60.9^{\circ }$; (
 ${\ast }$, maroon) 100 cSt silicone oil with
 $Ca=2.26\times 10^{-3}$,
 $\omega _0 \approx 36.5^{\circ }$; (
 $\boldsymbol {\bigcirc }$, red) 10 cSt silicone oil with
 $Ca=6.77\times 10^{-5}$,
 $\omega _0 \approx 22^{\circ }$.

Variation of  $\omega _0$ with capillary number
 $Ca$ obtained from DRG model from experiments involving fluids with viscosity ranging from 100 cSt to 500 cSt.

A more direct approach to obtain the interface shapes is to use the recently developed GLM model given by (3.25). The only unknown parameter in this model is the slip length,  $l_s$, which can be determined by matching the interface shape from the model against experimental data. The equilibrium contact angle,
 $\theta _e$, is taken to be equal to the static advancing angle,
 $\theta _{sa}$, obtained from direct measurements and given in table 2. Figure 11 shows a comparison of interface shapes between experiments and GLM predictions for three different slip lengths, 2.8, 14 and 56 nm. In most cases, a slip length of 14 nm fits the experimental data with reasonable accuracy. A constant slip length, which does not vary with capillary number, suggests that the slip length is a fundamental property of the fluid–solid combination. This is consistent with several other studies that measured slip length and found the values in the nanometre range and also independent of the applied strain rate, as discussed in the work of Joseph & Tabeling (Reference Joseph and Tabeling2005).
Comparison of experimental interfacial shapes (symbols) with GLM predictions (curves) using three different values for the slip length: ( $\triangledown$, blue) 500 cSt silicone oil with
 $Ca=2.79\times 10^{-2}$; (
 $\boldsymbol {\times }$, cyan) 500 cSt silicon oil with
 $Ca=1.4\times 10^{-2}$; (
 ${\ast }$, maroon) 100 cSt silicone oil with
 $Ca=2.26\times 10^{-3}$; (
 $\boldsymbol {\bigcirc }$, red) 10 cSt silicone oil with
 $Ca=6.77\times 10^{-5}$. The GLM predictions with
 $l_s=2.8$ nm (dashed),
 $l_s=14$ nm (solid),
 $l_s=56$ nm (dash dot). The inset shows viscous bending predicted by GLM near the contact line with
 $l_s=14$ nm.

It is important to note that even though the GLM is developed within the limitation of small opening angle variations (Snoeijer Reference Snoeijer2006), it efficiently captures the strong viscous bending effect near the contact line, thereby predicting the variation from  $\theta _e$ to
 $\theta _d$ (experimentally observed at tens of microns). The GLM performs well for most cases except for very low capillary number experiments. At very low
 $Ca$, viscous effects are confined to a very small region near the wall and the static shape largely governs the whole interface shape (as shown by the DRG model in figure 9). Since the static shape (due to capillarity) is not included in the development of GLM (which relies purely on viscous deformation), it performs better when viscous effects become important, as in the case of 500 cSt oil.
4.2. A comparison of streamfunction with the MWS
A key result of this paper is to obtain flow fields in the vicinity of a moving contact line and compare them against existing theories. As discussed in § 3.1, a direct comparison of experimental flow field data cannot be performed with the fixed wedge theory of HS71, and hence, the MWS proposed by Chen et al. (Reference Chen, Ramé and Garoff1997) is adopted in the present study. The effect of the viscosity ratio was neglected in formulating the MWS since all experiments were conducted only in the limit of  $\lambda \ll 1$. We have checked to ensure that ignoring the viscosity ratio in the theory has minimal effect on the values of the streamfunction. However, in general, the effect of the viscosity ratio and speed of the plate directly affects the interface shape,
 $\beta (r)$, which in turn modifies the flow fields.
The interface shape from experiments, either in terms of  $\alpha (r)$ or
 $\beta (r)$, is directly used to determine the streamfunction in the bulk using (3.7) as discussed in § 3.1.2. The velocity data from PIV experiments are present on a Cartesian grid. Mass conservation requires that the difference in the streamfunction between any two neighbouring nodes on the grid is equal to the mass flux across a face connecting the nodes. Fixing the streamfunction value along the moving plate to be zero, we determine the value of the streamfunction at all the interior nodes on the experimental velocity grid. This allows a direct comparison of the streamfunction contours against theoretical predictions. The code developed for post-processing the velocity field was tested against several test velocity fields where the analytical form of the streamfunction was known. Since the resolution of the PIV data was high, i.e. the grid size was very small, the code was found to be highly accurate. It has to be noted that there are no arbitrary fitting parameters in the code. Hence, the present technique offers both a qualitative and a quantitative comparison of streamfunction contours between experiments and theory.
For perfect agreement between experiments and theory, we expect both the contour shapes as well as contour values to agree, and this forms a very stringent test of the theory. As discussed earlier, the theory makes predictions for the streamfunction in the bulk flow despite suffering from a stress singularity at the moving contact line. On the other hand, in the experiments, it is necessary to ensure that there is no disturbance to the flow field from external disturbances. This allows the ‘local’ nature of the flow near a moving contact line to leave its signature even at macroscopic scales. To achieve this, utmost care was taken to ensure that remnants of the flow currents caused due to initial mixing of the seeding particles dissipated substantially before the experiments were conducted. The background disturbance, quantified in terms of norm of the velocity, i.e.  $\|{\boldsymbol {v}}\| = \sqrt {u^2+v^2}$, at each point in the domain, was measured before the start of the experiments and was ensured to be much smaller than the plate speed,
 $U_{plate}$. Even at the lowest speeds in our experiments, the typical value of norm of the background velocity at every point in the domain was less than 0.1 of the plate speed.
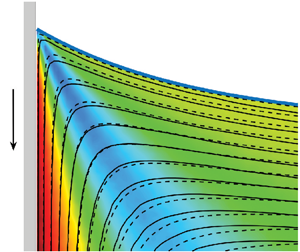
Figure 12 shows contours of the streamfunction from experiments (solid curves) and the MWS (dashed curves) for four different silicone oils, 500 cSt, 100 cSt, 20 cSt and 10 cSt, respectively. The corresponding contour levels are shown for both experiments and theory and are found to be in remarkable agreement with each other, especially in the vicinity of the contact line. Flow fields are shown in a region of  $2\,{\rm mm} \times 2\,{\rm mm}$ that is comparable to the capillary length, the scale of the outer region in Cox's model. In the highly viscous experiments, i.e. experiments involving 500 cSt and 100 cSt oils shown in figure 12(a,b), excellent agreement is found between experiments and theory over the entire region of interest, whereas with 20 cSt and 10 cSt oils shown in figure 12(c,d), the agreement deteriorates as one approach the outer length scale. This suggests that the length scale of the ‘intermediate region’ of Cox (same as the MWS) reduces as viscosity is reduced. This is consistent with the fact that the extent of the ‘intermediate’ region in Cox's model is larger when viscous effects become dominant. At these viscosity ratios, the theory predicts that the flow is of ‘rolling’ type, i.e. the fluid particles at the interface advect towards the moving contact line. Below the interface, fluid particles are dragged towards the plate and undergo a sharp turn near the corner of the wedge and then turn downwards near the plate. In the experiments, it was found that the rolling pattern of the flow persisted at length scales much larger than the outer length scale, the capillary length.
Contours of the streamfunction obtained from experiments and viscous theory. The grey rectangle represents the solid plate moving downwards and the blue solid curve represents the interface between air and silicone oil. Experimental streamfunction contours (black solid curves) are derived using mass balance considerations from the velocity vector field using PIV experiments and the theoretical predictions (red dashed curves) are obtained from viscous theory incorporating the effect of a curved interface. The interface (blue solid curve) was fit with a two-term exponential function given by (2.1) and the fit values are reported below. (a) Silicone 500 cSt at  $Re = 1.3\times 10^{-3}$ and
 $Ca = 1.4\times 10^{-2}$, fit parameters:
 $c_1=-0.7, c_2 = 0.01, c_3 = 0.7, c_4 = -0.81$. (b) Silicone 100 cSt at
 $Re = 7.7\times 10^{-3}$ and
 $Ca = 2.41\times 10^{-3}$, fit parameters:
 $c_1=-1.09, c_2 = 0.04, c_3 = 1.07, c_4 = -1.08$. (c) Silicone 20 cSt at
 $Re = 1.15\times 10^{-2}$ and
 $Ca = 1.36\times 10^{-4}$, fit parameters:
 $c_1=-1.41, c_2 = -0.01, c_3 = 1.42, c_4 = -0.78$. (d) Silicone 10 cSt at
 $Re = 0.023$ and
 $Ca = 6.77\times 10^{-5}$, fit parameters:
 $c_1=-1.42, c_2 = -0.02, c_3 = 0.10, c_4 = -1.67$. The non-dimensional form of the same figure is included in the supplementary material.

To further test the difference between theory and experiments, the contour of  $|\psi - \psi _{MWS}|$ is shown in figure 13. This case corresponds to the result presented in figure 12(a). Excellent agreement is found between experiments and theory except at large radial distances away from the contact line. This deviation is understandable since HS71's theory, on which the MWS is based, is a local theory and is only valid at distances much smaller than the ‘outer’ length scale of the problem.
Comparison between experimentally obtained streamfunction contours and theoretical predictions shown in terms of the magnitude of the difference in streamfunction values,  $|\psi - \psi _{MWS}|$. The data correspond to figure 12(a). The interface is shown with a solid blue curve.

The results in figure 12 only form a small sample, but all the experiments corresponding to the parameter points shown in figure 2 at different values of  $Re$ and
 $Ca$ yielded similar results. To the best of our knowledge, these experiments form the first such comparison in the literature where flow in the bulk was directly compared with theory. Earlier studies were largely limited to comparing the interface shapes and/or interfacial velocities.
4.3. Interfacial speed
Another key result from the present study is the measurement of interfacial speed. The interfacial speed is obtained by taking the projection of the experimental velocity field obtained from PIV onto the interface, where the interface is a curve that cuts the Cartesian grid containing PIV data. Convergence studies were conducted to test various interpolation schemes. Tangential velocity was also determined along curves parallel to the interface and convergence was obtained when these parallel curves approached the interface from below.
Figure 14 shows the variation of interfacial speed along the interface using 500 cSt silicone oil at four different speeds. Interfacial speed is plotted along the radial coordinate of the interface by fixing the origin at the contact line. The data are compared with the theoretical predictions of interfacial speed from HS71 theory and the MWS given by (3.6) and (3.14), respectively. A negative value indicates that the motion is towards the moving contact line. Huh & Scriven's (Reference Huh and Scriven1971) theory predicts that the interface speed is constant, shown by dotted lines in figure 14(a), and our experiments show fair agreement with this prediction away from the contact line, i.e. at a distance greater than  $300\,\mathrm {\mu }{\rm m}$. A consistent but small deviation is observed between HS71 predictions and experiments, which is easily accounted for by noting that the interface is curved. Without any additional fitting parameters, the MWS prediction (shown by solid curves) is able to capture the slight increase in speed.
(a) Variation of the tangential speed  $\upsilon _t$ along the curved interface where
 $r$ is measured from the contact line. The tangential speed
 $\upsilon _t$ is non-dimensional, i.e. the speed is normalized by the plate speed
 $U$. A negative value indicates the fluid particles at the interface are moving towards the contact line consistent with the rolling motion observed in streamfunction contours. The speeds are extracted at different
 $Ca$ for 500 cSt silicone oil: (
 $\boldsymbol {\bigcirc }$, red)
 $Re = 2.61 \times 10^{-3}$,
 $Ca = 2.79 \times 10^{-2}$,
 $\phi = 73.7^{\circ }$; (
 $\boldsymbol {\times }$, violet)
 $Re = 1.31 \times 10^{-3}$,
 $Ca = 1.40 \times 10^{-2}$,
 $\phi = 60.0^{\circ }$; (
 $\triangledown$, maroon)
 $Re = 3.92 \times 10^{-4}$,
 $Ca = 4.19 \times 10^{-3}$,
 $\phi = 42.6^{\circ }$; (
 $\boldsymbol {\square }$, black)
 $Re = 2.62 \times 10^{-4}$,
 $Ca = 2.79 \times 10^{-3}$,
 $\phi = 41.5^{\circ }$. Interfacial speeds from experiments (different markers) are compared with the HS71 predictions (horizontal dotted lines) and MWS theory (solid curves). The inset shows that MSW theory predicts the interfacial speed away from the contact line. (b) Close-up view of the interfacial speed near the contact line. The interface speed is non-monotonic with a slight increase at a distance of approximately
 $150\, \mathrm {\mu }{\rm m}$ followed by a rapid reduction in speed as the contact line is approached.

At distances much closer to the contact line, typically at distances of a few hundred microns, there is a rapid deviation of the interfacial speed from classical viscous theories, as shown in figure 14(b). It has to be noted that the prediction of interfacial velocity in the classical theory of HS71 is identical to the velocity in the intermediate region of more sophisticated theories (see figure 6 of Cox Reference Cox1986 and figure 2 of Shikhmurzaev Reference Shikhmurzaev1997). These sophisticated theories resolve the singularity at the contact line by introducing addition physics in the ‘inner’ region. One manifestation of the singularity in HS71's theory can be seen from the constant speed of approach of the fluid particles along the interface towards the contact line. This is in contrast to experiments where the interface speed rapidly decreases to nearly zero as the contact line is approached. In summary, the experiments reveal that HS71's theory is valid, but only beyond a certain distance from the contact line consistent with the observation made by Snoeijer & Andreotti (Reference Snoeijer and Andreotti2013).
5. Summary and discussions
In this study the velocity field in the vicinity of a moving contact line is determined experimentally and compared against well-known theoretical models. The nature of the flow field crucially depends on the static and dynamic contact angles, viscosity ratio and capillary number. All these parameters are systematically varied in the current study and compared with predictions of theoretical models, though viscosity ratio did not appear to play a very large role due to the small value of  $\lambda$ in our experiments. Experiments are performed by vertically immersing a plate into a liquid bath at controlled speeds. Moving contact line studies can also be carried out in a number of other configurations. However, the reason behind choosing the above-mentioned configuration was to ensure that we have precise control over the speed of the contact line as well as the dynamic contact angle. Furthermore, the two-dimensional nature of the flow in the middle of the plate allowed accurate measurement of the flow field using PIV techniques. Another important reason for choosing this configuration was to ensure that the ‘local’ nature of the flow near the moving contact line is not affected by confinement effects, which are likely to be present in the flow fields inside drops or capillary tubes. Since care was taken to ensure that no extraneous flows were present before the start of the experiment, we believe that the local flow generated due to a moving contact line can be observed at considerably larger length scales than in other flow configurations. This also allows for accurate measurement of flow fields using conventional PIV techniques. The variation of dynamic contact angle with the capillary number, shown in figure 5, was found to be in excellent agreement with the classical work of Hoffman (Reference Hoffman1975), which also suggests that results are configuration/geometry independent. Therefore, the obtained flow fields should be similar to flow near a moving contact line in other flow geometries.
The results are grouped into three distinct categories based on the nature of the theoretical models. In § 4.1, interface shapes are compared against the DRG model of Dussan V. et al. (Reference Dussan V., Ramé and Garoff1991) and the GLM of Chan et al. (Reference Chan, Kamal, Snoeijer, Sprittles and Eggers2020). In § 4.2, flow fields from the experiments are compared against the MWS that in turn is based on the classical work of HS71. In § 4.3, interfacial speeds are compared against predictions from HS71's theory and the MWS.
All the experiments in this study involve silicone oils of varying viscosities. Since surface tension and density are nearly constant in these fluids, the capillary length, which is used as a measure of the scale of the ‘outer’ region, is the same across all experiments. The Reynolds number varied from  $O(10^{-4})$ to
 $O(1)$ and the capillary number ranged from
 $O(10^{-5})$ to
 $O(10^{-2})$.
The low  $Re$ and
 $Ca$ in all the experiments allow us to test various types of theoretical models. The DRG model was found to be capable of determining the interface shape over a wide range of length scales except in a narrow region near the contact line where viscous bending from the inner solution causes deviation of the interface shape. At the lowest
 $Ca$ values, the agreement between the DRG model and experiments was found to be nearly perfect over the entire range of spatial measurement. A test of the more recent model based on the generalization of lubrication theory for high interface slopes yielded satisfactory results. Since the value of slip length is not known, we fitted this model for a range of slip lengths. A slip length of 14 nm was found to give the best results for all the cases. The value of this slip length is consistent with published values of slip length reported in the literature. In the case of the DRG model, the static interface shape has a large influence on the overall shape of the full dynamic interface. This is especially evident when viscous effects become small such as in the 10 cSt oil experiments. However in the case of GLM, the static interface shape is not explicitly used in the model, but the model mainly relies on viscous effects to deform the dynamic interface. It is therefore not surprising that GLM best agrees with experiments in viscous-dominated cases such as when using 500 cSt oil. A similar effect of viscosity is also observed when comparing flow fields from experiments with theory.
An ambitious test of theoretical models can be made by directly comparing the predicted velocity field in the bulk against experiments. We test this by directly comparing the streamfunction values between experiments and the MWS, shown in figure 12. Excellent agreement is found for both the shape of the streamlines and the values of the streamfunction. The prediction from the MWS is found to be within 6  $\%$ deviation from the experiment, as shown in figure 13. It is worth reiterating that the HS71 or the MWS are identical to the leading-order solution in the intermediate region of Cox (Reference Cox1986); hence, a test of HS71 is equivalent to a direct test of the intermediate solution of Cox's model. Understandably, the agreement between theory and experiment deteriorates as one moves away from the contact line since the theoretical model of HS71 is only a local theory valid in the vicinity of the contact line. In the present study the MWS model required inputs of the local interface angle,
 $\beta (r)$, from experiments. We suggest that it is possible to predict flow fields at all length scales without any inputs from experiments, but this requires determining
 $\beta (r)$ from the generalized lubrication theory of Chan et al. (Reference Chan, Kamal, Snoeijer, Sprittles and Eggers2020).
One of the most interesting findings of the present study is the measurement of the interfacial velocity. Since the fluid particles approach the contact line, the interfacial velocity is negative. Away from the contact line, the interfacial velocity is largely similar to that predicted by HS71's theory. This is similar to what was also observed by Fuentes & Cerro (Reference Fuentes and Cerro2005), but their measurements were at much larger length scales than the present experiments. There is a small deviation in the experiments from the value predicted by HS71's theory. This deviation can be easily accounted for by recognizing that the interface is curved. The inset of figure 14(a) shows that accounting for the curvature of the interface in the MWS increases the velocity marginally and is in excellent agreement with experiments. Recall that in HS71's theory, the interfacial velocity is independent of the radial location from the contact line. This means that fluid particles just below the interface approach the contact line at a constant speed and are required to make an instantaneous turn at the contact line, and subsequently move along the plate. These fluid particles will be required to possess an infinite acceleration as  $r \rightarrow 0$. This is yet another manifestation of HS71's singularity. Contrary to theoretical predictions, what we find in the experiments is that the interfacial velocity rapidly decreases to very small values as one approaches the contact line. This rapid reduction in speed to a near-zero velocity is non-monotonic. There is a small increase in the speed at a distance of approximately
 $150\,\mathrm {\mu }{\rm m}$ from the contact line and then a rapid decrease to a very small speed as shown in figure 14(a,b). The singularity is thus prevented by allowing the fluid to approach the contact line at smaller speeds, shown schematically in figure 15. These fluid particles are then expected to slip along the moving plate, but then soon adjust to the no-slip condition along the surface of the plate. To the best of our knowledge, such a behaviour of fluid particles near the contact line has not been reported in experiments before, and is completely consistent with the maxim that ‘nature abhors singularities’.
Typical flow pattern observed in all experiments showing rolling motion in the bulk fluid (black dashed curves) consistent with figure 12. Fluid particles at the interface rapidly slow down as the contact line is approached consistent with figure 14, before eventually turning down to move along the plate.

We hope that these experimental findings will spur new theoretical developments by incorporating necessary physics in the inner and intermediate regions. Furthermore, quantitative data about interface shape and flow fields in the viscous phase is available for download as supplementary material and we hope new computational models will be validated against the PIV data provided in this paper.
Supplementary material
Supplementary material is available at https://doi.org/10.1017/jfm.2024.486.
Acknowledgements
We thank the anonymous referees whose critical comments and suggestions significantly improved the clarity of the paper. The authors would also like to dedicate this paper to the memory of Professor George (Bud) Homsy.
Funding
We wish to acknowledge the support of the Science and Engineering Research Board (SERB), Dept. of Science and Technology, India, for funding this research through grant no. CRG/2021/007096.
Declaration of interests
The authors report no conflict of interest.
Data availability statement
The data that support the findings of this study are openly available on the Corresponding Author's website at https://people.iith.ac.in/hdixit/MCL_Silicone_oil_Supplementary.html. See JFM's research transparency policy for more information.
Author contributions
H.N.D. conceptualized and supervised the research. A.C. performed the initial experiments and contributed to the analysis of interface shape. C.G. performed most of the experiments in this study and analysed the data with help from LDC and HND. C.G., L.D.C. and H.N.D. wrote the paper.



