1. Introduction
State-owned enterprises (SOEs), which control a substantial portion of the Chinese economy—especially in key sectors, are crucial for understanding macroeconomic dynamics. However, their role has been largely overlooked in the macroeconomic literature, with a few seminal exceptions (Zhu, Reference Zhu2012; Chang et al., Reference Chang, Chen, Waggoner and Zha2015; Hsieh and Song, Reference Hsieh and Song2015). Our paper demonstrates that the large share of government-controlled firms is a key channel for the transmission of fiscal policy shocks.Footnote 1
SOEs operate with fundamentally different goals than private companies in China. Given how much of the economy they represent, these differences matter for understanding the country’s macroeconomic trajectory. We see this in several well-documented patterns: SOEs tend to have lower overall productivity, which researchers like Bai et al. (Reference Bai, Li, Tao and Wang2000) and Bai et al. (Reference Bai, Lu and Tao2006) link to their role in maintaining employment stability. Their investment behavior also sets them apart—Chen et al. (Reference Chen, Sun, Tang and Wu2011) show they follow different investment patterns, while Yu (Reference Yu2014) demonstrates how their investment choices reflect government strategy rather than market signals.
Despite the extensive literature on Chinese SOEs, their macroeconomic role and interaction with conventional policy levers have only recently garnered significant attention. For instance, Fang et al. (Reference Fang, Hu, Shi and Zhang2023) consider SOE activity as an alternative tool for achieving traditional fiscal objectives, though their analysis focuses primarily on SOEs with limited consideration of standard fiscal policy. Min et al. (Reference Min, Wen and Wang2022) evaluate the effect of spending shocks on private, state-controlled, and foreign investment within a small-scale, recursively identified VAR . Meanwhile, Chen et al. (Reference Chen, Gao, Higgins, Waggoner and Zha2023) examine the impact of monetary policy on loans to both private and SOE firms, incorporating government spending into their identification strategy. Liu and Zhang (Reference Liu and Zhang2020) show that economic policy uncertainty significantly curbs investment among private firms but leaves SOE investment largely unaffected. Zhang et al. (Reference Zhang, Lu and Tang2021) find that expansionary monetary policy surprises stimulate investment more strongly in non-SOEs than in SOEs.
Against this backdrop of growing attention to policy-SOE interactions, the distinct nature of China’s fiscal policy warrants further investigation. The Chinese government has historically approached expansionary fiscal policy with caution, constrained by concerns over public debt. It has a preferred monetary policy to manage short-run fluctuations. Its first significant use of debt-financed expansionary fiscal policy occurred in the late 1990s. Academic research on the effectiveness of Chinese fiscal policies reports mixed findings. For instance, while Wang et al. (Reference Wang, Zhang and Yue2015) argue that government spending crowds out private investment, Xu and Yan (Reference Xu and Yan2014) distinguish between public and private good investment by the government, finding crowd-in and crowd-out effects, respectively. Further complexities are highlighted by Ding et al. (Reference Ding, Jiang, Li and Wei2024), who link fiscal volatility to capital misallocation, and Chen and Liu (Reference Chen and Liu2018), who find that both government consumption and investment shocks can appreciate the real exchange rate and create twin deficits. The policy’s cyclical behavior has also evolved, with Fuest and Xing (Reference Fuest and Xing2015) noting a shift from pro-cyclical local spending in the 1980s to a countercyclical stance after the 1990s, following the significant fiscal reform in 1994. Li and Luo (Reference Li and Luo2022) examine the coordination of fiscal and monetary policy in China and show that accommodative monetary policy reinforced the effects of expansionary fiscal policy.
In our paper, we follow a two-step approach to demonstrate the crucial role the SOEs play in fiscal policy transmission. In this approach, as it has, for example, been used in Chen et al. (Reference Chen, Ren and Zha2018) and the previously mentioned work by Chen et al. (Reference Chen, Gao, Higgins, Waggoner and Zha2023), shocks are identified in a macro model in a first step, and then those shocks are used to estimate local projections-based impulse response functions (IRFs) using microlevel panel data in a second step.
In the first part of this paper, we separately consider SOE and non-SOE investment in a Bayesian SVAR using the identification method introduced by Baumeister and Hamilton (Reference Baumeister and Hamilton2019) and modified to account for some special characteristics of the Chinese economy.Footnote 2 Thus, unlike some other papers using similar two-step approaches, our shock identification is part of a complete macroeconomicFootnote 3 model that includes all of our variables of interest. This allows us to identify fiscal policy shocks and assess their transmission through the economy and between the different sectors of the economy. In particular, we can estimate the response of SOE and non-SOE investment to fiscal policy at the aggregate level.
In the second part of the paper, we confirm our findings using firm-level data to estimate local projections in the spirit of Jordà (Reference Jordà2005) based on the SVAR shocks identified in the first step. These data also allow us to delve deeper into some related questions. First, we examine the appropriate definition of an SOE. There has been an ongoing debate about how precise official designations are, and our dataset allows us to compare SOE designation to SOE definitions based on actual ownership data. Second, we assess how the results differ across subsectors of the economy that the Chinese government has explicitly stated its desire to control; i.e., we look at SOE effects within the “strategic” and “pillar” industries defined as such by the central government. Thus, while the firm-level data do not allow inference on aggregate or average effects of fiscal policy shocks (as this would require omitting time-fixed effects in the panel model, risking substantial bias and underestimating standard errors), it allows a much more detailed assessment of the differences between SOEs and non-SOEs.
Our paper is most closely related to the recent work of Chen et al. (Reference Chen, Gao, Higgins, Waggoner and Zha2023), who—like us—use a two-step framework consisting of a full-fledged macro-model and a panel framework to examine the effect of those shocks at the microlevel. Our work differs in two fundamental respects. First, while the main issues for Chen et al. (Reference Chen, Gao, Higgins, Waggoner and Zha2023) are monetary policy and infrastructure investment and they thus model fiscal policy in a simplified manner (focusing on spending), our macro-model is primarily a fiscal model, where monetary policy is mostly considered to improve identification. Second, Chen et al. (Reference Chen, Gao, Higgins, Waggoner and Zha2023) look at the effect on loans, i.e., the first step of monetary transmission, whereas we analyze the investment, i.e., actual demand generation, as one of the final objectives of fiscal stimulus.
The remainder of the paper is structured as follows. In Section 2, we outline our structural VAR and the panel model that we employ to examine our firm-level data. Section 3 presents our data sources and descriptive statistics and discusses potential caveats of the data we use. The results are presented in Section 4, Section 5 presents a robustness check in which we augment our baseline VAR model with additional variables, and Section 6 concludes.
2. Model and method
2.1 Shock identification and evidence from aggregate data
We identify fiscal policy shocks based on a medium-scale Bayesian SVAR. The identification strategy is inspired by recent work by Baumeister and Hamilton (Reference Baumeister and Hamilton2015), Baumeister and Hamilton (Reference Baumeister and Hamilton2018), and Baumeister and Hamilton (Reference Baumeister and Hamilton2019). It consolidates all known knowledge about the elasticities and IRFs of the model, including their signs and boundaries.
One of the main reasons for going for a VAR-based identification is that many of the other workhorse models used for identifying fiscal shocks require data that is not readily available for the case of China. Especially for the US, there is a large body of literature using military spending, which is believed not to respond to business cycle fluctuations automatically (Burnside et al., Reference Burnside, Eichenbaum and Fisher2004; Hall, Reference Hall2009; Barro and Redlick, Reference Barro and Redlick2011). Others rely on detailed analysis of the institutional setup to identify specific exogenous events (Blanchard and Perotti, Reference Blanchard and Perotti2002) or construct narrative indicators (Romer and Romer, Reference Romer and Romer2010; Ramey, Reference Ramey2011).
Unlike in other VAR literature, where especially the early literature was dominated by (block) recursive identification schemes, the literature on fiscal policy largely uses more theory-based structural restrictions (for a summary, see Ramey (Reference Ramey2016)). The two dominant approaches are zero restrictions on the (semi-)elasticities of the structural equations (see, e.g., Blanchard and Perotti, Reference Blanchard and Perotti2002) and sign restrictions on the impulse response (see, e.g., Mountford and Uhlig, Reference Mountford and Uhlig2009). In more technical terms, given a VAR model of the form
 $A Y_{t}=B X_{t-1}+\epsilon _{t}$
(where
 $Y$
is the vector of variables of interest), this corresponds to restrictions on
 $A$
(elasticities) or
 $A^{-1}$
(sign restrictions). Baumeister and Hamilton (Reference Baumeister and Hamilton2019) point out two key problems in the most commonly used restrictions. First, for frequentist SVARs imposing restrictions on
 $A$
, in Bayesian terms, this corresponds to extremely strong prior beliefs on some elements, but completely uninformative priors for others, possibly causing implausible results. Second, they argue that SVARs imposing supposedly uninformative priors for sign restrictions (i.e., only the sign of the response itself is enforced), implicitly impose highly informative and often implausible priors on the elasticities without acknowledging it. Therefore, sign restrictions on IRFs can generate posterior distributions for elasticities that are not consistent with empirical facts.
Since Bayesian SVARs with the type of restrictions and priors we are looking to implement are computationally fairly intensive, we opt for the smallest scale VAR that is feasible to answer our question. Besides government revenue and expenditure and the two investment aggregates we are interested in (non-SOE and SOE investment), we only include real GDP and money. GDP is the main macroeconomic aggregate and a crucial driver of both government spending and revenue. We include money to account for the special Chinese case, where monetary and fiscal policy are highly coordinated. For example, in the aftermath of the Asian financial crisis, the inflation rate became negative during 1998–2000. The monetary policy continued being tough, aiming at imposing hard budget constraints on SOEs, and the fiscal spending was increased at the same time, which stimulated the economy. Therefore, to avoid misinterpreting monetary policy shocks as fiscal, we need to identify a monetary policy shock. As shown by Chen et al. (Reference Chen, Ren and Zha2018), despite China slowly shifting to interest rate-based policies, the quantity of money remains the best measure of policy for our sample.
The VAR thus takes the form
 \begin{equation} AY_{t}=B X_{t-1}+\epsilon _{t}, \end{equation}
where
 $Y$
is a vector of GDP (
 $y$
), government revenue (
 $\tau$
), government spending (
 $g$
), money (
 $m$
), SOE investment (
 $is$
), and non-SOE investment (
 $ip$
), all in log differences, and except M2 all in real per capita terms. We have
 $X_{t-1}'=(y_{t-1}',y_{t-2}'\ldots .,y_{t-m}',1)$
. The elasticities are collected in
 $A$
and the parameters guiding the model dynamics in
 $B$
.
 $\epsilon _{t}$
is the vector of i.i.d. structural shocks where
 $\epsilon _{t}\sim N(0,D)$
, and
 $D$
is a diagonal matrix. The ordering of variables does not affect our identification strategy and is based solely on the relevance of the indicators to ensure a clear and intuitive presentation of the results.
We identify shocks through a combination of zero restrictions on
 $A$
and informative priors on the remaining elasticities and
 $A^{-1}$
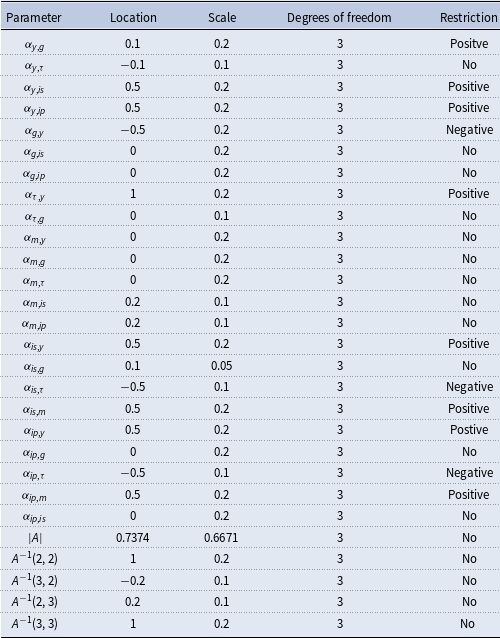
, i.e., the initial impulse response. While we impose some binding sign restrictions on the elasticities, we have highly informative priors but no binding restrictions regarding the key signs of the impulse response. Following Baumeister and Hamilton (Reference Baumeister and Hamilton2019), we use a t-distribution with three degrees of freedom for the priors of elements in A. If the elasticity has a restriction to be positive or negative, the distribution is truncated accordingly.
The two key equations we are interested in are a fiscal policy rule, which links the budget deficit to the economy, and a revenue equation primarily describing the automatic stabilizer. Those are hit by two shocks, a stimulus shock, which is an unexpected increase in the deficit that might contemporaneously also affect the revenue negatively (i.e., the stimulus might be given through tax credit rather than debt finance spending), and a government size shock, which is an increase in revenue and spending, i.e., a shock on revenue that does not affect the deficit. We model those through informative priors on the sign of the (contemporaneous) impulse response. There is no perfect matching of the more commonly used spending and revenue shocks on the one hand and stimulus and government size shocks on the other hand because our shocks do not affect revenue or taxes exclusively.Footnote 4 There is some similarity to debt-financed and tax-financed spending shocks (which are computed as a linear combination of pure spending and revenue shocks) as discussed in Caldara and Kamps (Reference Caldara and Kamps2008). However, contrary to their approach, our stimulus shocks might be driven by tax cuts or credits rather than increased spending.
This yields a fiscal policy rule:
 \begin{equation} g_t - \tau _t = \alpha _{g,y} y_t + \alpha _{g,is} is_t + \alpha _{g,ip} ip_t + \varepsilon _{gt}, \end{equation}
where
 $\alpha _{g,y}$
is expected to be negative (i.e., the deficit increases in a recession) either due to increasing spending or tax cuts, and the prior densities for
 $\alpha _{g,is}$
and
 $\alpha _{g,ip}$
are centered around
 $0$
, since ex-ante we expect fiscal policy to respond to the overall business cycles (which is measured through
 $y$
) rather than its components.
We use the tax equation to model automatic stabilizers, i.e., the endogenous response of tax revenue to GDP fluctuations (without deliberate changes in policy). The equation thus takes the form:
 \begin{equation} \tau _t = \alpha _{\tau ,y} y_t + \alpha _{\tau ,g} g_t + \alpha _{\tau ,is} is_t+\alpha _{\tau ,ip} ip_t+\varepsilon _{\tau t}, \end{equation}
where we expect the automatic stabilizer
 $\alpha _{\tau ,y}$
to be positive as (tax) revenue increases in income. While most of our informative priors regarding elasticities are quantitatively small, there has been some evidence that this automatic stabilizer is relatively large. For the case of the US, Blanchard and Perotti (Reference Blanchard and Perotti2002) estimate the size of the automatic stabilizer to be 1.85, while Caldara and Kamps (Reference Caldara and Kamps2017) show that the implied value for the automatic stabilizer is 3.2 with the Mountford and Uhlig (Reference Mountford and Uhlig2009) method. On the other end of the scale, Perotti (Reference Perotti2004) summarizes the estimated value of
 $\alpha _{\tau ,y}$
for West Germany, the UK, and Austria to be less than 1. Since progressive taxes (i.e., mostly income tax) that contribute to high automatic stabilizer play a relatively small role in China compared to profit and value-added taxes (VAT), we set the location parameter of the prior for
 $\alpha _{\tau ,y}$
to
 $1$
with a scale parameter of 0.2, implying a 92% prior probability that
 $\alpha _{\tau ,y}$
falls in the range from
 $0.5$
to
 $1.5$
.
We assume that revenue increases in income in general and by and large independent of the individual contributions of different demand components. To get a clearer identification, we therefore restrict both investment coefficients in this equation to
 $0$
. As for the government expenditure elasticity on tax
 $\alpha _{t,g}$
, Blanchard and Perotti (Reference Blanchard and Perotti2002) argue that decisions on tax policy are usually made after that for government expenditure, so
 $\alpha _{t,g}\neq 0$
. Even though this might not be the case for China, we do not impose 0 restriction on
 $\alpha _{t,g}$
. Instead, we specify a prior with a location parameter of 0 for this elasticity.
Note that neither equation includes
 $m_{t}$
, reflecting that we believe the correlation of monetary policy and fiscal policy to be driven by the government rather than the central bank. i.e., we treat monetary policy as being affected by the fiscal policy rather than the other way around. The money equation itself does not include any zero restrictions. Note that money generation is a combination of monetary policy and endogenous money creation. We thus adopt a prior with a modestly positive location parameter for the investment elasticities(
 $\alpha _{m,is}$
and
 $\alpha _{m,ip}$
), as the investment is largely credit financed, which implies money creation. The location parameter for the prior of the income elasticity (
 $\alpha _{m,y}$
) is
 $0$
. While not negative, this still implies that monetary policy counteracts fluctuations in the business cycle, as the increase in money demand due to increasing income is not accommodated by a corresponding increase in liquidity. Our identification strategy interprets China’s policy coordination as fiscal-led. This is achieved by allowing monetary policy to respond contemporaneously to fiscal variables (government spending, g, and taxes,
 $\tau$
), while excluding monetary factors from the structural equations of g and
 $\tau$
. Consequently, any monetary support for fiscal actions—captured by the inclusion of fiscal variables in the monetary policy reaction function—is considered an integral part of the fiscal policy package. A monetary policy shock is thus strictly defined as the component of monetary policy that is uncorrelated with both fiscal policies and common policy objectives.
Regarding investment, we aim to avoid binding restrictions, since we do not want to force the variables we are most interested in. The one restriction we do impose is that we assume that SOE investment does not respond to private investment but vice versa. While private investment decisions might take SOE investment as a signal and respond quickly, it seems unlikely that SOEs respond to private investment within a quarter. Not only does SOE planning require more time, but their objective function is also quite different, and thus their decisions respond largely to government needs (as reflected by
 $m$
,
 $g$
, and
 $\tau$
), and demand (as reflected by
 $y$
). Since we do not know in advance whether the SOE investment has leading or crowding out effects on non-SOE investment, we will not impose any sign restrictions (or informative priors on the sign) of
 $\alpha _{ip,is}$
.
The priors for the response of both investment variables to income and money are positive (i.e., we impose
 $\alpha _{is,m}\gt 0$
,
 $\alpha _{ip,m}\gt 0$
,
 $\alpha _{is,y}\gt 0$
, and
 $\alpha _{ip,y}\gt 0$
), as we believe both increasing demand and expansionary monetary policy ought to push investment. We assume both to respond negatively to increasing taxes (i.e., we impose
 $\alpha _{is,\tau }\lt 0$
and
 $\alpha _{ip,\tau }\lt 0$
). Regarding the impact of government spending, our prior distribution implies a
 $93\%$
probability that
 $\alpha _{is,g}$
is positive as the government can leverage SOEs to increase demand. However, we remain agnostic regarding the value of the effect of spending on private investment (
 $\alpha _{ip,g}$
), as both crowding out or the demand effect might dominate in the short run.
For the GDP equation, we have positive priors on the effects of all GDP components (i.e., SOE investment, private investment, and government spending
 $\alpha _{y,g}\gt 0$
,
 $\alpha _{y,is}\gt 0$
, and
 $\alpha _{y,ip}\gt 0$
). The positive effect of investment is undisputed in the literature. There is some debate on the effects of government spending, but models that look at the actual spending (such as VAR models) rather than policy decisions typically find a positive short-term effect (Ramey, Reference Ramey2011). We use a negative prior but no binding sign restriction on the impact for government revenue
 $\alpha _{y,\tau }$
. We only use a mildly negative prior (with a location parameter of
 $-0.1$
and a scale parameter of
 $0.1$
), implying a roughly 20% probability of a positive sign, to account for the fact that output typically only responds sluggishly to tax changes.
The matrix
 $A$
thus takes the form:
 \begin{equation*} A= \left[\begin{array}{c@{\quad}c@{\quad}c@{\quad}c@{\quad}c@{\quad}c} 1 & -\alpha _{y,g} & -\alpha _{y,\tau } & 0 & -\alpha _{y,is} & -\alpha _{y,ip}\\ -\alpha _{g,y} & 1 &-1& 0& -\alpha _{g,is} & -\alpha _{g,ip} \\ -\alpha _{\tau ,y} & -\alpha _{\tau ,g}& 1 &0 & 0 & 0\\ -\alpha _{m,y} & -\alpha _{m,g} & -\alpha _{m,\tau } & 1 &-\alpha _{m,is} &-\alpha _{m,ip}\\ -\alpha _{is,y} & -\alpha _{is,g} & -\alpha _{is,\tau } & -\alpha _{is,m} &1 & 0\\ -\alpha _{ip,y} & -\alpha _{ip,g} & -\alpha _{ip,\tau } & -\alpha _{ip,m} &-\alpha _{ip,is} & 1 \end{array}\right] \end{equation*}
It is important to distinguish our identifying assumptions from traditional sign or zero restrictions. The latter are typically applied to the IRFs (
 $A^{-1}$
), while most of our restrictions are placed on the structural matrix A itself. A key illustration is the parameter
 $a_{\tau ,m}=0$
, which imposes a zero restriction on the direct contemporaneous effect of money on tax revenue through the structural equation for
 $\tau$
. However, our model’s structure implies a positive overall prior through indirect channels: monetary policy affects investment, which drives GDP (y), and thereby increases tax revenue. The existence and sign of these indirect contemporaneous links are grounded in established theoretical and empirical work.
Nevertheless, to achieve precise identification of fiscal shocks, we do impose a minimal set of restrictions directly on the impulse responses. Under a stimulus shock, which results in an increase in the deficit, government expenditure increases while the tax decreases. Government expenditure and tax both increase on the impact of a government size shock. Instead of imposing strict sign restrictions on IRFs, we set priors for the IRFs, with the majority of the cumulative density in the range of the intended sign. For example, we set the priors of the contemporaneous effect of tax revenue to a stimulus shock (
 $A^{-1}(3,2)$
) as Student’s t-distribution with a location parameter of
 $-0.2$
and a scale parameter of
 $0.1$
, which means that this impulse response of taxes has a prior of 93% probability to be negative. We still allow a positive impulse response of tax on the impact of a stimulus shock, but with a rather small probability. This practice resembles the merits of BH methods, which not only incorporate the uncertainty caused by the limited sample size but also those caused by our limited knowledge about the correct restrictions. Finally, we impose a positive sign on the determinant of
 $A$
with a probability of 95%, following Baumeister and Hamilton (Reference Baumeister and Hamilton2019).Footnote
5
Table 1 summarizes the details for all prior distributions of all elasticities and the elements of the
 $A^{-1}$
where we impose informative priors. In the case of China, there is barely any evidence of those elasticities in the literature. We therefore use relatively conservative numbers and put the largest cumulative density of the prior distributions between -1 and 1 for most elasticities except for the automatic stabilizer
 $\alpha _{\tau ,y}$
.Footnote
6
Prior distribution

Our identification strategy, consistent with Bayesian sign-restriction approaches, yields set identification. Although incorporating more restrictive priors would narrow the confidence sets, we intentionally adopt an agnostic framework to prevent the identifying assumptions from dictating the results. The ensuing analysis demonstrates that this limited set of assumptions is sufficient to generate economically meaningful and plausible impulse responses. A key finding is that the long-run effects of a government size shock on revenue and spending are statistically indistinguishable, even though no long-run restrictions were imposed. This result increases our confidence that the model correctly identifies government size shocks separately from short-term stimulus shocks.
2.2 Microdata-based local projections
In the second part of the paper, we use the annualized shocks identified from our SVARFootnote
7
in a local projections framework to assess their impact on different firms using an unbalanced firm-level panel from 1998 to 2007 covering
 $80,000$
to
 $260,000$
observations per year, yielding a total of slightly less than 1.4 million observations after we clean the data.Footnote
8
As we are interested in the different impacts of policy shocks on different types of firms, our key parameter of interest is the interaction of the ownership structure and fiscal policy shocks.
Different arguments have been made regarding the most appropriate definition of an SOE; see Section 3.2 for more details. The emerging consensus seems to be to look at the actual ownership structure rather than using official designations. We follow this argument for our baseline specification and define SOEs based on the state share of the firm’s capital. Rather than selecting a specific threshold for government ownership that defines whether a company is considered state-owned, we borrow from the literature on structural break testing and estimate our model for a range of thresholds. Since many SOEs are fairly large, we control for the interaction of firm size in terms of log total assets (
 $size$
) and the fiscal policy shock variable. Instead of using a battery of firm-specific controls, we manage unobserved heterogeneity using fixed effects (in addition to firm size and state share to avoid biased estimation of the interaction term). This approach yields the following model:
 \begin{equation} \begin{split} inv_{i,t+h} = & \beta ^{(h)}_{1} {\unicode{x1D7D9}}_{s_{i,t}\geq \tau } \times shock_t + \beta ^{(h)}_{2} size_{i,t} \times shock_t\\ & + \beta ^{(h)}_{3} size_{i,t} + \beta ^{(h)}_{4} s_{i,t} + u^{(h)}_i + v^{(h)}_t + \varepsilon ^{(h)}_{i,t}, \end{split} \end{equation}
where
 $inv$
is the log difference of real fixed assets;
 $s$
is the state share;
 $t$
and
 $i$
are time and firm indices, respectively;
 $u$
,
 $v$
, and
 $\varepsilon$
are the components of the compound error term; and
 $h$
is the forecast horizon. The shock indicator can be either the stimulus shock or the government size shock identified from the SVAR. Since the firm-level data are annual, whereas the shock data are quarterly, we use the sum of shocks over the year to compute an annual shock.
 $\tau$
is the threshold that determines the definition of an SOE. We use conditions ranging from
 $s\gt 0$
over
 $s\geq 0.1$
,
 $s\geq 0.2$
, etc., to
 $s=1$
. The model is run for forecast horizons 0 (i.e., on impact) to 2 (i.e., two years ahead).
Additionally, rather than dividing our sample into SOE versus non-SOE samples, we use a continuous measure, namely, the share of government ownership itself, yielding the following:
 \begin{equation} \begin{split} inv_{i,t+h} = &\beta ^{(h)}_{1} s_{i,t} \times shock_t + \beta ^{(h)}_{2} size_{i,t} \times shock_t + \beta ^{(h)}_{3} size_{i,t} \\ & + \beta ^{(h)}_{4} s_{i,t} + u^{(h)}_i + v^{(h)}_t + \varepsilon ^{(h)}_{i,t} \end{split} \end{equation}
Finally, as a robustness check, we include the official SOE designations (described in more detail in the Data section) instead of the threshold-based dummy in Equation 4.
3. Data
3.1 Macrodata
Except for the series for government revenue, all of our time series are taken from the Federal Reserve Bank of Atlanta’s China’s Macroeconomy: Time Series Data (CMTS data) based on Chang et al. (Reference Chang, Chen, Waggoner and Zha2015). Government spending is computed as the sum of government consumption and government investment (gross fixed capital formation) following Mountford and Uhlig (Reference Mountford and Uhlig2009). We exclude transfer payments, which would move procyclically. Government revenue (or more precisely, tax revenue) is taken from the CEIC database.
The CMTS data contain disaggregated fixed capital formation data, allowing us to observe the heterogeneous effects of policies on the investment of SOEs and non-SOEs. The original data distinguish five categories of investment: government, household, SOE, private, and other non-SOE investments. For our non-SOE sector, we include both private (enterprises) and (other) non-SOE data following the terminology of Chang et al. (Reference Chang, Chen, Waggoner and Zha2015). SOE investment is taken from the dataset as given; i.e., we do not consider government investment to be part of SOE investment.Footnote 9
All of the data are at a quarterly frequency. The CMTS data come with seasonal adjustments. Chinese tax revenue data are reported in a way that reflects the actual economic activity in the corresponding quarter rather than merely being driven by the fiscal year. We seasonally adjust the government revenue data by means of X13.
The GDP, investment, and fiscal policy series are in real per capita form adjusted by their corresponding price indices (the GDP deflator and price index for fixed capital formation) and the total population of China. We use the log difference for all data series.
Our data are limited by the availability of SOE investment data, which are currently reported only for the quarters until the end of 2017. We begin our sample after the major reforms of the tax system in the mid-1990s, most notably the reform of 1994, which aimed at increasing the central government’s control over tax revenue, and the 1995 amendment to the tax collection law, which mainly regulated the issuance of Fapiao, certificates for the tax payments. We therefore start our sample from 1996, yielding a sample period of 1996Q1 to 2017Q4.
3.2 Firm-level data
The firm-level data are from the Chinese industrial enterprise database provided by the National Bureau of Statistics of China. The dataset includes balance sheet data for all SOEs and private enterprises above the nationally designated scale for 1998 to 2007.Footnote
10
Since investment is not reported in the database, we compute it based on fixed assets and depreciation and normalize it by lagged fixed assets, yielding
 $(k_t-k_{t-1}+d_t)/k_{t-1}$
, where
 $k$
denotes fixed assets and
 $d$
is current depreciation. As we cannot compute the growth rate for the first year of our observations, our local projections are based on a sample starting in 1999. The data were collected until 2014. However, data quality deteriorated for the period after 2007, with the number of firms sampled declining and key variables missing for several waves of the survey. For this reason, we focus on the data for the period up to 2007, i.e., the global financial crisis.
Two official designations for SOEs are used in the database. First, there is an indicator for registration as a SOE (henceforth referred to as the SOE registration dummy). Second, there is an indicator for the firm’s ownership, which shows the fractions of capital controlled by central or local governments or government-owned entities, such as other SOEs (henceforth called the state control dummy). However, Hsieh and Song (Reference Hsieh and Song2015) have found that almost half of state-owned firms in this database take the legal form of—and are correspondingly registered as—private enterprises in 2007. Thus, as mentioned in the Model section, our baseline results focus on the state share, i.e., the ratio of state capital over total capital.
After removing outliers, firms with missing industry data, and implausible characteristics (such as a negative state share or a state share above
 $100\%$
), we are left with more than 1.3 million observations.
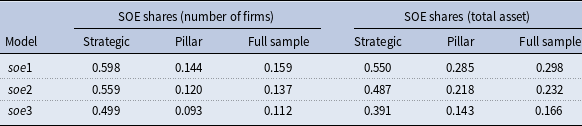
Table 2 summarizes the share of SOEs in the firm-level data using different definitions of state ownership. For the full sample, about
 $16\%$
of firms are partially owned by the government, and
 $11\%$
are fully owned by the government. However, since SOE firms are relatively large, those shares represent
 $30\%$
and
 $17\%$
, respectively, of total assets. Interestingly, for the 5% of observations under mixed ownership (i.e., that belong to the 16% with at least partial state ownership but not the 11% with full state ownership), the state share is characterized by a relatively uniform distribution, encompassing everything from small investments to majority participation and near-complete government ownership.
Shares of SOEs

Note: SOE1: state capital
 $\gt 0$
; SOE2: state capital
 $\geq 0.5$
; SOE3: state capital
 $=1$
.
The Chinese government has identified certain industries—labeled as strategic and pillar industries—as key areas of interest. Strategic industries are relevant for national security or future industrial development, such as gas, oil, and electricity-related industries.Footnote 11 Pillar industries contribute strongly to Chinese GDP and are deemed essential for economic prosperity, such as the manufacturing of chemicals, machinery, and equipment, as well as metal mining and processing.
SOEs are the dominant force in strategic industries, with fully state-owned firms constituting 50% by number but only 40% by total assets. This counterintuitively indicates that the largest strategic firms are primarily private. The prevalence of natural monopolies in this category may explain why smaller, government-run firms persist. Interestingly, the share of SOEs in pillar industries aligns with the full-sample average, implying that direct ownership is not the government’s primary tool for influencing this sector.
SVAR identified shocks.

4. Results
4.1 VAR evidence
Shocks: Figure 1 shows the first four shocks identified by our VAR system.Footnote 12 The first panel presents the business cycle shock and shows relatively large positive shocks for the last two quarters of 1998, 2004, and 2007, and negative shocks for the first two quarters of 1999, the last two quarters of 2003, the first two quarters of 2009 and 2015–2016. The years 1996–1999 involved intensive reforms of SOEsFootnote 13 and the Asian financial crisis, both of which brought extra volatility to the Chinese economy. Unlike Western economies (in particular the US and the Euro Area), we do not observe a massive negative shock in late 2007/early 2008 in response to the financial crisis starting with the bursting of the US housing bubble. Rather, we see a sequence of minor negative shocks as the global collapse of trade slowly affected the Chinese economy. What the model identifies as negative shocks toward the end of the sample period might reflect China’s macroeconomy entering a new era often dubbed the “new normal” by economists and characterized by a slower but more sustainable growth rate.Footnote 14 Interestingly, the business cycle shock became less volatile after 2008. Neither the global financial crisis nor the big fiscal stimulus led to large shocks to the growth of output.
The fiscal shocks are shown in the lower two panels. Unsurprisingly, the most visible event is the 4 trillion stimulus plan implemented by the Chinese government beginning in the last quarter of 2008 to combat the global financial crisis.Footnote 15 The stimulus packages were supported by a considerable liquidity injection into the economy. Chen et al. (Reference Chen, Gao, Higgins, Waggoner and Zha2023) document that the State Council and PBC both issued decrees guiding banks to increase lending in 2008 and 2009, respectively. As shown in panel 2, there was a surge in M2 growth in 2009, which dwarfed all the surprise expansions in M2 in our sample period.
Our sample also covers another fiscal expansionary period (see, e.g., Lin, Reference Lin2011, for a history of fiscal policy in China), namely, the response to the Asian flu starting in July 1997. In late 1997, when the crisis peaked in the Southeast Asian countries where it originated, we observed a moderately sized stimulus shock. The response to the Asian Financial Crisis is largely considered the first time that China used fiscal policy (fiscal deficit) in addition to monetary policy to stabilize the business cycle (Lin, Reference Lin2011). China initially tried to finance the increased spending largely through revenue. The fiscal expansion during the following quarters until the end of 1998 is thus identified as a government size shock, rather than a stimulus shock. However, as documented by Cheng (Reference Cheng1999), the government launched an unprecedented 100-billion-RMB fiscal stimulus in August 1998. This debt-financed program, aimed at infrastructure construction, was the first of its kind in China. There are two dips for both shocks in 2005 and 2016, respectively. Both occurred during a period of tax reduction, indicating that government spending experienced even greater reductions in these two years. We find both a positive stimulus shock and a positive government size shock for 2017, implying increased government spending, which is partially financed by the deficit. Overall, the stimulus shock has been quite small in our sample period, which echoes the fact that the Chinese government has been holding the 3% deficit rate very tightly.
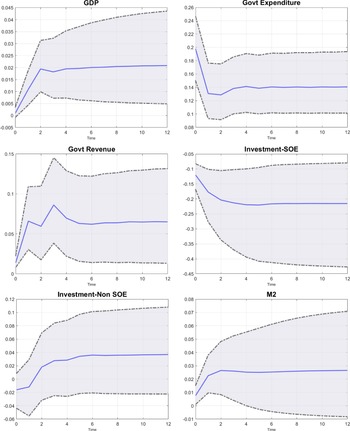
Impulse responses: Before discussing the key contribution of our paper, i.e., the distinction between SOE and non-SOE investment, we briefly discuss our findings with regard to the remaining variables of the model. Figures 2 and 3 present the cumulative IRFs corresponding to the two fiscal shocks. All the IRFs are presented with 68% confidence intervals.
The responses are largely as expected. The responses of government expenditure are positive for both shocks, while the responses of tax are negative for a stimulus shock and positive for a government size shock. In this model specification, the stimulus shock is tax-cut-led, as the immediate reduction in taxes is larger and more significant than the concurrent increase in government expenditure. The effect of stimulus shock on both spending and revenue is extremely short-lived. Given that stimulus shocks essentially represent attempts at countercyclical policy (e.g., one-time investment projects to boost demand or temporary tax credits), this is economically plausible. Contrarily, the effects on both spending and revenue for government size shocks are highly persistent, as we would (for example) expect a change in tax rates to finance new (permanent) government programs.
We find that the response of GDP to a deficit-increasing stimulus shock is statistically insignificant and quantitatively small. In contrast, GDP responds positively and significantly to a government size shock.Footnote
16
Caldara and Kamps (Reference Caldara and Kamps2008) show that GDP responds positively to a balanced-budget spending increase, which is analogous to the government size shock, with Blanchard and Perotti (Reference Blanchard and Perotti2002) identification but negatively with Mountford and Uhlig (Reference Mountford and Uhlig2009) identification. The key difference is that
 $\alpha _{\tau ,y}$
is smaller when using an identification scheme following Blanchard and Perotti (Reference Blanchard and Perotti2002). The prior of
 $\alpha _{\tau ,y}$
in our paper is closer to the value used in Blanchard and Perotti (Reference Blanchard and Perotti2002). As a result, we find a significant positive GDP response as Blanchard and Perotti (Reference Blanchard and Perotti2002). A similar conclusion holds for the stimulus shock, which is analogous to the deficit-financed tax cut identified by Caldara and Kamps (Reference Caldara and Kamps2008). The stimulus shock coincides with a significant monetary expansion that begins contemporaneously, a finding consistent with the high degree of fiscal-monetary coordination in China. In contrast, a government size shock also induces monetary expansion, but the effect is considerably smaller in magnitude and gradually dissipates over the following four quarters.
Response to a government size shock.

Response to a stimulus shock.

Investment difference between SOEs and non-SOEs (VAR results).

SOEs versus non-SOEs: The investment of SOEs and non-SOEs in response to fiscal policy shocks, in particular to stimulus shocks, varies. Figure 4 presents a direct account of the differences between the investment of these two types of firms, while the individual IRFs are shown in Figures 2 and 3.
Both types of firms exhibit a positive investment response to stimulus shocks.Footnote 17 This suggests no evidence of crowding out. The effects are more significant, more persistent, and larger in magnitude for SOEs, while the positive effects are rather small and become insignificant in 3 quarters for the private sector. This pattern likely reflects coordinated policy support, where monetary easing facilitates access to credit and thus amplifies the impact of fiscal stimulus—especially for SOEs. In effect, fiscal expansion is accommodated by monetary policy. The effect on M2 is more persistent than the effect on the budget deficit, consistent with the observed tendency in China and elsewhere: monetary expansions often persist, whereas tax cuts and similar fiscal measures are frequently one-off interventions.Footnote 18
In response to a government size shock, the investment of SOEs responds negatively, while the response of investment of non-SOEs is insignificant. There are different possible explanations for this behavior. First, the government might actively aim to compensate for crowding out through monetary stimulus. There is a significant increase in money supply in response to a government size shock, indicating improved loan conditions. Second, increasing the size of the government sector might include actively moving activity from SOEs to direct government activity, which would be in line with increasing taxes and revenues and decreasing the size of the SOE sector (as indicated by its investment dynamics).
Figure 4 plots the difference in investment responses between SOEs and non-SOEs (defined as SOE investment minus non-SOE investment). The results confirm our prior interpretation of the individual IRFs: SOE investment decreases relative to private investment following a government size shock but increases in response to a stimulus shock. This investment difference is both persistent and statistically significant under both types of shocks. The posterior mean of the tax elasticity for SOE investment is -10.9 under this specification, substantially larger in absolute value than that for non-SOEs, which helps explain the divergent investment patterns. The strong response of SOEs to stimulus shock likely stems from this elevated tax sensitivity, possibly reinforced by preferential credit policies (see Herrala and Jia, Reference Herrala and Jia2015).
4.2 Firm-level evidence
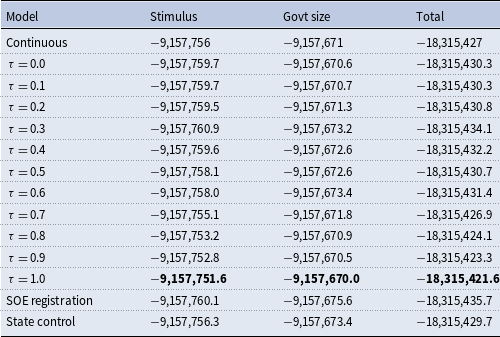
Identifying SOEs: We find that the model in which we define SOEs as companies with complete state ownership (i.e., where the state share is valued at one) fits the data best; see Table 3 for a comparison of likelihoods. This threshold outperforms not only other thresholds but also the continuous definition (i.e., the state share itself) and different official SOE designations. This result implies that the government does not treat firms where it holds stocks—not even a controlling majority of stocks—as state-owned in regard to policy implementation.Footnote 19 Given the widespread debate on so-called Chinese state capitalism, this is a highly interesting finding. While on its own, it is not sufficient to disprove the idea of increasing government control, it is definitely at odds with the hypothesis of an overly intrusive government.
Log likelihoods of different models

Note: Joint likelihood over horizons 0 to 4 for different SOE definitions. Maximum log likelihood values are highlighted in bold.
Microlevel evidence.

Impulse responses: Our results qualitatively confirm the preliminary findings of the VAR analysis, though a direct quantitative comparison is precluded by differences in the investment measures. Reassuringly, as shown in the right column of Figure 5, the results are robust across all our models, exhibiting strong qualitative and quantitative similarity despite variations in the precise measure of SOE investment. This robustness implies that widespread critiques of official SOE designations—which have led many researchers to avoid them—may be overstated. While some mislabeling likely exists, our analysis suggests that it is not pervasive enough to distort the core results. Supporting this view, we find that only 20% of firms with a government share above 0.5 are not registered as SOEs, a figure lower than often presumed. This indicates that the primary data issue may lie less in misleading registrations and more in the capital stock data, which we have rigorously cleaned for inconsistencies.
The micro-data evidence largely confirms the VAR results: SOE investment rises relative to non-SOE investment following a stimulus shock but falls when government size increases. However, the micro-data reveal a crucial dynamic lost in the aggregate analysis. The relative investment advantage of SOEs in response to a stimulus shock (tax-cut-led) reverts after approximately one year. This suggests that while SOEs invest more immediately—possibly to support domestic demand or due to easier credit access—this lead is compensated at longer horizons. Consequently, the micro evidence indicates that the key difference lies not in the overall level of investment, but in its timing: SOE investment reacts more promptly, thereby supporting the countercyclical intent of fiscal stimulus in a way that macro data alone cannot discern.
We find substantial heterogeneity across industry groups. The results for SOEs in pillar industries largely mirror the full-sample results, both qualitatively and in terms of overall dynamics. In contrast, the findings for the strategic industry—officially under complete government control—differ considerably (Figure 5, left column). Given the state’s complete control over this sector, one would expect the effect of firm ownership to vanish. Surprisingly, we not only find significant state-ownership effects, but these effects are distinctly different. In the full sample, the relative impact of a tax-cut-led stimulus shock on investment eventually reverses sign; in the strategic industry, however, the effect of state ownership is strictly positive and highly persistent.
A similar divergence appears for government size shocks. While the full-sample effect is negative—suggesting SOEs decrease investment relative to non-SOEs, possibly to mitigate crowding out—the difference is positive in the strategic sector. This is consistent with the view that an expansion in government size involves a heightened focus on sectors deemed essential for long-term development. The persistently positive investment gap for SOEs in this sector indicates strong, sustained government support, irrespective of whether the fiscal expansion is a short-term stimulus or a permanent increase in government size.
5. Robustness test: 7-variable VAR
To test the robustness of our baseline results, we augment the VAR system with three additional macroeconomic variables: household consumption expenditure, the consumer price index (CPI) for inflation, and the log ratio of exports to imports to proxy net exports. Consumption and inflation data are sourced from the CMTS data, while the trade ratio is obtained from the Federal Reserve Economic Data (FRED).
To isolate the effect of each new variable, we augment the baseline VAR sequentially. This means we will estimate three separate robustness-check models, each adding one of the new variables—consumption, inflation, or the trade ratio—to the original system. Consequently, each of these models will be a 7-variable VAR, expanding the A matrix from a
 $6 \times 6$
to a
 $7 \times 7$
dimension. The following section discusses the prior settings for the new parameters introduced in each of these specifications.
5.1 Consumption
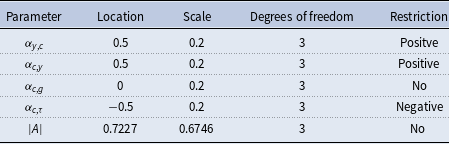
The inclusion of consumption expands the VAR system by adding a new equation for consumption and introducing a term for the contemporaneous consumption into each of the original six equations. Our identification assumes that consumption does not affect government expenditure, tax revenue, M2, or investment directly within the period; any contemporaneous effect on these variables is transmitted indirectly through the impact of consumption on GDP, which responds to consumption through the national accounting identity. Since our data are in log difference, the parameter
 $\alpha _{y,c}$
represents the elasticity of output with respect to consumption. Given that China’s consumption share has been extraordinarily low—averaging around 40% during our sample period—a value well below 1 is theoretically grounded. Consequently, we impose a prior on
 $\alpha _{y,c}$
as a positively truncated Student’s t—distribution with a location parameter of 0.5 and a scale parameter of 0.2. This prior places a 95% probability on an elasticity below 1, consistent with the observed consumption share.
For the consumption equation:
 \begin{equation} c_{t}=\alpha _{c,y}y_{t}+\alpha _{c,g}g_{t}+\alpha _{c,\tau }\tau _{t}+\alpha _{c,m}m_{t}+\alpha _{c,Is}Is_{t}+\alpha _{c,Ip}Ip_{t}+\varepsilon _{ct} \end{equation}
Mirroring our earlier identification strategy, we assume that investment and monetary shocks do not affect consumption directly within the period, but only indirectly through their impact on GDP. This is formalized by setting the parameters
 $\alpha _{c,Is} = \alpha _{c,Ip} = \alpha _{c,m} = 0$
. For the response of consumption to income, standard theory with a constant marginal propensity to consume suggests a unitary elasticity (
 $\alpha _{c,y} = 1$
). However, empirical evidence consistently shows that consumption responds positively, though less than proportionally, to income shocks in the short run. We therefore center the prior for
 $\alpha _{c,y}$
at 0.5. Finally, while direct income taxes are low in China, the high share of VAT in total revenue means the tax system still significantly discourages consumption. To reflect this, we set the prior for
 $\alpha _{c,\tau }$
with a location parameter of −0.5.
The effect of government spending on consumption remains a contested issue in the literature. Theoretically, predictions are divided: Real Business Cycle models typically forecast a decline in consumption due to a negative wealth effect, whereas New Keynesian models often predict an increase. Empirical studies employing SVAR analyses generally report positive effects (see, e.g., Fatas and Mihov, Reference Fatas and Mihov2001; Blanchard and Perotti, Reference Blanchard and Perotti2002; Caldara and Kamps, Reference Caldara and Kamps2008; Ravn et al., Reference Ravn, Schmitt-Grohé and Uribe2012), while those using narrative approaches, such as the Ramey-Shapiro dummy method, often find negative effects (Perotti, Reference Perotti2008). It is crucial to note that these documented effects are derived from IRFs and do not represent a structural elasticity. Given the absence of a clear consensus, we impose no sign restriction on the contemporaneous elasticity parameter
 $\alpha _{c,g}$
. We instead adopt an agnostic prior, specifying a symmetric Student’s t-distribution with a location parameter of 0 and a scale parameter of 0.2. This places a 98.5% probability on the elasticity falling within the range [−1, 1]. Complete prior specifications are detailed in Table 4.
7-variable SVAR with consumption: Prior distribution

7-variable SVAR with consumption: Investment difference between SOEs and non-SOEs.

Figures 6 and 7 present the IRFs. The statistical significance at the macro level is reduced. It seems that the cost of increased model complexity and fewer degrees of freedom outweighs the informational benefit of including more variables. This pattern holds across all three robustness checks. However, the median investment difference is still negative for government size shocks and positive for stimulus shocks. The microlevel results remain significant and consistent with the macro direction. These findings match our earlier results from the six-variable model. Two notable differences emerge in the microlevel responses to the stimulus shock. First, the investment difference remains persistently positive without any sign of reversal. Second, SOE investment in the strategic sector falls below that of non-SOEs, marking a stark contrast with the baseline results. It is noteworthy that in this specification, the stimulus shock is driven more by government spending than by tax reductions (Appendix Figure 13). This implies that government support for strategic SOEs appears to rely more on tax relief mechanisms than on direct spending, whereas SOEs in other sectors benefit more from expenditure-based stimulus. The leading role of SOEs, indicated by a sign reversal in the investment difference, is most evident in tax-cut-led stimulus. This pattern is robust across all 7-variable VAR specifications.
7-variable SVAR with consumption: Microlevel evidence.

5.2 Inflation
For an additional robustness test, we augment the model by including an inflation equation, specified as:
 \begin{equation} \pi _{t}=\alpha _{\pi ,y}y_{t}+\alpha _{\pi ,g}g_{t}+\alpha _{\pi ,\tau }\tau _{t}+\alpha _{\pi ,m}m_{t}+\alpha _{\pi ,Is}Is_{t}+\alpha _{\pi ,Ip}Ip_{t}+\varepsilon _{\pi t} \end{equation}
and correspondingly add
 $\pi$
to the original six equations.
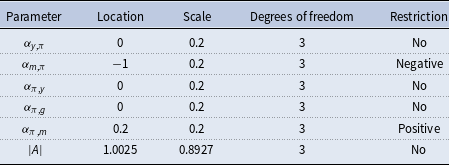
Although our analysis does not focus on price movements per se, we include inflation for two key methodological reasons. First, given the central role of prices in the macroeconomic transmission of shocks, their inclusion can reduce uncertainty in the reduced-form VAR, thereby sharpening the estimates of our structural model. Second, and more critically, modeling inflation is essential for the identification of monetary policy shocks, which in turn helps to isolate fiscal policy shocks more clearly.
We specify the money equation as a policy reaction function, reflecting the importance of money supply in the PBoC’s framework. Consequently, we restrict the parameter for the policy response to inflation
 $\alpha _{m,\pi }$
to be negative. Conversely, we impose a positive restriction on
 $\alpha _{\pi ,m}$
, reflecting the standard assumption that an expansion in the money supply exerts upward pressure on prices.
Beyond its role in the monetary policy reaction function, we remain largely agnostic regarding the interactions between prices and other variables. Specifically, we impose no sign restrictions on
 $\alpha _{\pi ,y}$
or
 $\alpha _{y,\pi }$
thereby avoiding a forced interpretation of the output and inflation equations in terms of demand or supply shocks. Similarly, we do not restrict the response of inflation to government spending. The literature offers no clear consensus on this relationship: while some studies find expansionary fiscal policy to be inflationary (Caldara and Kamps, Reference Caldara and Kamps2008; Ferrara et al., Reference Ferrara, Metelli, Natoli and Siena2021), others find deflationary effects (Mountford and Uhlig, Reference Mountford and Uhlig2009). Perotti (Reference Perotti2004) reports small effects of government spending on inflation. Furthermore, Jørgensen and Ravn (Reference Jørgensen and Ravn2022) note a discrepancy where standard New Keynesian models predict a positive effect that is not consistently borne out empirically. Given this lack of a consistent theoretical or empirical consensus, we specify a symmetric prior centered around zero for
 $\alpha _{\pi ,g}$
. The details of these prior settings are provided in Table 5.
7-variable SVAR with inflation: Prior distribution

7-variable SVAR with inflation: Investment difference between SOEs and non-SOEs.

The IRF results in Figure 8 show that the significance level of macro-level investment difference responses is reduced, but the direction of response matches the findings in the 6-variable system. Moreover, the macro and micro results (Figures 8 and 9) remain qualitatively aligned, and the core conclusions of our baseline model are unchanged.
7-variable SVAR with inflation: Microlevel evidence.

5.3 International trade
We conduct a final robustness test by augmenting our model to include the trade balance. While international trade is a fundamental component of China’s economic growth, its effects—such as resource reallocation, technology spillovers, and efficiency improvements—typically manifest over time rather than instantaneously. We therefore impose zero restrictions on most contemporaneous relationships.
The equation for the international trade is:
 \begin{equation} NX_{t}=\alpha _{nx,y}y_{t}+\alpha _{nx,g}g_{t}+\alpha _{nx,\tau }\tau _{t}+\alpha _{nx,m}m_{t}+\alpha _{nx,Is}Is_{t}+\alpha _{nx,Ip}Ip_{t}+\varepsilon _{nxt} \end{equation}
We proxy net exports using the log ratio of exports to imports.Footnote
20
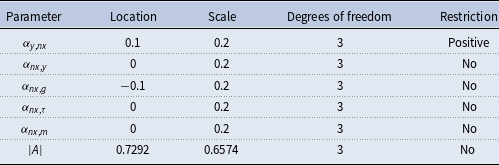
In our identification, trade is restricted to affect only output contemporaneously, and we impose a positive prior on the elasticity
 $\alpha _{y,nx}$
with a location parameter of 0.1 and a scale parameter of 0.2. All other variables are assumed to be unaffected by trade within the period.
This zero restriction on the monetary response (
 $\alpha _{m,nx}=0$
) is justified by two factors. First, although strict capital controls and mandatory currency conversion for trade companies would, in theory, increase the money supply, the People’s Bank of China actively sterilizes such exogenous inflows to maintain its monetary policy targets. Second, the timing of goods flows and corresponding payments often does not coincide, further weakening the case for a contemporaneous link.
Our identification strategy assumes that investment does not affect net exports contemporaneously. We do, however, allow for a direct effect of output (
 $y$
) on net exports, while remaining agnostic about its sign. The impact of fiscal and monetary policy on the trade balance is theoretically ambiguous, as it depends on the specific policy implementation and its transmission through channels such as capital flows, interest rates, and exchange rates. Nevertheless, empirical studies, including those by Lane and Perotti (Reference Lane and Perotti1998), Monacelli and Perotti (Reference Monacelli and Perotti2010), Miyamoto et al. (Reference Miyamoto, Nguyen and Sheremirov2019), and Ferrara et al. (Reference Ferrara, Metelli, Natoli and Siena2021), consistently find that increased government spending deteriorates the trade balance. In line with this evidence, we center the prior for
 $\alpha _{nx,g}$
around a negative value but do not impose a binding sign restriction. For the remaining policy variables, the priors are centered around zero. Complete details of all prior specifications for trade-related parameters are provided in Table 6.
7-variable SVAR with NX: Prior distribution

As shown in Figures 10 and 11, the IRF results under this specification exhibit minor quantitative differences but are qualitatively consistent with those from our baseline model, demonstrating the robustness of our findings.
7-variable SVAR with NX: Investment difference between SOEs and non-SOEs.

7-variable SVAR with NX: Microlevel evidence.

6. Conclusion
This paper adds to a growing body of literature in recognizing that even four decades after its market-oriented reforms began, China’s economy cannot be adequately assessed by simply applying models designed for other countries. Our findings demonstrate the critical importance of accounting for SOEs when analyzing China’s macroeconomic dynamics. Given SOEs’ substantial share in the economy and their fundamentally different responses to economic shocks, standard analytical frameworks inevitably miss essential aspects of the economic picture. The IRFs from our SVAR analysis, corroborated by microeconometric panel models, confirm SOEs’ crucial role in fiscal policy transmission. This suggests the Chinese government may leverage its direct control over SOEs to advance fiscal policy objectives. While this research represents an important initial step, China’s highly coordinated policy system raises numerous questions worthy of further investigation—particularly regarding SOEs’ roles in different policy contexts, such as price stabilization and poverty reduction, both priority areas for China’s current leadership.
Although China’s economy possesses unique characteristics, SOEs—and correspondingly, governments’ capacity for direct economic intervention—represent a global phenomenon, particularly prevalent in emerging markets. In India, for example, SOEs operate in approximately 60% of economic sectors (based on NACE two-digit classification). The significance of government business activity becomes even more apparent when examining “businesses-of-state”-firms with at least 10% government ownership, as included in some of our empirical specifications. In EU member states Poland, Italy, and Hungary, governments participate in over 90% of sectors through such businesses-of-state.Footnote 21 While the specific policies implemented and degree of control exercised over these enterprises may vary across countries, it stands to reason that they are utilized to support governmental fiscal objectives to at least some extent.
A. Identification strategy: Baumeister and Hamilton (Reference Baumeister and Hamilton2019)
We briefly present the identification method by Baumeister and Hamilton (Reference Baumeister and Hamilton2019).
 \begin{equation} AY_{t}=B X_{t-1}+\epsilon _{t}, \end{equation}
where
 $Y_{t}=(y_{t}, g_{t},\tau _{t},m_{t},is_{t},ip_{t})'$
,
 $X_{t-1}'=(y_{t-1}',y_{t-2}'\ldots .,y_{t-m}',1)$
.
 $\epsilon _{t}$
is the vector of i.i.d. structural shocks where
 $\epsilon _{t}\sim N(0,D)$
, and
 $D$
is a diagonal matrix.
We will set the priors for elements in A which will be represented with the density function
 $p(A)$
. We should notice that the elements in
 $A^{-1}$
are nonlinear combinations of elements in A. We set up the priors for elements of A and some nonlinear combinations of elements of
 $A$
. By following Baumeister and Hamilton (Reference Baumeister and Hamilton2019), we will use the Student’s t-distribution with degrees of freedom of 3 for the priors for A and some elements in
 $A^{-1}$
.
The priors about D conditional on A follow gamma distribution
 $\Gamma (\kappa _{i},\tau _{i})$
for
 $d_{ii}^{-1}$
, which is the inverse of the diagonal element of D.
 \begin{equation*}p\big(d_{ii}^{-1}|A\big)= \begin{cases} \dfrac {\tau _{i}^{\kappa _{i}}}{\Gamma (\kappa _{i})}\big(d_{ii}^{-1}\big)^{(\kappa _{i}-1)}exp\big({-}\tau _{i}d_{ii}^{-1}\big) & \text{if $d_{ii}^{-1}\geq 0$}\\[12pt] 0 & \text{otherwise} \end{cases} \end{equation*}
 \begin{equation} p(D|A)=\prod p(d_{ii}|A) \end{equation}
The priors about matrix B follow Gaussian distribution
 $b_{i}|A,D\sim N(m_{i},d_{ii}M_{i})$
.
 \begin{equation} p(b_{i}|D,A)=\frac {1}{(2\pi )^{k/2}|d_{ii}M_{i}|^{1/2}}exp[{-}(1/2)(b_{i}-m_{i})'(d_{ii}M_{i})^{-1}(b_{i}-m_{i})'] \end{equation}
 \begin{equation} p(B|D,A)=\prod p(b_{i}|D,A) \end{equation}
For detailed set up of
 $m_{i}$
and
 $M_{i}$
as well as the implementation of the method, please refer to the original work Baumeister and Hamilton (Reference Baumeister and Hamilton2019).
B. Robustness test: IRFs
7-variable SVAR with consumption: Response to a government size shock.

7-variable SVAR with consumption: Response to a stimulus shock.

7-variable SVAR with inflation: Response to a government size shock.

7-variable SVAR with inflation: Response to a stimulus shock.

7-variable SVAR with NX: Response to a government size shock.

7-variable SVAR with NX: Response to a stimulus shock.