Accurate and consistent measurement of cardiac function in patients with CHD is essential for management, and has both prognostic implications as well as effects on routine clinical decision making.Reference Brown, Jenkins and Marwick 1 , Reference Koestenberger, Friedberg, Ravekes, Nests and Hansmann 2 Left ventricular systolic function is currently evaluated using standard two-dimensional echocardiographic imaging by calculating ejection fraction, per cent fractional shortening, and tissue Doppler imaging. These modalities, however, have limitations due to inherent issues with geometry, image quality, and subjectivity.Reference Ammar, Paterick and Khandheria 3 – Reference Nesser, Mor-Avi and Gorissen 5
Speckle-tracking echocardiography is a newer technique that attempts to quantify regional tissue deformation by continuous frame-by-frame tracking of acoustic speckles.Reference Brown, Jenkins and Marwick 1 This technique proves to be promising for the evaluation of cardiac function because of its capability to examine altered myocardial mechanics and regional dysfunction, even when standard echocardiographic measurements remain within the normal range.Reference Li, Li and Bai 6 , Reference Urbano-Moral, Arias-Godinez and Ahmad 7 In previous studies, two-dimensional speckle-tracking techniques have been shown to provide comparable results with tissue Doppler imaging and cardiac magnetic resonance imaging;Reference Zhou, Ashraf and Hu 8 however, this modality still has limitations given the three-dimensional nature of cardiac deformation, which leads to loss of some speckles due to out-of-plane motion.Reference Seo, Ishizu and Enomoto 9 – Reference Zhang, Gao and Xie 11
Although three-dimensional speckle-tracking echocardiography can overcome most of the two-dimensional limitations, experience with this technique is less extensive to date. It has been suggested that three-dimensional speckle-tracking echocardiography may be a more accurate tool for the segmental assessment of left ventricular function.Reference Altman, Bergerot and Aussoleil 12 , Reference Urbano-Moral, Patel, Maron, Arias-Godinez and Pandian 13 Recent studies in adults have shown that three-dimensional speckle-tracking echocardiography has comparable accuracy and reproducibility with cardiac magnetic resonance imaging in measuring left ventricular volume and ejection fraction;Reference Jenkins, Bricknell, Hanekom and Marwick 14 – Reference Mor-Avi, Jenkins and Kühl 17 however, this technique has not been assessed well in children with CHD.
The aims of this study were, therefore, to determine the feasibility and variability of three-dimensional speckle-tracking imaging in children with a wide spectrum of CHD in comparison with two-dimensional speckle-tracking echocardiography, and their correlation with traditional measures of ventricular function, including ejection fraction and fractional shortening.
Materials and methods
This was a retrospective study approved by the Institutional Review Board at Seattle Children’s Hospital. Children with biventricular circulation and systemic left ventricle who had both two- and three-dimensional images obtained during the same echocardiographic evaluation at our institution between January of 2010 and December of 2014 were eligible to be included in the present study. The three-dimensional images in these patients were obtained somewhat randomly on the basis of clinical indications. Patients were excluded if they had incomplete echocardiographic imaging or an inadequate frame rate (<15 frames/second) to complete the three-dimensional analysis. Each patient’s clinical and demographic data, including the underlying cardiac diagnosis, age, and sex, were obtained from the echocardiogram reports or the individual medical record.
Echocardiographic studies
All transthoracic echocardiograms were performed with the Phillips ultrasound system “iE33” (Phillips Medical System, Andover, Massachusetts, United States of America). The usual routine images were obtained as per institutional protocol and stored in digital format for offline analysis using Syngo Dynamics workstation (SiemensMedical Solutions, Inc., Syngo Dynamic Solutions, Ann Arbor, Michigan, United States of America). Traditional echocardiographic parameters of left ventricular systolic function were analysed using standard techniques in accordance with the American Society of Echocardiography guidelines.Reference Lopez, Colan and Frommelt 18 Fractional shortening was calculated from standard M-mode measurements in the parasternal short-axis view at the level of the papillary muscles. Ejection fraction was calculated from two-dimensional images using the area–length method. Apical four-chamber and parasternal short-axis views at the level of papillary muscles obtained with the highest possible frame rates were used for the two-dimensional analysis. Full-volume three-dimensional data were acquired using a three-dimensional matrix-array transducer. Each study was stored digitally in a cineloop format for post-acquisition processing; three-dimensional ejection fraction was also obtained from full-volume three-dimensional data.
Speckle-tracking imaging
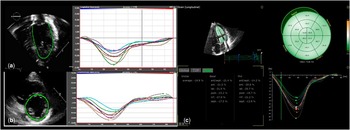
Automated tracking of myocardial deformation was performed offline using vector velocity imaging (TomTec Imaging Systems, Munich, Germany) for determining longitudinal, circumferential, and radial strains (Fig 1). The strain analysis was performed by a single reader blinded to the patients’ clinical status. Endocardial tracings of the left ventricle were manually performed in the apical four-chamber view for longitudinal measurements, and in the parasternal short-axis view at the level of the mid papillary muscles for circumferential and radial measurements. A single cardiac beat with the best-appearing image quality was used. Tracking was automatically performed by the software, and the analysis was accepted as satisfactory only after visual inspection. If tracking was suboptimal, the endocardial border was re-traced. If satisfactory tracking was not accomplished after three re-tracings, the non-tracking segments were excluded from the analysis. If more than three of six, inclusive, segments had poor tracking, the study was excluded. In our study, 4.5% of the segments were excluded from the analysis because of the inability to adequately track movement of the endocardial border. The acquisition frame rate on two-dimensional echocardiographic images was 50–90 frames/second.
( a ) Representative two-dimensional (2D) speckle-tracking imaging in the apical four-chamber view (left) and LS tracking (right), and ( b ) representative 2D speckle-tracking imaging in the parasternal short-axis view, at the level of the papillary muscle, view (left), and CS tracking (right), and ( c ) representative three-dimensional speckle-tracking imaging (left) and LS tracking (right). CS=circumferential strain; LS=longitudinal strain.

Left ventricular circumferential and radial strains were measured from the parasternal short-axis view at the mid-ventricular level, showing both papillary muscles. Peak systolic strain was measured in the anterior, anterolateral, inferolateral, inferior, inferoseptal, and anteroseptal segments. Mean circumferential and radial strains were calculated as the mean value of these six segmental measurements. Longitudinal strain was measured from the apical four-chamber in the basal, mid, and apical septal and lateral wall segments. Longitudinal strain was also calculated as the mean value of these six segmental measurements.
For three-dimensional speckle-tracking analysis, the best full-volume three-dimensional data set with minimal amount of dropout was analysed on a separate computer workstation (four-dimensional left ventricular analysis version 3.1; TomTec Imaging Systems). After the left ventricular long axis was manually aligned in three apical views – that is, four-, three-, and two-chamber views – the software automatically identified the left ventricular endocardial border and tracked it throughout the cardiac cycle, resulting in a dynamic cast of the left ventricular cavity. Endocardial contours were manually adjusted when necessary to optimise boundary position and tracking. Subsequently, using the standard 16-segment model, the peak longitudinal, radial, and circumferential strain values were obtained. The mean frame rate of the three-dimensional data sets in our study patients was 19±3 frames/second. Representative two-dimensional and three-dimensional speckle-tracking images are presented in Figure 1. The analysis on 25 randomly selected patients was repeated by the same observer after 4 weeks to obtain intra-observer variability and by a second observer to obtain inter-observer variability.
Statistical analysis
Data are reported as means and standard deviations or as medians and ranges for continuous variables and as frequencies for categorical variables. Correlation analysis was performed between ejection fraction and fractional shortening as well as two-dimensional and three-dimensional strain values using Spearman’s rank correlation coefficient. All statistical analyses were performed using Statistical Package for the Social Sciences 19.0 (IBM Corporation, Chicago, Illinois, United States of America). Statistical significance was defined as a p-value<0.05. Agreement between measurements was assessed using techniques described by Bland and Altman.Reference Bland and Altman 19 Agreement for each measurement was expressed as 2 SD of the inter-reader measurement differences – repeatability coefficient. This reflects the maximum expected within-patient difference between two measurements, and a lower value is desirable. Inter-reader measurement variability was also assessed using intra-class correlation coefficients and coefficient of variation.
Results
A total of 31 patients met inclusion criteria. Only one patient was excluded because of inadequate frame rate for three-dimensional analysis, yielding a total of 30 echocardiograms for review. The median age of the patients was 3.6 years (with a range from 0.1 to 22 years), and 19 (61%) of them were males. The diagnoses included double-outlet right ventricle in three (10%), left heart obstructive lesions affecting the mitral or aortic valve or the aortic arch in 14 (45%), atrial and/or ventricular septal defects in five (16%), and other in eight patients (26%) (Table 1).
Summary of patient characteristics.

ASD=atrial septal defect; VSD=ventricular septal defect
Data presented as median values (range) or counts (%)
Systolic function
Left ventricular systolic function was considered normal by qualitative evaluation in 27 (90%) patients. The mean fractional shortening by traditional M-mode measurement was 34.6±5.3, and the mean ejection fraction by bullet method was 62.0±6.4%. The mean peak longitudinal strain by two-dimensional speckle-tracking was −19.9±3.5% compared with −20.0±3.7% by three-dimensional speckle-tracking analysis. Similarly, the peak circumferential strain was −21.1±3.9% by two-dimensional and −22.1±3.9% by three-dimensional analysis, and the peak radial strain by two-dimensional analysis was 28.1±11.8% compared with 34.4±6.8% by three-dimensional analysis (Table 2).
Traditional and strain echocardiographic parameters.

2D=two dimensional; 3D=three dimensional; CS=peak circumferential strain; LS=peak longitudinal strain; RS=peak radial strain
Echocardiographic data presented as mean values (SD) or counts (%)
Correlations
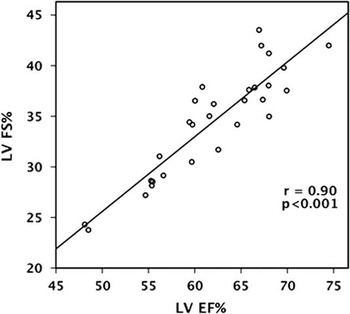
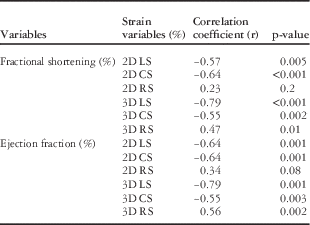
The correlations between different measures of speckle tracking and standard measures of ventricular function are shown in Table 3. Fractional shortening correlated with two-dimensional longitudinal strain (r=−0.57, p=0.005) and two-dimensional circumferential strain (r=−0.64, p⩽0.001), but not with two-dimensional radial strain (r=0.23, p=0.2). The strongest correlation with fractional shortening was seen with three-dimensional longitudinal strain (r=−0.79, p⩽0.001), but there were also moderate correlations with three-dimensional circumferential strain (r=−0.55, p=0.002) and three-dimensional radial strain (r=0.47, p=0.01). Ejection fraction correlated with two-dimensional longitudinal strain (r=−0.64, p=0.001), and two-dimensional circumferential strain (r=−0.64, p=0.001), but not with two-dimensional radial strain (r=0.34, p=0.08). The strongest correlation with ejection fraction was again with three-dimensional longitudinal strain (r=−0.79, p=0.001), but there were also correlations with three-dimensional circumferential strain (r=−0.55, p=0.003) and radial strain (r=0.56, p=0.002). There was a very good correlation between fractional shortening and ejection fraction of 0.90 (p⩽0.001) as shown in Figure 2. The mean three-dimensional ejection fraction was 57±6%. The strongest correlation of three-dimensional ejection fraction was seen with three-dimensional longitudinal strain (r=−0.80, p⩽0.001), but there were also good correlations with two-dimensional longitudinal strain (r=−0.75, p⩽0.001).
Graph showing correlation between two-dimensional fractional shortening (FS) and ejection fraction (EF).

Summary of correlations.

2D=two dimensional; 3D=three dimensional; CS=peak circumferential strain; LS=peak longitudinal strain; RS=peak radial strain
Correlation data between traditional echocardiographic parameters, 2D, and 3D speckle-tracking imaging
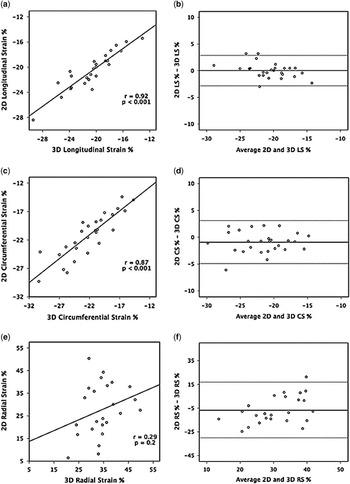
There was excellent correlation of 0.92 (p⩽0.001) between two-dimensional and three-dimensional peak longitudinal strain (Fig 3a and b), and good correlation of 0.87 (p⩽0.001) between two-dimensional and three-dimensional peak circumferential strain (Fig 3c and d). The correlation between two-dimensional and three-dimensional peak radial strain, however, was not significant (r=0.29, p=0.2) (Fig 3e and f). When we performed subanalysis comparing the six segments of two-dimensional global longitudinal, radial, and circumferential strain values with the corresponding six segments from the three-dimensional analysis, the overall the results were very similar. In addition, we found no significant differences for patients with intra-cardiac procedures such as ventricular septal defect compared with those without.
Summary of variability and correlations between two-dimensional (2D) and three-dimensional (3D) speckle-tracking imaging. ( a ) Correlation of 2D and 3D longitudinal strain (LS). ( b ) Bland–Altman plot showing inter-observer agreement of 2D and 3D LS. ( c ) Correlation of 2D and 3D circumferential strain (CS). ( d ) Bland–Altman plot showing inter-observer agreement of 2D and 3D CS. ( e ) Correlation of 2D and 3D radial strain (RS). (f) Bland–Altman plot showing inter-observer agreement of 2D and 3D RS.

Feasibility and variability
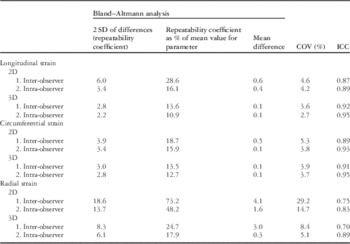
Measurement of both two-dimensional and three-dimensional strain values was feasible in >95% of the segments. Offline analysis time was ~4.0±1.6 minute for three-dimensional speckle-tracking imaging and 5.1±2.1 minutes for two-dimensional speckle-tracking imaging. The measures of repeatability and intra-class correlation coefficient values are listed in Table 4.
Variability for two-dimensional (2D) and three-dimensional (3D) strain.

COV=coefficient of variation; ICC=intra-class correlation coefficient
The inter- and intra-observer variabilities were better for three-dimensional speckle-tracking measurements than for two-dimensional speckle-tracking measurements overall, and were better for both two-dimensional and three-dimensional longitudinal and circumferential strains compared with radial strain. The repeatability coefficient – 2 SD of the difference – expressed as a percentage of the population mean for each parameter was 2.2–3.0% for three-dimensional longitudinal and circumferential strains compared with 3.4–6.0% for two-dimensional longitudinal and circumferential strains; however, repeatability coefficients were higher for radial strain, with 6.1–8.3% for three-dimensional and 13.7–18.6% for two-dimensional measurements. Values for intra-class correlation coefficient were also better for three-dimensional longitudinal and circumferential strain (0.91–0.95) in comparison with two-dimensional strain (0.87–0.93). Again, the intra-class correlation coefficient for radial strain was lower for both two-dimensional and three-dimensional imaging at 0.70–0.89. The coefficient of variation % also had similar values as shown in Table 4.
Discussion
Early diagnosis of myocardial dysfunction is essential in children with CHD for their management.Reference Brown, Jenkins and Marwick 1 , Reference Koestenberger 20 Strain imaging has the potential to overcome most of the limitations of traditional echocardiographic measures of systolic function. Our study has shown that left ventricular three-dimensional speckle-tracking echocardiography analysis is feasible and reproducible in children with CHD in comparison with two-dimensional speckle-tracking echocardiography. There is good correlation between two-dimensional and three-dimensional longitudinal and circumferential strains, but not radial strain. Overall, the reproducibility of three-dimensional speckle-tracking echocardiography is better compared with two-dimensional speckle-tracking echocardiography. In addition, offline analysis is shorter for three-dimensional compared with two-dimensional speckle-tracking echocardiography.
Traditional transthoracic echocardiographic measures of systolic function have several limitations including load dependency and geometric assumptions that are even worse in CHD patients.Reference Koestenberger, Friedberg, Ravekes, Nests and Hansmann 2 , Reference Abraham and Nishimura 21 – Reference Forsey, Friedberg and Mertens 23 Fractional shortening mainly evaluates circumferential fibre shortening; two-dimensional ejection fraction is also load dependent and has limitations with border detection. The regional wall motion abnormalities, in particular, are not well identified by these function assessment parameters. Deformation imaging by speckle-tracking echocardiography has the advantages of overcoming all these limitations by tracking natural acoustic markers – “speckles” – throughout the cardiac cycle. It is angle independent and measures myocardial contractility while accounting for regional wall motion abnormalities.Reference Luis, Yamada and Khandheria 4 , Reference Saha, Kiotsekoglou and Toole 24 , Reference Luis, Yamada and Khandheria 25 In our study, although there was good correlation between traditional measures of ventricular function of fractional shortening and ejection fraction, it was only moderate with longitudinal and circumferential strain, and relatively weak with radial strain. These findings are similar to previous studies that have abundant evidence showing that abnormalities of myocardial strain can occur with a normal ejection fraction.Reference MacIver, Adeniran and Zhang 26 , Reference Kraigher-Krainer, Shah and Gupta 27
The use of two-dimensional speckle-tracking imaging has been more widespread to date than three-dimensional imaging, likely because of the fact that the images required for this analysis are part of the routine two-dimensional echocardiographic assessment and do not require additional tools such as the three-dimensional array transducer or specific image captures during the echocardiographic study, such as full-volume three-dimensional loops. There are, however, inherent limitations with two-dimensional speckle-tracking echocardiography; specifically, loss of speckles due to out-of-plane motion, foreshortened views, and geometric modelling, which can be accounted for by the three-dimensional method as it can track motion of speckles in all three dimensions, potentially making three-dimensional speckle-tracking echocardiography a more accurate representation of overall and regional myocardial function.Reference Nesser, Mor-Avi and Gorissen 5 , Reference Seo, Ishizu and Enomoto 9 , Reference Seo, Ishizu, Atsumi, Kawamura and Aonuma 28 This advantage, however, comes at a cost of lower frame rate that may alter its correlation with two-dimensional speckle-tracking echocardiography. In our study, three-dimensional speckle-tracking showed good correlation with two-dimensional speckle-tracking echocardiogram for longitudinal and circumferential strains, but not for radial strain, which is also consistent with the adult literature and previous studies that have shown radial strain to be less reproducible than longitudinal and circumferential strains.Reference Luis, Yamada and Khandheria 4 , Reference Serri, Reant and Lafitte 29 , Reference Maréchaux 30 In addition, in our study, none of the patients had regional wall motion abnormalities, which explains the close correlation between two-dimensional and three-dimensional longitudinal and circumferential strains; however, in patients with regional wall motion abnormalities, three-dimensional speckle-tracking echocardiography would pan out to be more advantageous to assess these differences.
Previous studies have shown a slight discrepancy in the strain values of three-dimensional speckle-tracking echocardiography in comparison with two-dimensional speckle-tracking echocardiography with some of them showing underestimation by three-dimensional longitudinal strainReference Saito, Okura and Watanabe 31 and overestimation by three-dimensional circumferential strain.Reference Altman, Bergerot and Aussoleil 12 , Reference Saito, Okura and Watanabe 31 In our study, strain values by three-dimensional speckle-tracking echocardiography were slightly larger than two-dimensional speckle-tracking echocardiography.
This study has also confirmed that three-dimensional speckle-tracking imaging can be performed efficiently without adding a significant amount of post-processing time to the study. This is consistent with previous studies in the adult population that have shown three-dimensional longitudinal strain to be a faster measure of systolic function than two-dimensional longitudinal strain.Reference Ammar, Paterick and Khandheria 3 , Reference Altman, Bergerot and Aussoleil 12 In our study, we have measured two-dimensional speckle-tracking echocardiography in one four-chamber view and one short-axis view. If extensive evaluation by two-dimensional speckle-tracking echocardiography is performed including three longitudinal and three short-axis views, then it would increase analysis time, making three-dimensional assessments much faster in comparison.
In comparison with two-dimensional speckle tracking, three-dimensional speckle tracking was found to have better intra- and inter-observer agreements, suggesting a role for this methodology in longitudinal assessment of function in patients with CHD. Unlike structurally normal hearts, CHD results in different geometry that may be better served by the three-dimensional evaluation. The three-dimensional software currently available also allows for less subjectivity in its measurements as more data points are automatically calculated for the user.
Limitations
This study was limited by the heterogeneous patient population and small sample size. We have measured two-dimensional speckle-tracking echocardiography only in one four-chamber view and one short-axis view. These findings are also limited to patients with biventricular physiology and systemic left ventricle and cannot be extrapolated to the systemic right ventricle. Given the high inter-vendor variability of strain measurements based on ultrasound systems,Reference Gayat, Ahmad, Weinert, Lang and Mor-Avi 32 , Reference Badano, Cucchini, Muraru, Al Nono, Sarais and Iliceto 33 these results also may not be valid for other vendors. The applicability of these data is limited by the fact that there is no gold standard modality for comparison, such as myocardial resonance imaging tissue tagging. It is, therefore, difficult to determine which of these two modalities is providing the true value; however, previous studies have shown good correlation between three-dimensional strain parameters and myocardial resonance imaging for left ventricular ejection fraction in a small sample size.Reference Altman, Bergerot and Aussoleil 12 In addition, the utility of three-dimensional speckle-tracking echocardiography may be even more pronounced in children with regional wall motion abnormalities.
Conclusions
Left ventricular three-dimensional speckle-tracking echocardiography is a simple, feasible, and reproducible method for strain assessment in children with CHD in comparison with two-dimensional speckle-tracking echocardiography. There is a strong correlation between two-dimensional and three-dimensional longitudinal and circumferential strain, but not radial strain. Overall, the reproducibility of three-dimensional speckle-tracking echocardiography is better compared with two-dimensional speckle-tracking echocardiography. Further longitudinal studies are warranted to assess the potential clinical application of this new technology in patients with CHD.
Acknowledgements
None.
Financial Support
This research received no specific grant from any funding agency, commercial or not-for-profit sectors.
Conflicts of Interest
None.
Ethical Standards
The authors assert that all procedures contributing to this work comply with the ethical standards of the relevant national guidelines on human experimentation and with the Helsinki Declaration of 1975, as revised in 2008, and have been approved by the institutional review board of Seattle Children’s Hospital.